
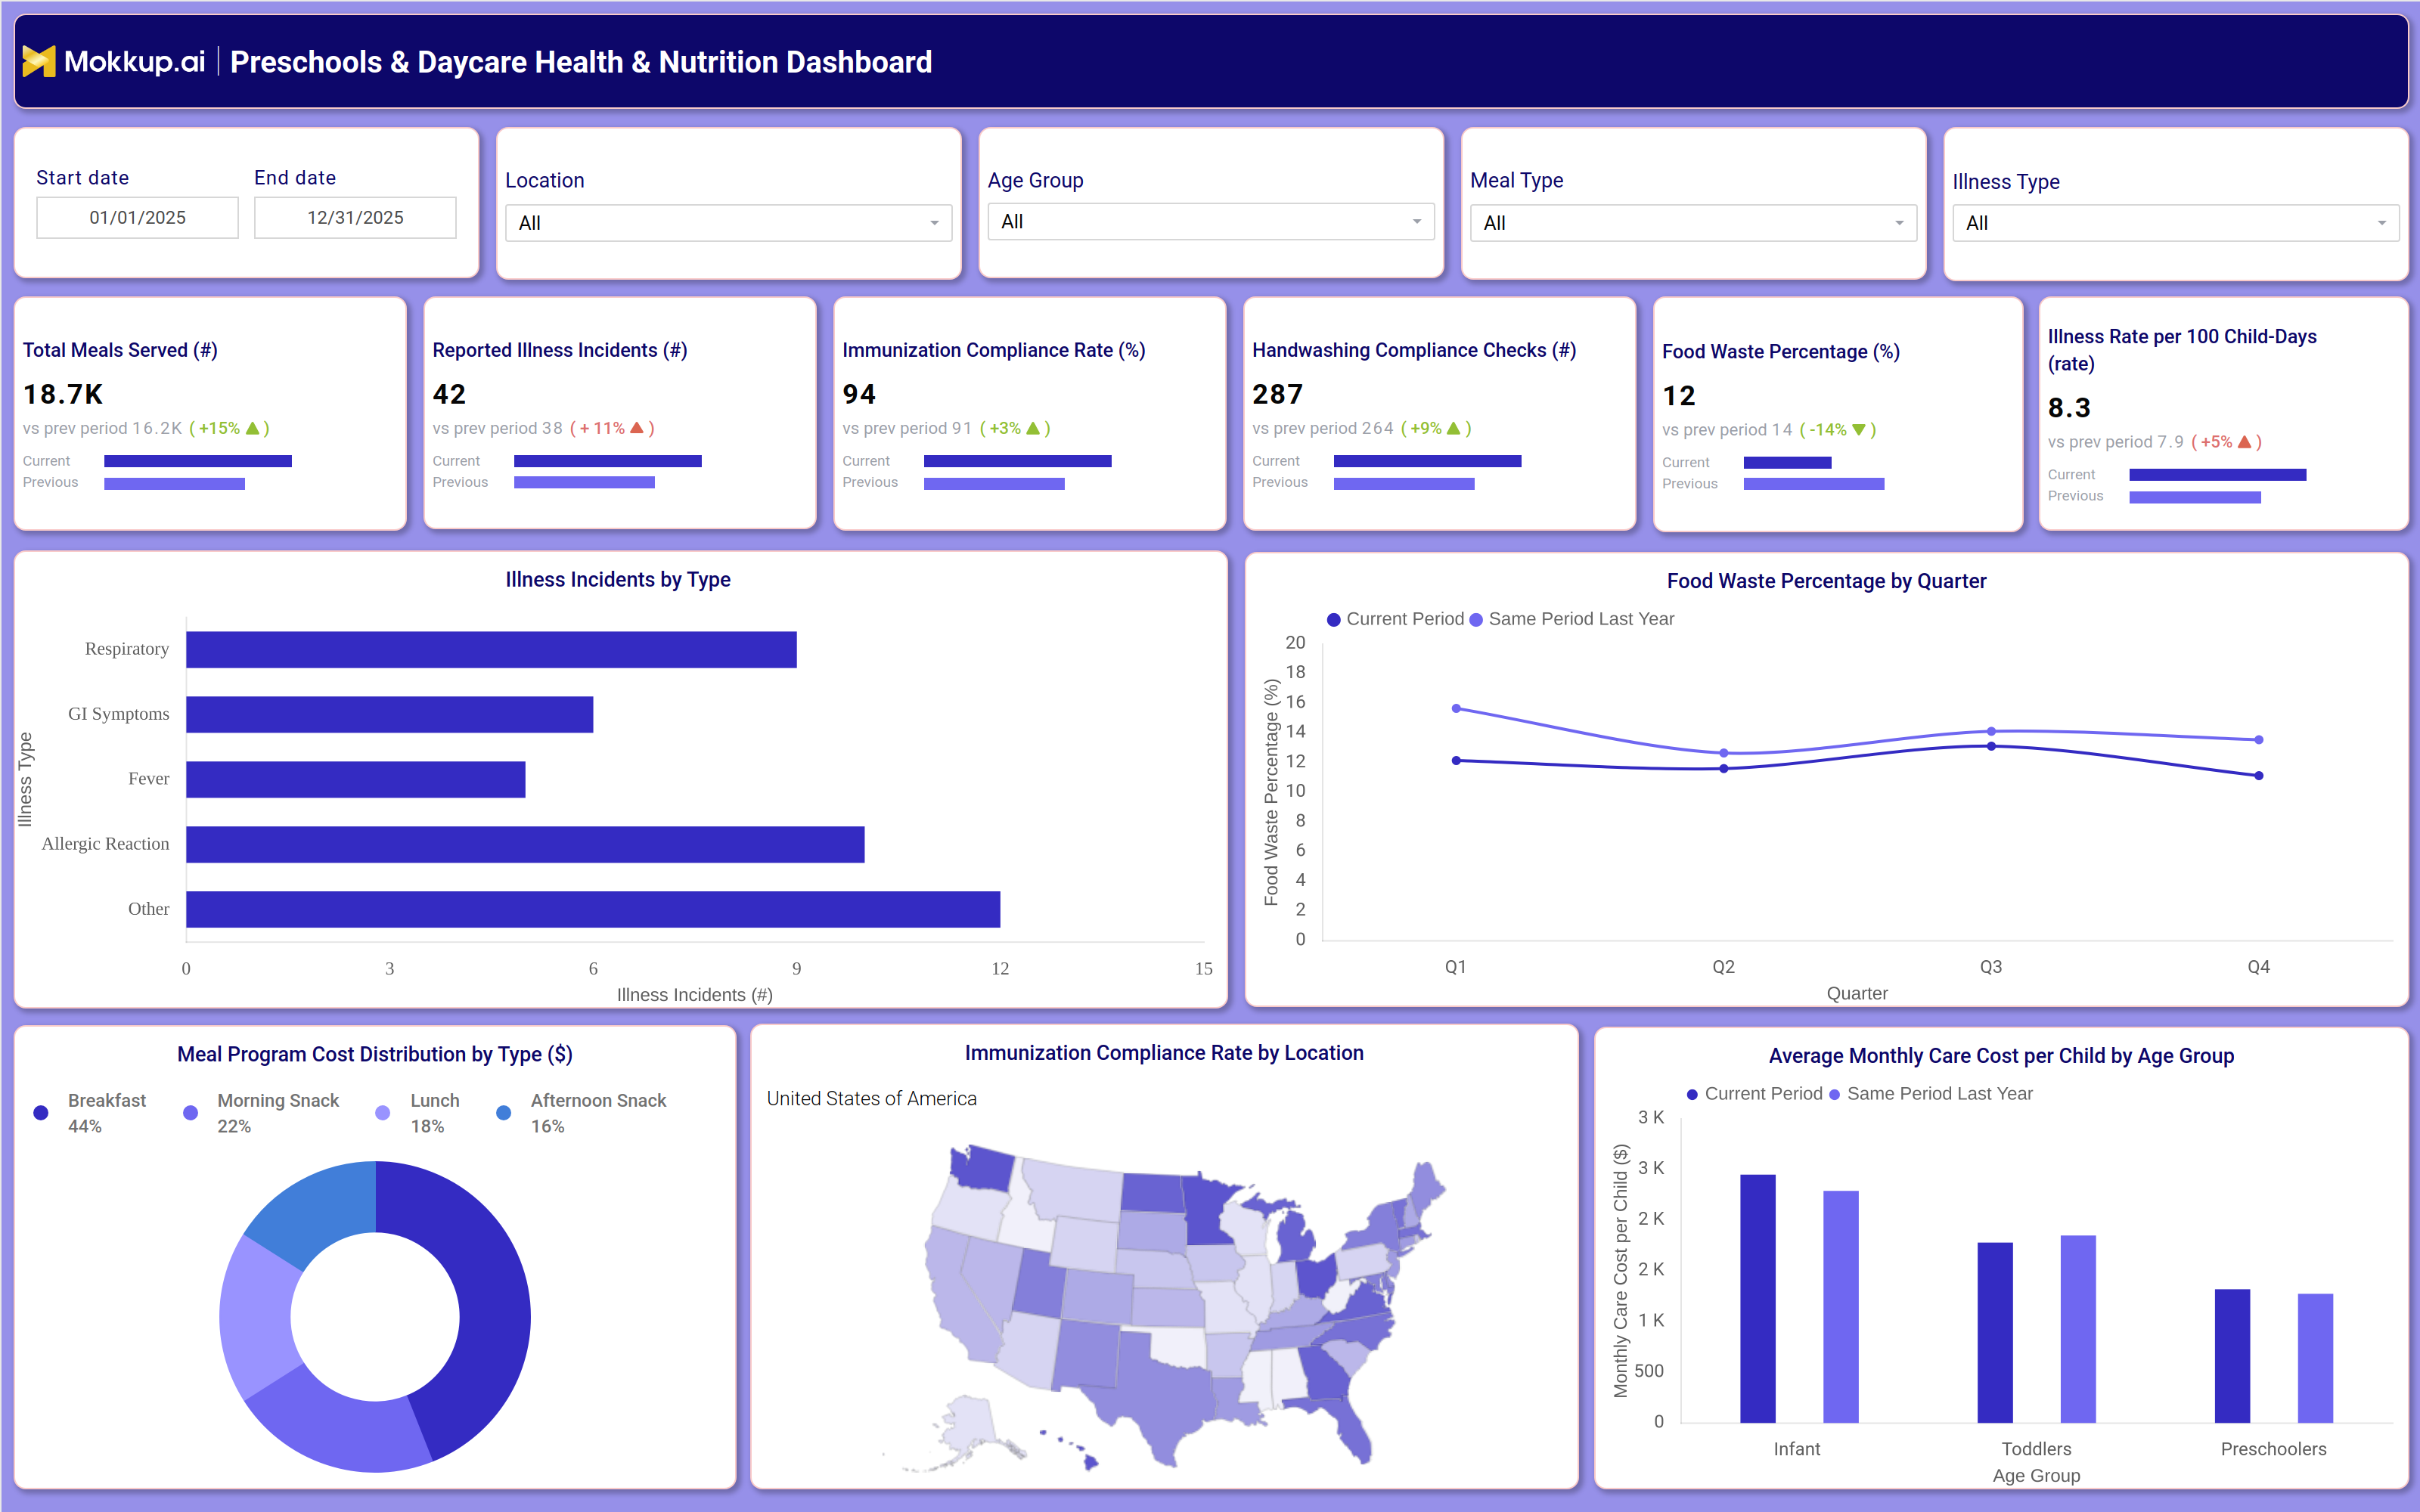
What is a Preschools & Daycare Health & Nutrition Dashboard?
The Preschools & Daycare Health & Nutrition Dashboard is a dashboard template built for childcare center directors, health coordinators, and daycare operations teams who need one consolidated view of meal programs, illness patterns, and immunization compliance. It brings together food service data, health incident reports, and hygiene compliance checks so administrators stop manually cross-referencing spreadsheets from kitchen staff, nurses, and enrollment records. Built on the Mokkup.ai platform, this daycare health and nutrition dashboard template lets operators filter by location, age group, meal type, and illness type across a custom date range, then drill into whichever metric needs attention, including immunization compliance rate tracking, without waiting on IT or a BI team. For multi-location preschool and daycare networks, this turns scattered wellness and nutrition records into one screen leaders can review before board meetings, licensing audits, or parent communications.
How to Create a Preschools & Daycare Health & Nutrition Dashboard
You don't need to build your report from scratch; just start with a ready-to-use dashboard template from Mokkup. Add in your data and export it however you like. Here's how to do it:
1. Create or Log in to Your Mokkup Account
Start by signing up on Mokkup.ai using your email. If you already have an account, just log in, and you'll be good to go.
2. Choose and Customize Your Dashboard Template
Find the Preschools & Daycare Health & Nutrition Dashboard template in the Templates section. Use the drag-and-drop editor to adjust KPIs, edit filters, or add elements based on your data.
3. Export to Your BI Tool
Once your dashboard wireframe is ready, use the BI Tool Export feature to send it directly to Power BI or Tableau for further analysis and enhancements. You can also download the dashboard as a PDF, PNG, or JPEG, embed it on a platform, or invite your team to collaborate.
Note: This is a Pro template. You'll need a Pro subscription on Mokkup to use and customize this dashboard wireframe. Upgrade anytime to unlock full access.
Preschools & Daycare Health & Nutrition Dashboard Example
A daycare operations director typically opens this daycare health and nutrition dashboard each week to check whether health and nutrition programs are on track before the next parent newsletter or licensing review. Filtering by location and date range narrows the view to a single center or the full network, and switching the age group or meal type filter reframes every visual around the segment under review. The starting question is rarely abstract — it is usually whether illness activity is rising in a specific room, or whether a menu change affected waste levels. From the KPI row, the director can gauge whether meals served, illness incidents, and hygiene checks are moving in a healthy direction against the prior period, and identify which metric needs attention.
If reported illness incidents climb, the director can pivot to the illness incidents by type breakdown to see whether respiratory cases, allergic reactions, or GI symptoms are driving the increase, and decide whether a classroom needs deeper cleaning protocols or parent notification. Food waste percentage tracking by quarter, compared against the prior year's same period, helps kitchen staff judge whether recent menu changes are actually reducing waste rather than shifting it to another quarter.
On the cost and compliance side, comparing monthly care cost per child across infant, toddler, and preschooler age groups lets finance teams see where per-child spending runs highest and whether it matches staffing ratios in that room. The meal program cost distribution chart shows kitchen managers how the budget splits across breakfast, morning snack, lunch, and afternoon snack, flagging if snack costs are quietly overtaking meal budgets. Reviewing immunization compliance rate by location surfaces which centers are lagging on documentation before a state inspection catches it first. Together, these views let daycare networks move from reactive incident logging to proactive health and nutrition management, catching cost overruns, hygiene gaps, and illness clusters early enough to act on rather than explain after the fact.
How to Analyze Data in a Preschools & Daycare Health & Nutrition Dashboard
Here is how you can analyze data from this dashboard:
- Compare center performance: Filter by location and date range to evaluate performance across individual centers.
- Track performance changes: Compare current KPI values with previous period results to identify shifts at a glance.
- Monitor illness trends: Review illness incidents by type to detect early clusters of respiratory or allergic cases.
- Evaluate food waste: Track quarterly food waste percentages against the same period last year to measure the impact of menu changes.
- Analyze meal costs: Break down the food budget by meal type to identify where spending is concentrated.
- Monitor immunization compliance: Use the location map to identify centers that are behind on immunization documentation.
Benefits of a Preschools & Daycare Health & Nutrition Dashboard
The following are the benefits of using this dashboard:
- Centralize operational reporting: Combine kitchen, health, and enrollment data into a single dashboard instead of manually cross-referencing records.
- Detect health issues early: Identify illness clusters by type to support timely parent communication and updated cleaning protocols.
- Track food waste trends: Monitor quarterly food waste percentages to measure the impact of menu changes over time.
- Simplify cost analysis: Group meal program spending and per-child care costs to speed up financial reviews.
- Improve compliance readiness: Identify immunization compliance gaps by location before licensing audits.
KPIs to Track in a Preschools & Daycare Health & Nutrition Dashboard
The following key KPIs can be tracked by using this dashboard:
- Total Meals Served — counts meals delivered across breakfast, snack, and lunch programs over the selected period.
- Reported Illness Incidents — tracks the number of health incidents logged across all monitored illness types.
- Immunization Compliance Rate — measures the share of enrolled children meeting required documentation, central to immunization compliance rate tracking ahead of inspections.
- Handwashing Compliance Checks — counts completed hygiene checks performed by staff during the period.
- Food Waste Percentage — shows the share of prepared food discarded rather than consumed.
- Illness Rate per 100 Child-Days — normalizes illness incidents against enrollment and attendance to compare centers fairly.
- Meal Program Cost Distribution — a chart-level metric showing how food budget splits across breakfast, morning snack, lunch, and afternoon snack.
- Average Monthly Care Cost per Child — a chart-level metric comparing per-child cost across infant, toddler, and preschooler age groups against the prior year.
Frequently Asked Questions
1. What is the Preschools & Daycare Health & Nutrition Dashboard used for?
It gives daycare and preschool operators one screen to monitor meal programs, illness trends, hygiene compliance, and immunization records. Directors use it to catch nutrition or health issues before they escalate into larger compliance or parent-relations problems.
2. Can I filter the dashboard by location or age group?
Yes, the dashboard includes filters for location, age group, meal type, and illness type, alongside a custom date range. This lets teams narrow the view to a single center or age band before comparing it against network-wide averages.
3. How does the dashboard support cost tracking for daycare programs?
The dashboard breaks down meal program cost distribution by meal type and tracks monthly care cost per child across infant, toddler, and preschooler age groups. This helps finance teams identify where nutrition and care spending is trending highest.