
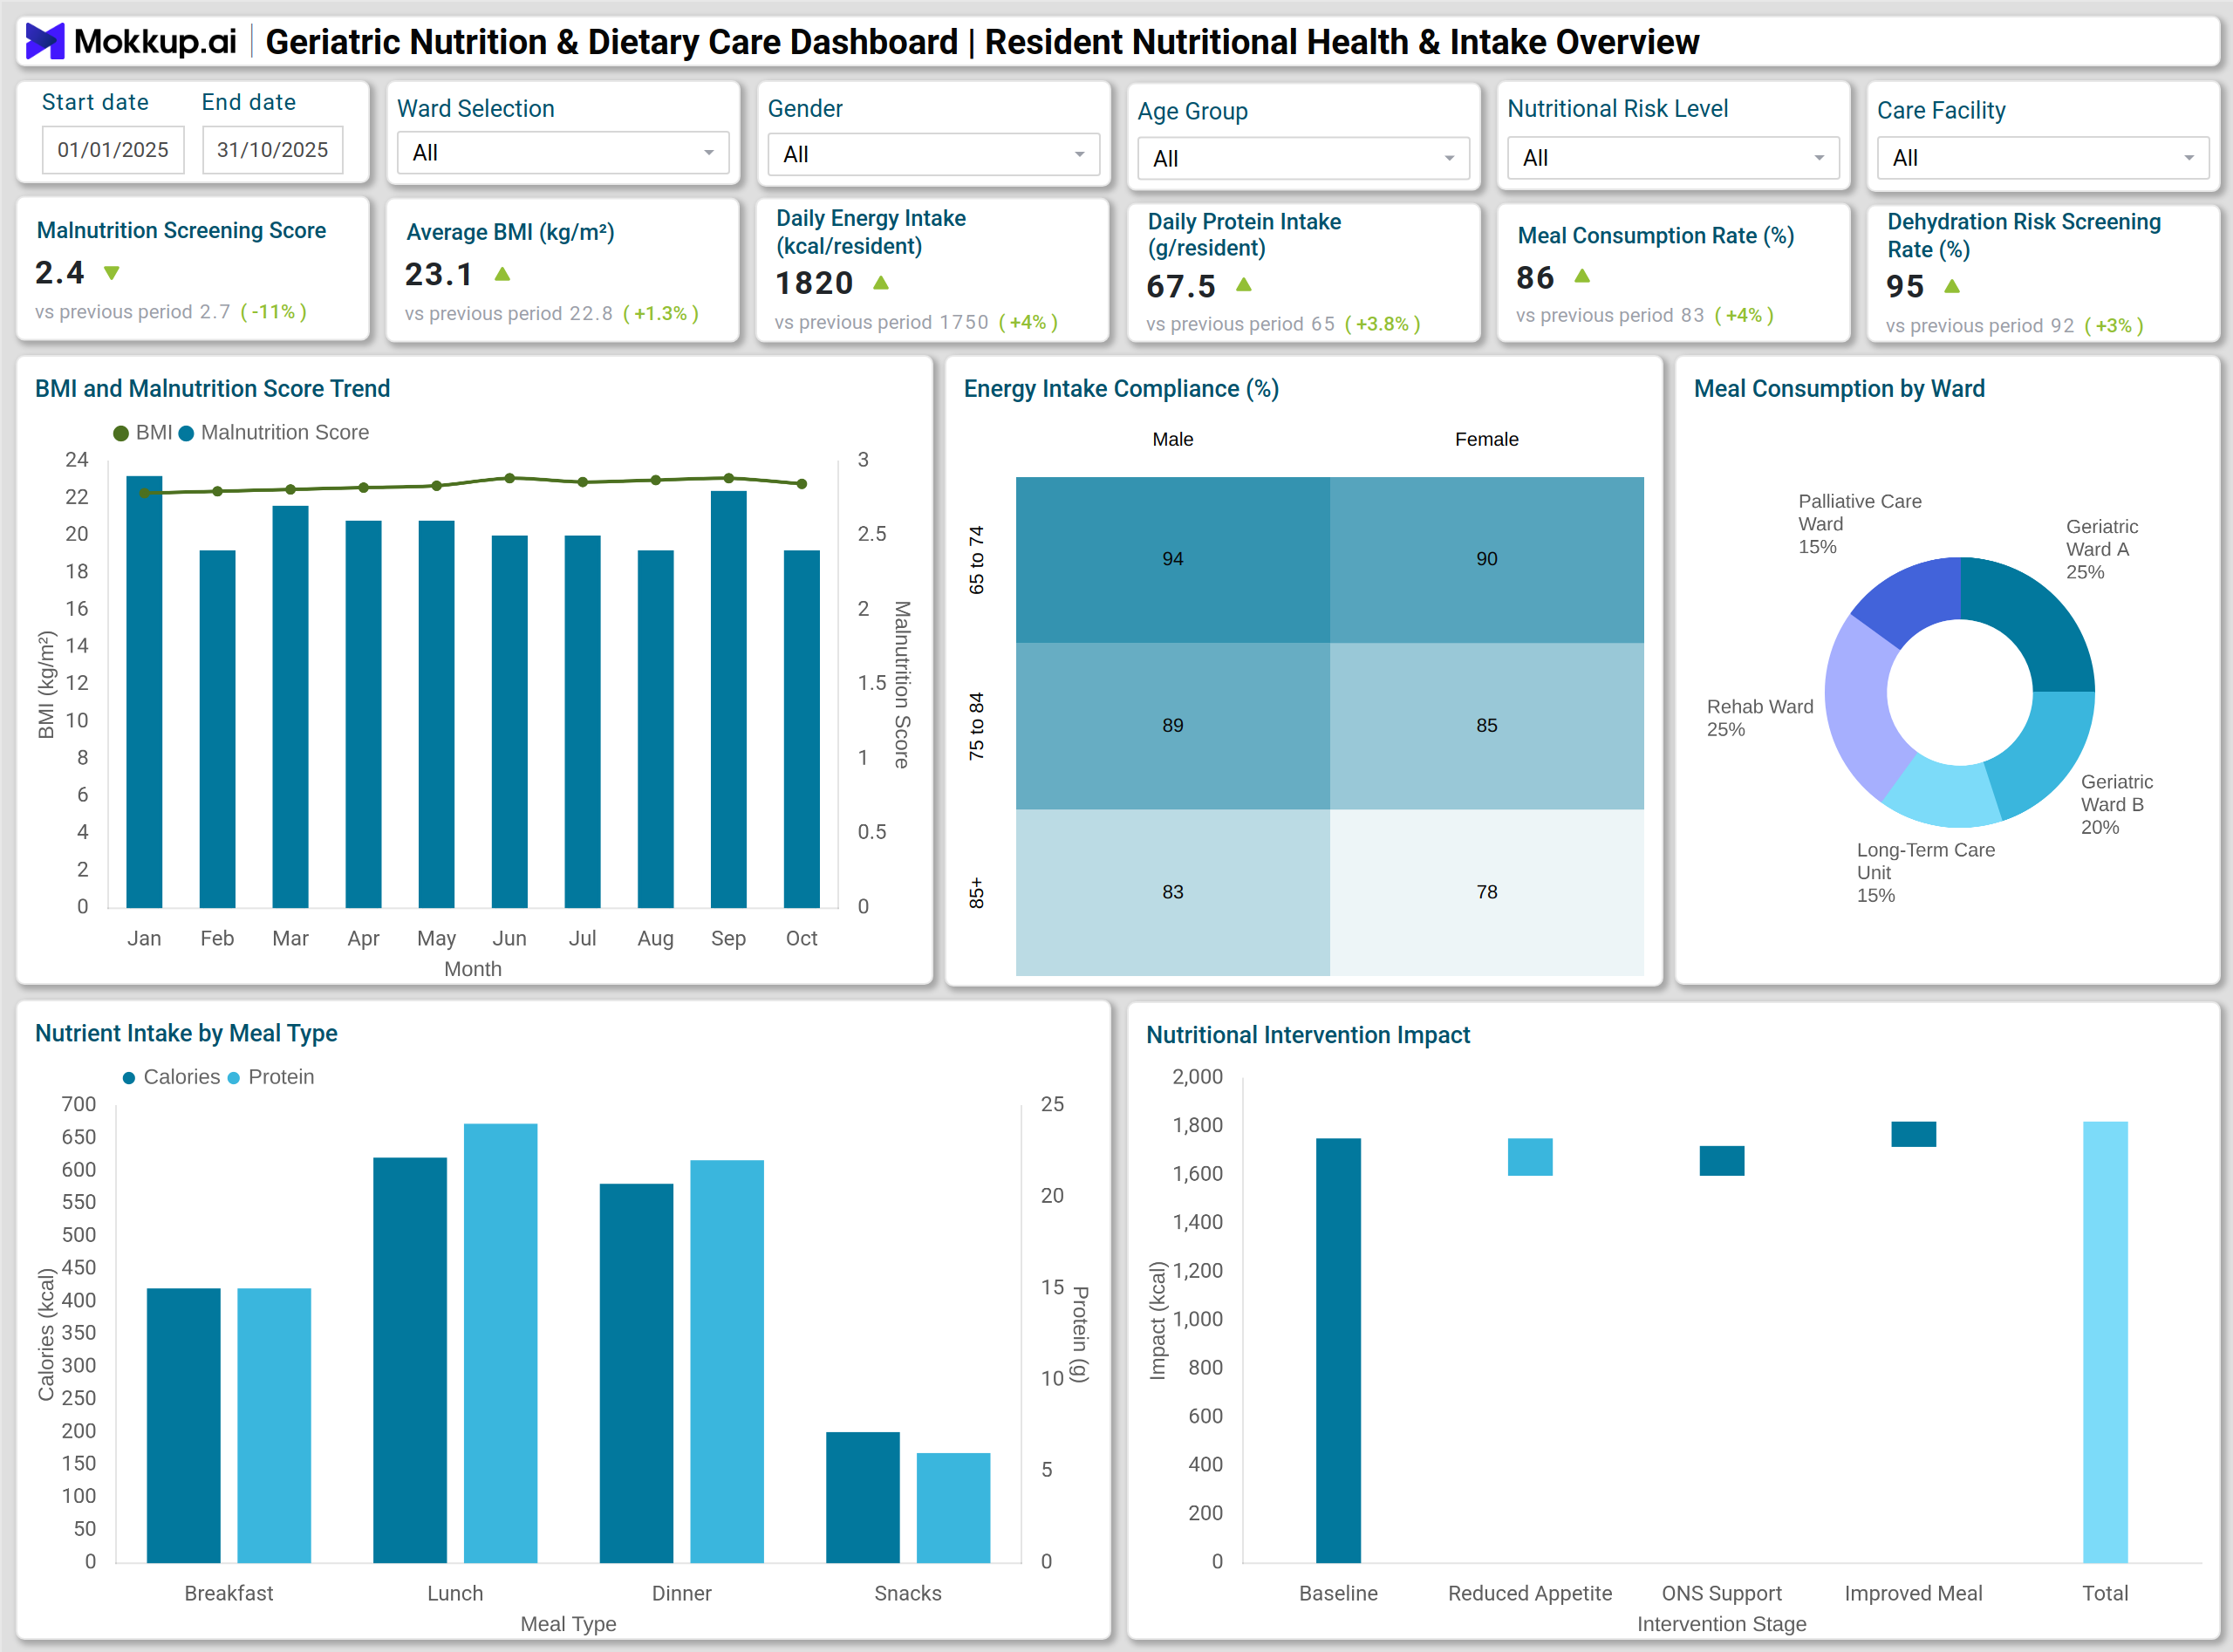
What is a Geriatric Nutrition & Dietary Care Dashboard?
A Geriatric Nutrition & Dietary Care Dashboard is a healthcare analytics solution that tracks and visualizes key nutrition and dietary performance indicators for elderly residents in long-term care or geriatric centers. It integrates data from meal services, dietitian assessments, and clinical screenings to provide a complete overview of resident nutrition, dietary compliance, and health outcomes. This dashboard enables care teams to monitor nutritional adequacy, assess therapeutic diet adherence, and ensure that every elderly patient receives balanced meals tailored to their specific condition. It supports continuous improvement in food service operations by highlighting trends in energy intake, protein adequacy, hydration status, and patient meal satisfaction. By utilizing a senior dietary monitoring analytics dashboard, healthcare facilities can transform raw food and nutrition data into actionable insights that enhance clinical outcomes, mitigate malnutrition risks, and optimize overall dietary care efficiency.
How to Create a Geriatric Nutrition & Dietary Care Dashboard
You don’t need to build your report from scratch—just start with a ready-to-use dashboard template from Mokkup. Add in your data and export it however you like. Here’s how to do it:
1. Create or Log in to Your Mokkup Account
Start by signing up on Mokkup.ai using your email. If you already have an account, just log in, and you’ll be good to go.
2. Choose and Customize Your Dashboard Template
Find the Geriatric Nutrition & Dietary Care Dashboard template in the Templates section. Use the drag-and-drop editor to adjust KPIs, edit filters, or add elements based on your data.
3. Export to Your BI Tool
Once your dashboard wireframe is ready, use the BI Tool Export feature to send it directly to Power BI or Tableau for further analysis and enhancements. You can also download the dashboard as a PDF, PNG, or JPEG, embed it on a platform, or invite your team to collaborate.
Note: This is a Pro template. You’ll need a Pro subscription on Mokkup to use and customize this dashboard wireframe. Upgrade anytime to unlock full access.
Geriatric Nutrition & Dietary Care Dashboard Example
A typical geriatric dietary assessment dashboard in healthcare combines patient nutrition metrics with visual insights that track dietary performance over time. For example, a Stacked Column Chart may show nutrient intake by meal type—breakfast, lunch, and dinner—helping dieticians assess calorie and protein distribution.
A Line Chart visualizes trends in BMI and malnutrition scores over a ten-month period, illustrating the impact of interventions on nutritional health. The Pie Chart displays meal consumption across wards, while a Heatmap highlights compliance with energy intake targets by age and gender. The Waterfall Chart illustrates how daily energy intake aligns with recommended standards, and the Bar Chart categorizes food costs for financial tracking. A Donut Chart presents the share of therapeutic diet types, whereas the Combo Chart links meal satisfaction and food waste over time. Finally, the Treemap visualizes oral nutritional supplement prescriptions by clinical condition, and a Funnel Chart evaluates food service efficiency from preparation to delivery.
This illustrates how the elderly nutrition performance tracking system enables administrators and dieticians to pinpoint inefficiencies, track patient progress, and make evidence-based dietary adjustments.
How to Analyze Data in Geriatric Nutrition & Dietary Care Dashboards
Here is how you can analyze data in this dashboard for nutrition management for elderly care centers
- Evaluate Nutrient Intake Trends: Use line and column charts to monitor daily calorie and protein levels, comparing them with target benchmarks.
- Correlate BMI and Screening Scores: Track whether improvements in BMI align with reduced malnutrition scores over time.
- Assess Ward-Level Performance: Analyze meal consumption rates across wards to identify areas of low intake or waste.
- Track Dietary Compliance: Use heatmaps and donut charts to measure adherence to prescribed energy, protein, and therapeutic diet standards.
- Monitor Cost and Efficiency: Review waterfall and bar charts to evaluate food cost per resident, waste levels, and service efficiency.
- Link Patient Satisfaction: Compare satisfaction trends with operational performance to improve meal quality and enhance the overall patient experience.
Benefits of Geriatric Nutrition & Dietary Care Dashboards
- Improved Nutritional Monitoring: Enables real-time tracking of dietary intake, BMI, and malnutrition scores for each resident.
- Personalized Care Planning: Supports customized meal plans based on nutritional risk assessments and clinical conditions.
- Enhanced Dietary Compliance: Ensures therapeutic diets meet prescribed nutrient and energy targets.
- Operational Efficiency: Reduces food waste and improves service workflow through process analytics.
- Better Patient Satisfaction: Monitors feedback and adjusts menus to align with resident preferences and needs.
- Data-Driven Decision Making: Empowers healthcare professionals with visualized insights for continuous improvement.
KPIs to Track in Geriatric Nutrition & Dietary Care Dashboards
You can track the following elderly patient nutrition and wellness metrics:
- Average Malnutrition Screening Score – Measures nutritional risk and identifies residents needing dietary interventions.
- Average BMI (kg/m²) – Tracks weight trends to evaluate nutritional health status.
- Daily Energy Intake (kcal per resident) – Monitors caloric adequacy based on dietary guidelines.
- Daily Protein Intake (g per resident) – Ensures sufficient protein for muscle maintenance and recovery.
- Meal Consumption Rate (% of Served Meals Eaten) – Reflects acceptance and consumption of provided meals.
- Dehydration Risk Screening Completion Rate (%) – Monitors hydration screening compliance.
- Therapeutic Diet Delivery Accuracy (%) – Evaluates precision in delivering prescribed diet plans.
Frequently Asked Questions
1. What is the purpose of a Geriatric Nutrition & Dietary Care Dashboard?
It helps healthcare teams track elderly nutrition metrics, assess dietary compliance, and identify malnutrition risks to improve patient outcomes.
2. How does the dashboard support elderly care centers?
It consolidates meal intake, cost, and satisfaction data, enabling administrators to optimize nutrition programs and reduce waste.
3. Who uses this dashboard in healthcare facilities?
Dieticians, nursing staff, food service managers, and clinical administrators use it to monitor and enhance elderly dietary care.
4. What are the main performance areas tracked?
Energy intake, protein adequacy, therapeutic diet delivery, patient satisfaction, and operational efficiency.