
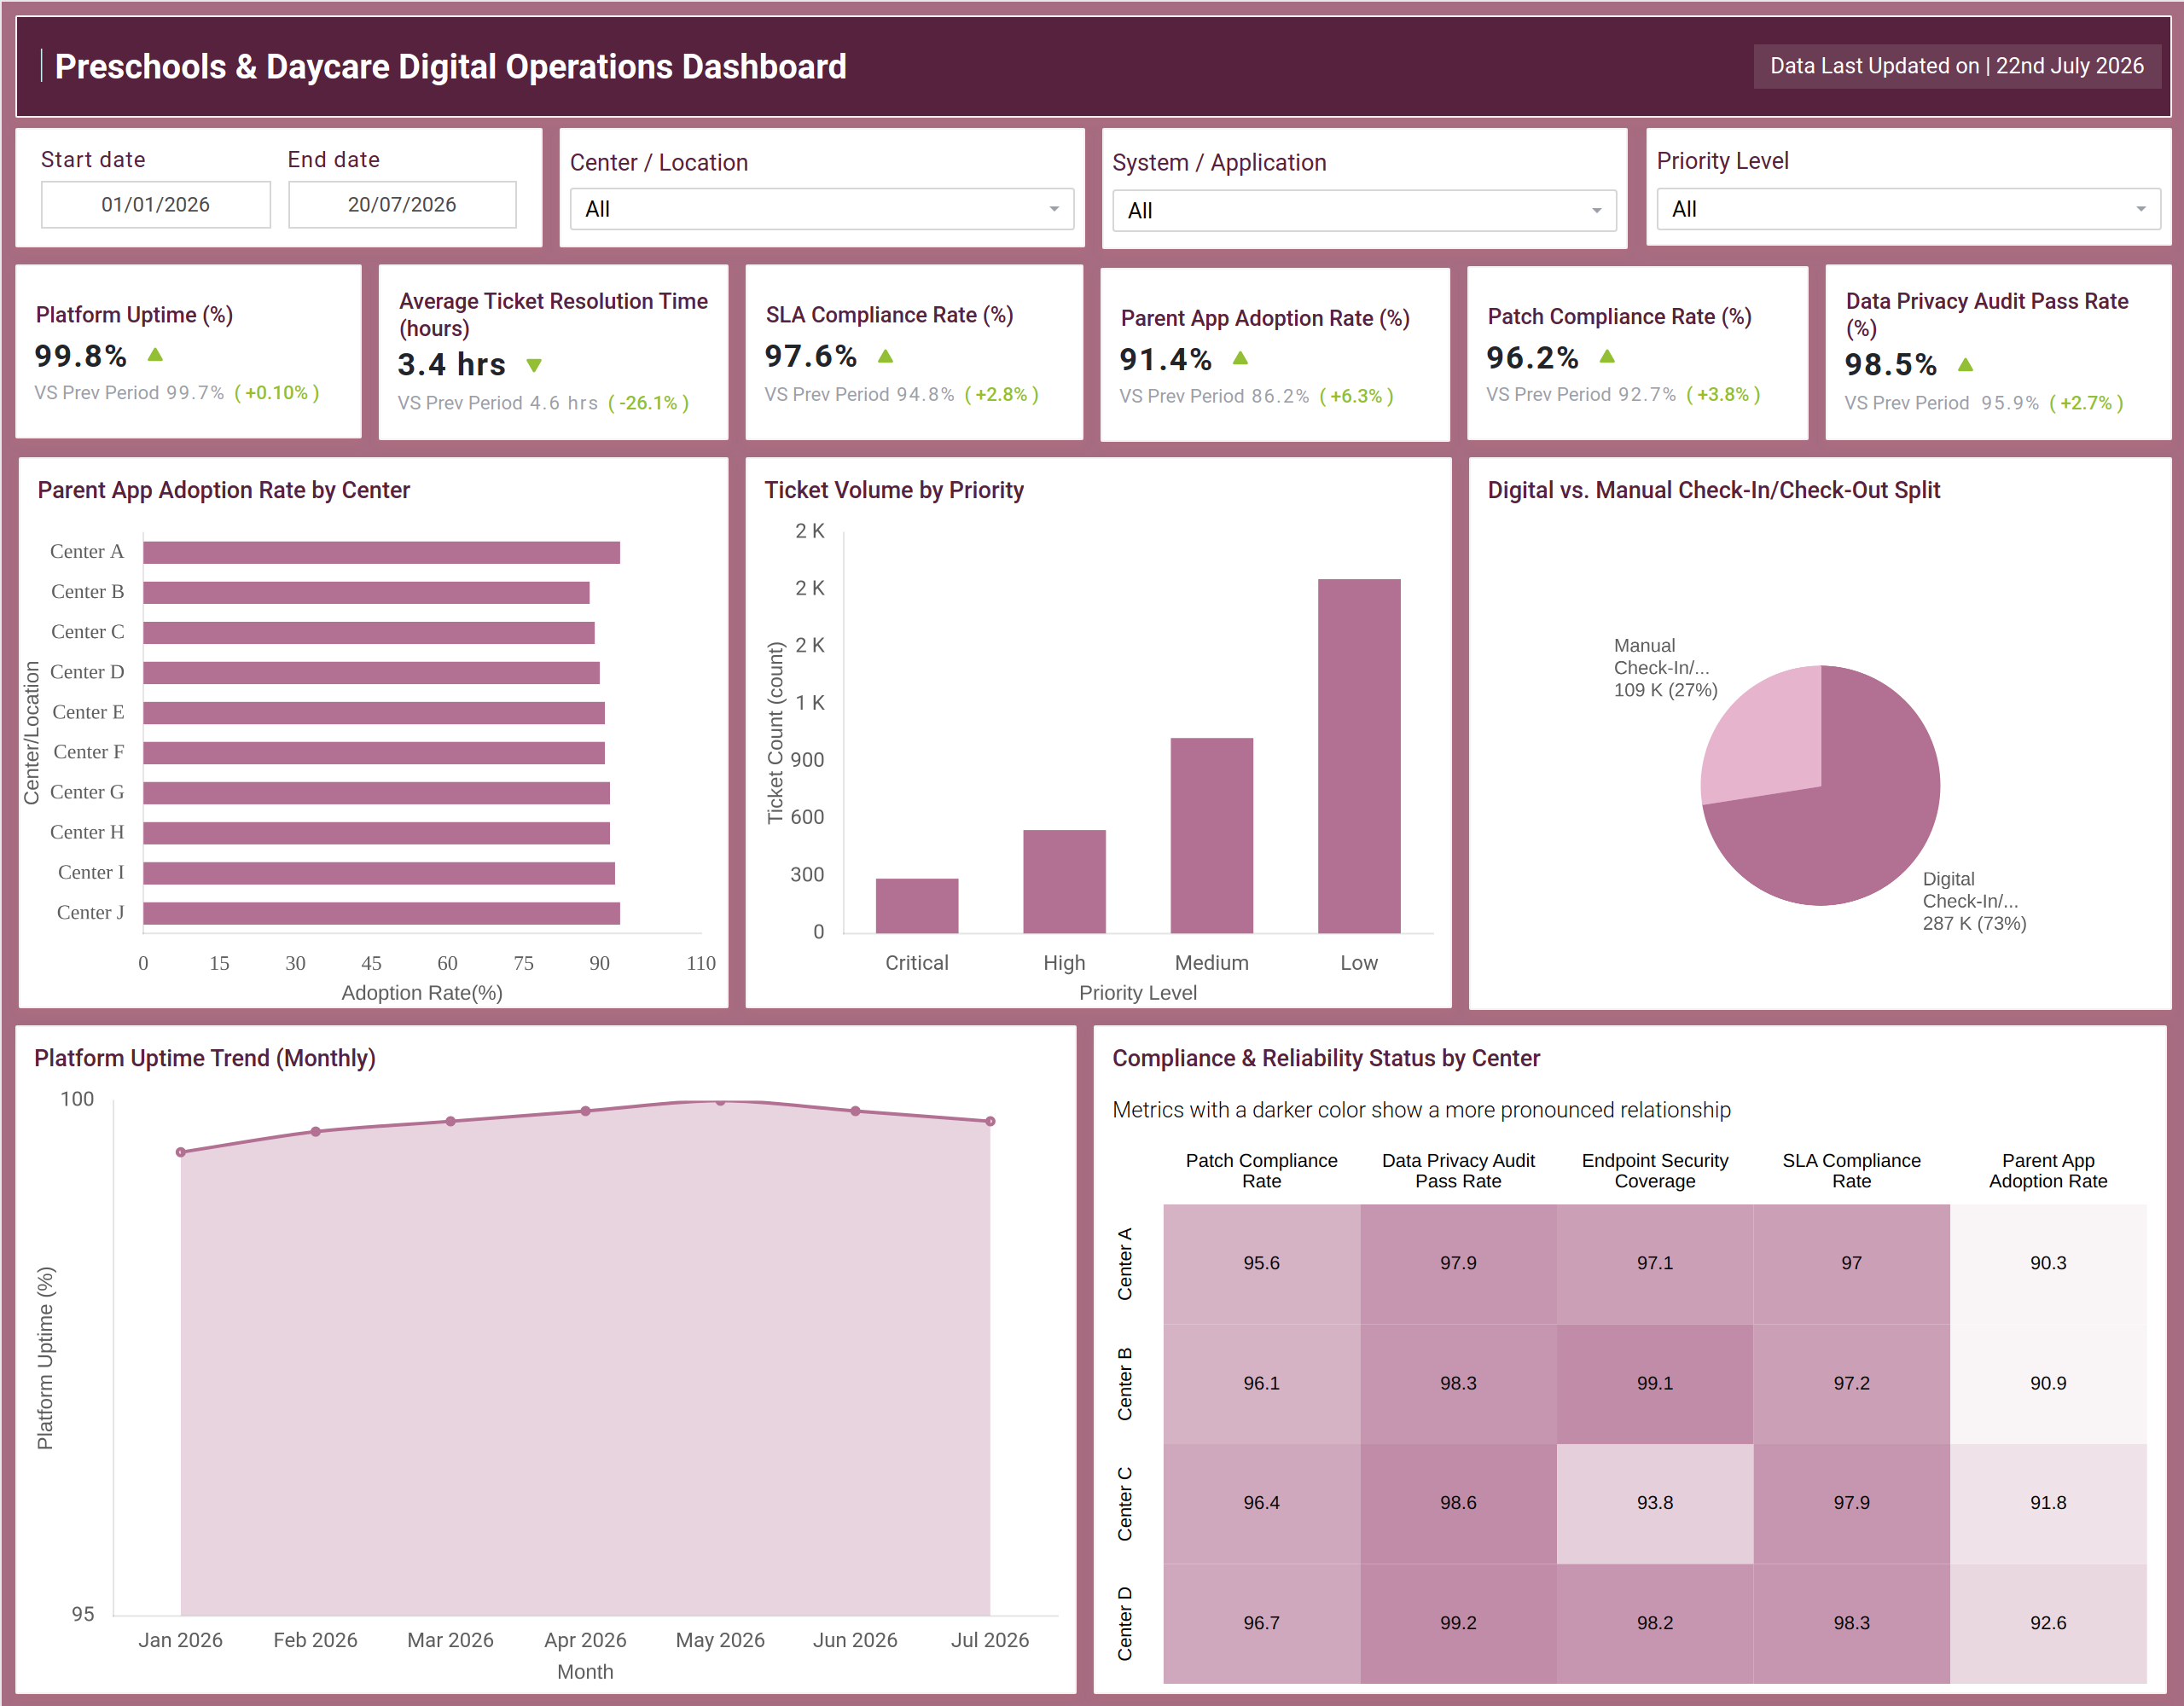
What is a Preschools & Daycare Digital Operations Dashboard
The Preschools & Daycare Digital Operations Dashboard gives childcare network leaders and IT administrators a single view of the technology systems that keep preschools and daycare centers running day to day. Instead of pulling separate reports from helpdesk systems, parent communication apps, and security tools, this preschool digital operations dashboard consolidates platform stability, support ticket activity, parent engagement, and compliance posture into one workspace.
Filters for date range, center or location, system or application, and priority level let administrators narrow the view to a single site or a specific technology stack, making it easier to compare performance across a multi-center network. Built for education technology teams and operations directors, the dashboard turns fragmented system logs into a structured view that supports faster decisions about where attention, staffing, or vendor escalation is needed. Whether the goal is to confirm platform stability with franchise partners or to prepare for a compliance review, this IT ticket resolution time dashboard for preschools brings the underlying data together in one place.
How to Create a Preschools & Daycare Digital Operations Dashboard
You don't need to build your report from scratch; just start with a ready-to-use dashboard template from Mokkup. Add in your data and export it however you like. Here's how to do it:
1. Create or Log in to Your Mokkup Account
Start by signing up on Mokkup.ai using your email. If you already have an account, just log in, and you'll be good to go.
2. Choose and Customize Your Dashboard Template
Find the Preschools & Daycare Digital Operations Dashboard template in the Templates section. Use the drag-and-drop editor to adjust KPIs, edit filters, or add elements based on your data.
3. Export to Your BI Tool
Once your dashboard wireframe is ready, use the BI Tool Export feature to send it directly to Power BI or Tableau for further analysis and enhancements. You can also download the dashboard as a PDF, PNG, or JPEG, embed it on a platform, or invite your team to collaborate.
Note: This is a Pro template. You'll need a Pro subscription on Mokkup to use and customize this dashboard wireframe. Upgrade anytime to unlock full access.
Preschools & Daycare Digital Operations Dashboard Example
An operations director at a multi-center preschool network opens this dashboard each morning to check whether overnight system updates went smoothly and whether any center is reporting elevated support requests. Rather than waiting on a status email from IT, they scan trends across every location before the first parent question of the day arrives. The dashboard becomes the shared reference point for anyone accountable for keeping enrollment systems, check-in kiosks, and parent apps running without disruption. From here, the team can identify which centers are lagging on parent engagement and prioritize onboarding support where usage is falling behind peer locations, using the dashboard as a parent app adoption rate tracking tool for the whole network.
Comparing ticket volume by priority level helps IT leads decide whether critical and high-priority issues are being resolved fast enough, or whether staffing needs to shift toward a specific system or application. Reviewing the split between digital and manual check-in and check-out also indicates where paper-based processes still create friction and where additional device rollouts accelerate the shift to digital records. Looking across the compliance and reliability view by center, managers can flag any location where patch compliance or audit performance is falling behind the network average before it becomes a bigger risk.
Together, this approach to daycare center platform uptime monitoring helps operations and IT teams move from reactive troubleshooting to proactive oversight, spotting weak points early, holding vendors and center staff accountable to consistent standards, and giving leadership confidence that every location meets the same bar for security, stability, and parent experience.
How to Analyze Data in a Preschools & Daycare Digital Operations Dashboard
Here is how you can analyze data from this dashboard:
- Analyze location-specific performance: Filter by center, location, and date range to evaluate performance for a specific site or reporting period.
- Track parent app adoption: Compare adoption rates across centers to identify locations that need additional onboarding support.
- Monitor support priorities: Review ticket volume by priority level to ensure critical and high-priority issues are resolved promptly.
- Measure digital adoption: Compare digital and manual check-in/check-out activity to track progress toward full digital adoption.
- Monitor platform reliability: Track the monthly platform uptime trend to ensure system stability over time.
- Evaluate compliance metrics: Use the compliance and reliability heatmap to compare patch compliance, data privacy audits, endpoint security, SLA compliance, and parent app adoption across centers.
- Focus on specific systems: Filter by system or application to analyze the performance of an individual software platform.
- Track support efficiency: Monitor average ticket resolution time to evaluate preschool IT support team performance.
Benefits of a Preschools & Daycare Digital Operations Dashboard
The following are the benefits of using this dashboard:
- Centralize digital operations: Combine platform uptime, support tickets, and compliance metrics for every center in a single dashboard.
- Reduce reporting effort: Eliminate manual reporting by consolidating data from helpdesk systems and app analytics tools.
- Monitor SLA performance: Track resolution trends to identify SLA compliance issues before service levels decline.
- Standardize technology reporting: Provide a consistent view of technology performance across all locations with a shared preschool digital operations dashboard.
- Improve digital adoption: Identify centers that are falling behind on parent app adoption or digital check-in implementation.
- Strengthen audit readiness: Monitor data privacy audit metrics to support compliance across daycare systems.
- Enable better decision-making: Give leadership a shared, filterable view of operational performance instead of relying on disconnected system reports.
KPIs to Track in a Preschools & Daycare Digital Operations Dashboard
The following key KPIs can be tracked by using this dashboard:
- Platform Uptime (%) - measures the percentage of time core systems remain available and accessible to staff and families.
- Average Ticket Resolution Time (hours) - tracks how quickly IT support closes reported issues after they are logged.
- SLA Compliance Rate (%) - shows the share of support tickets resolved within agreed service level timeframes, a key input for SLA compliance monitoring for childcare centers.
- Parent App Adoption Rate (%) - measures how many families are actively using the parent communication and check-in app relative to total enrollment.
- Patch Compliance Rate (%) - tracks the percentage of devices and systems updated with required security patches.
- Data Privacy Audit Pass Rate (%) - a core metric for data privacy audit tracking for daycare systems, showing the share of privacy audits passed without major findings.
Frequently Asked Questions
1. What is a Preschools & Daycare Digital Operations Dashboard used for?
It is used to monitor platform uptime, ticket resolution, parent app adoption, and compliance metrics across every preschool or daycare center in one place. It replaces manual reporting with a single filterable view for operations and IT teams.
2. Which teams benefit most from this dashboard?
Operations directors, IT administrators, and compliance officers overseeing multi-center preschool or daycare networks benefit most. Center managers also use it to see how their location compares to network benchmarks.
3. Can this dashboard template be customized for our own centers and systems?
Yes. The template can be customized in Mokkup with your own center names, systems, and KPIs, then exported to Power BI or Tableau, or downloaded directly as a file.