
What is a Preschools & Daycare Centers Child Development & Learning Dashboard?
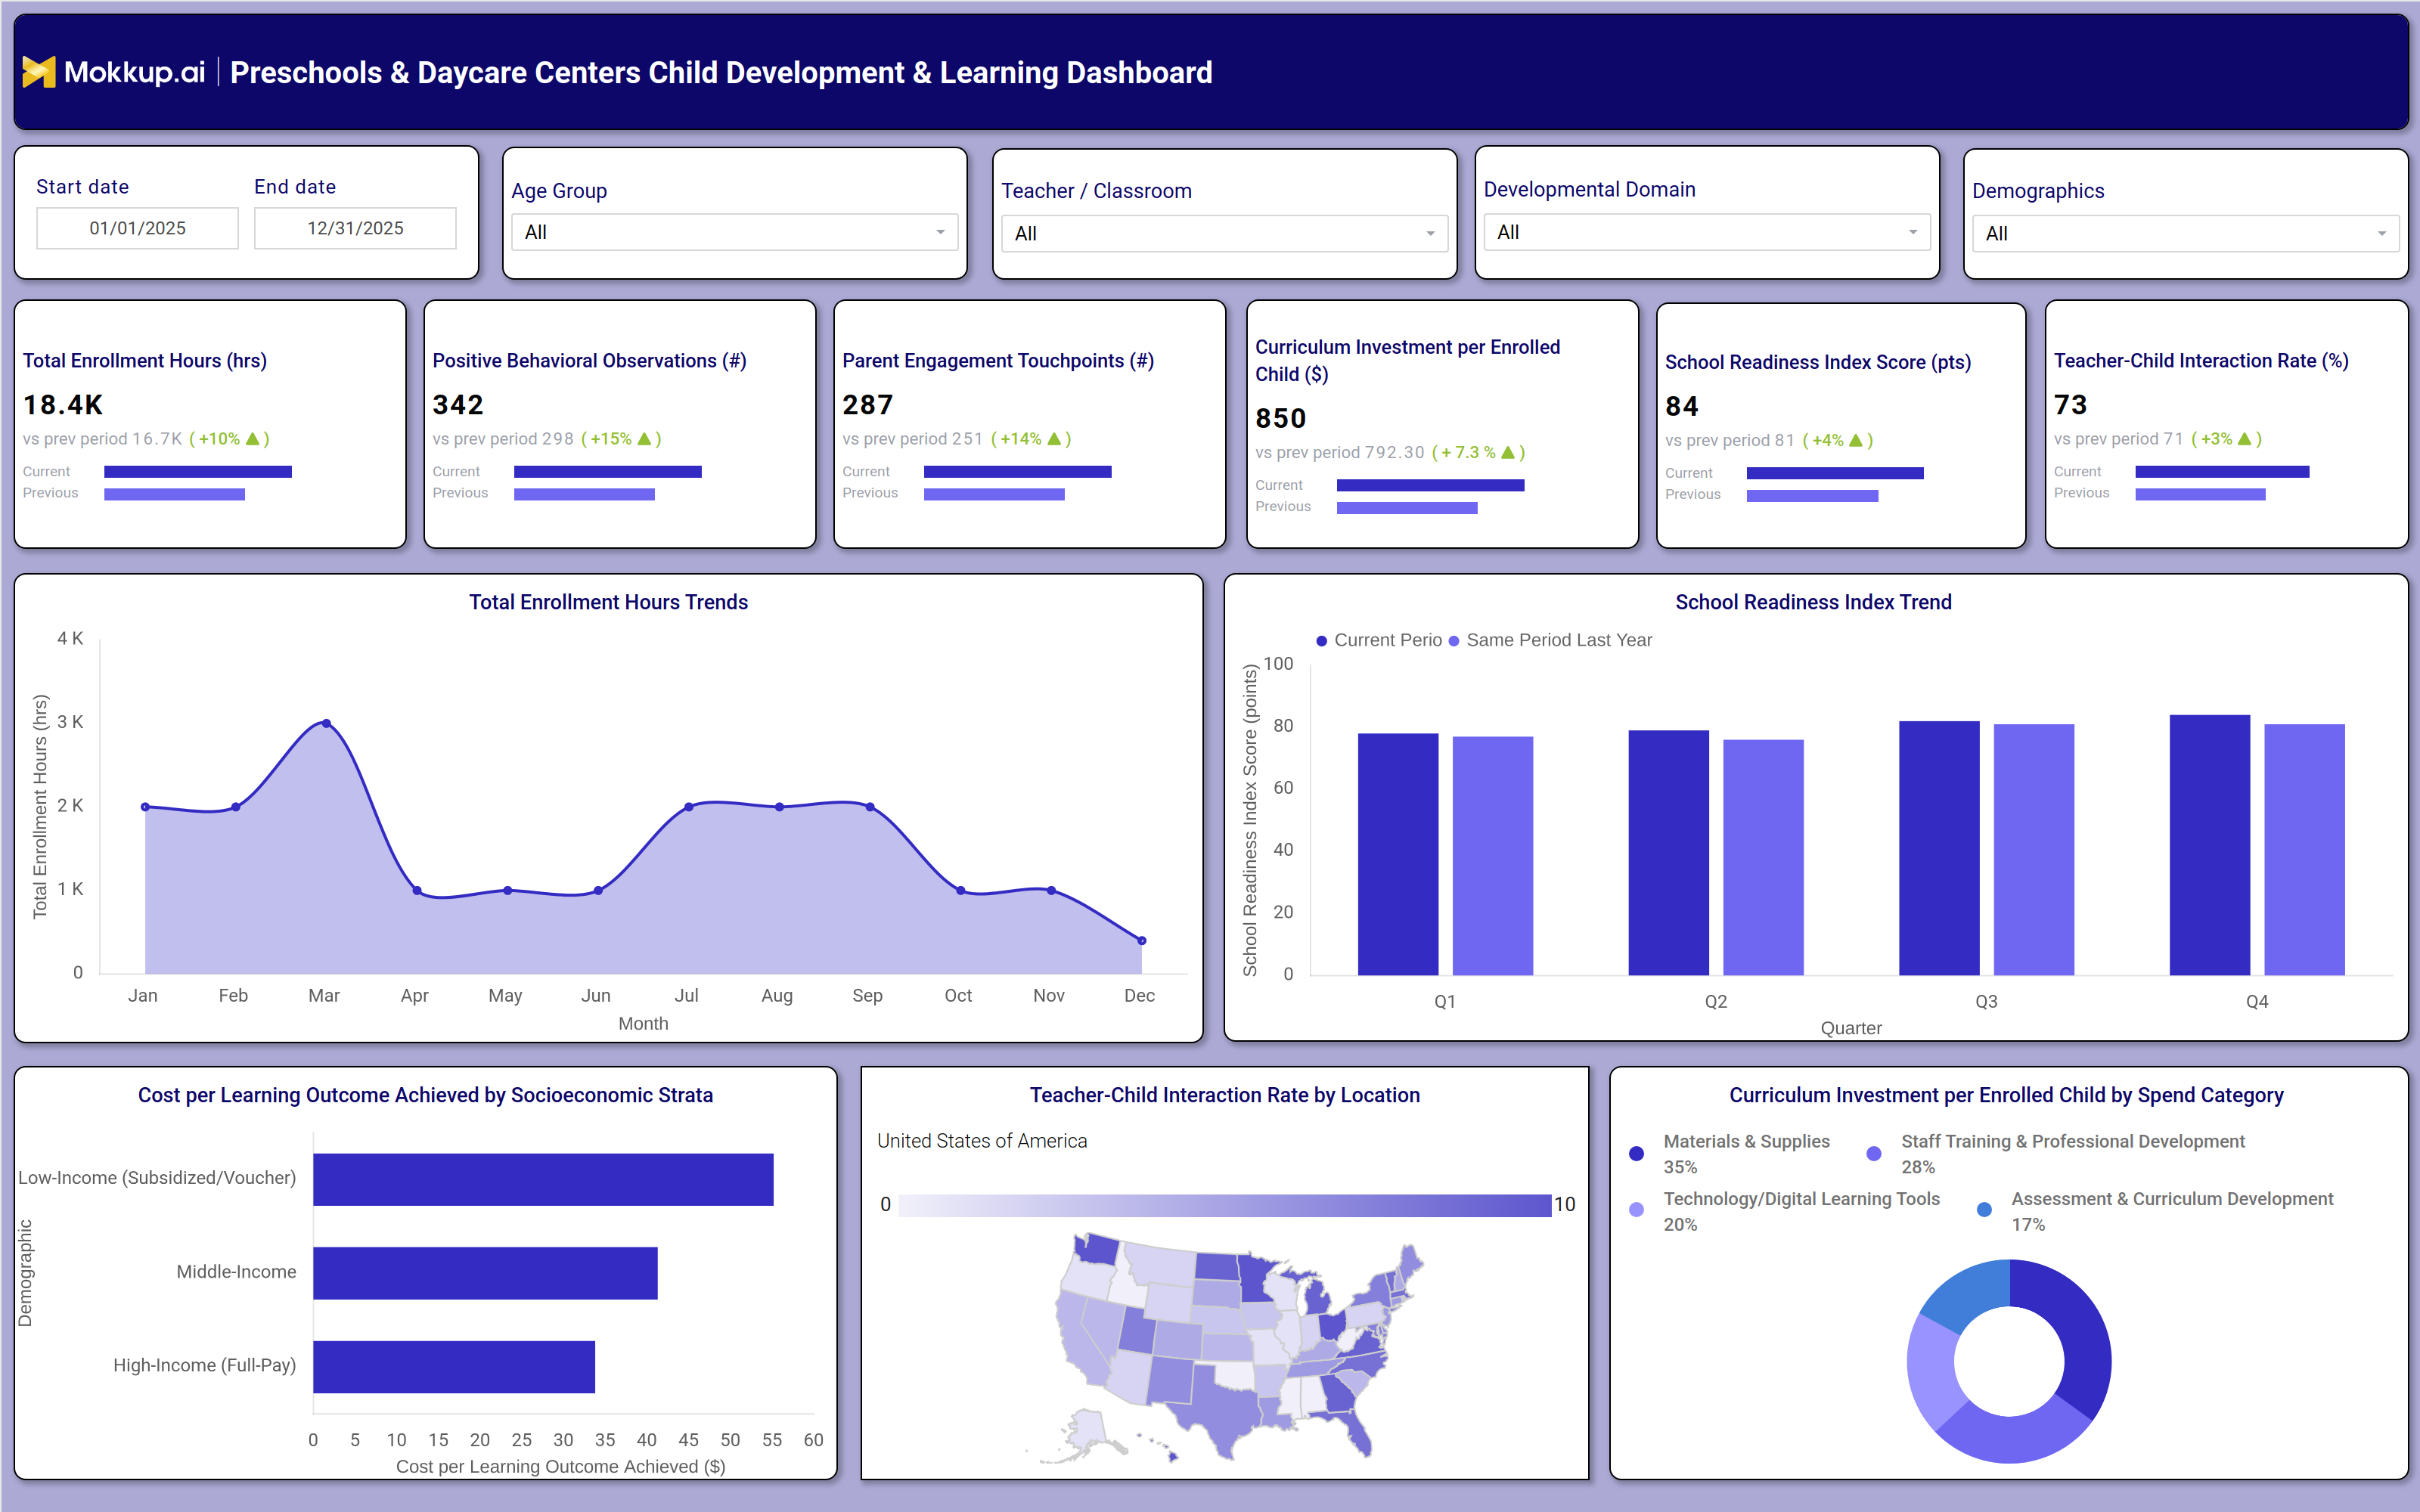
The Preschools & Daycare Centers Child Development & Learning Dashboard gives childcare administrators and program directors a single view of how enrolled children are progressing across developmental domains, how teachers are engaging with classrooms, and how program spending translates into learning outcomes. Built for center directors, curriculum coordinators, and network administrators, this preschool and daycare child development dashboard consolidates enrollment activity, behavioral progress, parent engagement records, and curriculum spend into one workspace so leadership does not need to reconcile separate attendance logs, teacher observation notes, and budget spreadsheets. Filters for date range, age group, teacher or classroom, developmental domain, and demographics let users narrow the view to a specific cohort, a single classroom, or a defined reporting period, making it straightforward to compare how different age groups or socioeconomic segments are progressing. Whether the goal is preparing for a board review, evaluating a curriculum change, or confirming that spend is producing stronger developmental results, this dashboard template gives childcare teams the structure to move from raw activity logs to decisions grounded in evidence.
How to Create a Preschools & Daycare Centers Child Development & Learning Dashboard
You don’t need to build your report from scratch; just start with a ready-to-use dashboard template from Mokkup. Add in your data and export it however you like. Here’s how to do it:
1. Create or Log in to Your Mokkup Account
Start by signing up on Mokkup.ai using your email. If you already have an account, just log in, and you'll be good to go.
2. Choose and Customize Your Dashboard Template
Find the Preschools & Daycare Centers Child Development & Learning Dashboard template in the Templates section. Use the drag-and-drop editor to adjust KPIs, edit filters, or add elements based on your data.
3. Export to Your BI Tool
Once your dashboard wireframe is ready, use the BI Tool Export feature to send it directly to Power BI or Tableau for further analysis and enhancements. You can also download the dashboard as a PDF, PNG, or JPEG, embed it on a platform, or invite your team to collaborate.
Note: This is a Pro template. You'll need a Pro subscription on Mokkup to use and customize this dashboard wireframe. Upgrade anytime to unlock full access.
Preschools & Daycare Centers Child Development & Learning Dashboard Example
A center director or curriculum coordinator typically opens this preschool and daycare child development dashboard before a parent conference, board meeting, or licensing review, wanting to know whether enrollment hours, teacher engagement, and behavioral progress are moving in the right direction, and whether any classroom or age group needs closer attention. From the top of the workspace, directors compare current enrollment hours and teacher-child interaction levels against the prior period to see whether classroom engagement is improving, and filter by teacher or classroom to isolate where extra coaching or staffing support is needed. Program leads also judge whether children are entering the next developmental stage ready, flagging any quarter where progress flattened compared to the same period last year.
Further down the dashboard, finance and program leads compare cost efficiency of learning outcomes across low-income, middle-income, and high-income segments to check whether subsidized programs deliver results proportional to their funding, and review how curriculum spend is distributed across materials, staff training, technology, and assessment to guide next year's budget. The location view of teacher-child interaction rates lets multi-site operators spot which regions are engaging children most closely and which sites need additional staffing. Together, these views let childcare leadership move past anecdote and toward a documented, comparable picture of child development outcomes across classrooms, sites, and income segments, so budget, staffing, and curriculum decisions are backed by evidence rather than guesswork.
How to Analyze Data in Preschools & Daycare Centers Child Development & Learning Dashboard
Here is how you can analyze data from this dashboard:
- Filter by age group and developmental domain to compare progress across specific child cohorts.
- Apply the teacher/classroom filter to run teacher-child interaction rate monitoring at the individual classroom level.
- Compare current vs previous period enrollment hours to spot enrollment or engagement shifts early.
- Segment cost per learning outcome by socioeconomic strata to check equity of program results.
- Review the quarterly readiness trend against the same period last year to catch developmental slowdowns.
- Break down curriculum investment by spend category to identify budget reallocation opportunities.
- Use the location view to compare teacher-child interaction rates across sites or regions.
Benefits of a Preschools & Daycare Centers Child Development & Learning Dashboard
The following are the benefits of using this dashboard:
- Replaces scattered attendance, observation, and budget spreadsheets with one workspace.
- Surfaces curriculum investment per enrolled child tracking so spend decisions tie directly to learning outcomes.
- Highlights cost per learning outcome by socioeconomic strata to support equitable program funding decisions.
- Gives directors a parent engagement touchpoints tracking dashboard view to prepare for family conferences and board updates.
- Strengthens school readiness index tracking dashboard use during licensing renewals and family enrollment conversations.
- Supports faster licensing and board reporting with filterable, cohort-level data.
- Reduces manual reconciliation between teacher logs, enrollment records, and finance data.
KPIs to Track in a Preschools & Daycare Centers Child Development & Learning Dashboard
The following key KPIs can be tracked by using this dashboard:
- Total Enrollment Hours: total hours children are enrolled and present across the reporting period.
- Positive Behavioral Observations: count of documented positive behavior moments recorded by teaching staff.
- Parent Engagement Touchpoints: number of recorded interactions between staff and families, feeding the parent engagement touchpoints tracking dashboard view used for family reporting.
- Curriculum Investment per Enrolled Child: average spend per child on curriculum-related resources, part of the curriculum investment per enrolled child tracking used for budget planning.
- School Readiness Index Score: composite score indicating how prepared children are for the next developmental stage, central to the school readiness index tracking dashboard view.
- Teacher-Child Interaction Rate: percentage measure of teacher engagement with children, the core metric behind teacher-child interaction rate monitoring across classrooms.
- Cost per Learning Outcome : compares total curriculum spend against developmental milestones achieved, segmented by socioeconomic strata.
Frequently Asked Questions
1. What data does the Preschools & Daycare Centers Child Development & Learning Dashboard track?
It tracks enrollment hours, behavioral observations, parent engagement, curriculum spend, school readiness scores, and teacher-child interaction rates across classrooms and sites. Filters let directors narrow this data to a specific age group, teacher, developmental domain, or demographic segment.
2. Who typically uses this dashboard?
Center directors, curriculum coordinators, and multi-site network administrators use it to review classroom performance, plan budgets, and prepare for board or licensing reviews. Finance teams also use it to check whether curriculum spend is producing proportional learning outcomes.
3. Can this dashboard be customized for a specific center or network?
Yes. The Mokkup template can be edited to match your filters, KPI tiles, and chart layout, then exported to Power BI, Tableau, PDF, or image formats for reporting.