What is a Power Transmission Market Interface Performance Dashboard?
A Power Transmission Market Interface Performance Dashboard is an analytics solution designed to monitor how transmission utilities interact with electricity markets across scheduling, settlements, deviations, and tariff recovery. It provides a centralized view of market-facing performance for transmission system operators handling day-ahead, real-time, and ancillary market interfaces. This dashboard functions as a power transmission market interface dashboard by consolidating market exposure, settlement accuracy, deviation cost impacts, and issue resolution metrics into a single operational view.
It enables transmission utilities to evaluate the effectiveness of their market coordination processes while maintaining regulatory and financial discipline. By supporting continuous power grid market interface monitoring, the dashboard helps utilities track market risks, identify recurring settlement issues, and ensure accurate recovery of approved tariffs across market segments.
How to Power Transmission Market Interface Performance Dashboard
You don’t need to build your report from scratch, just start with a ready-to-use dashboard template from Mokkup. Add in your data and export it however you like. Here’s how to do it:
1. Create or Log in to Your Mokkup Account
Start by signing up on Mokkup.ai using your email. If you already have an account, just log in, and you’ll be good to go.
2. Choose and Customize Your Dashboard Template
Find the Power Transmission Market Interface Performance Dashboard template in the Templates section. Use the drag-and-drop editor to adjust KPIs, edit filters, or add elements based on your data.
3. Export to Your BI Tool
Once your dashboard wireframe is ready, use the BI Tool Export feature to send it directly to Power BI or Tableau for further analysis and enhancements. You can also download the dashboard as a PDF, PNG, or JPEG, embed it on a platform, or invite your team to collaborate.
Note: This is a Pro template. You’ll need a Pro subscription on Mokkup to use and customize this dashboard wireframe. Upgrade anytime to unlock full access.
Power Transmission Market Interface Performance Dashboard Example
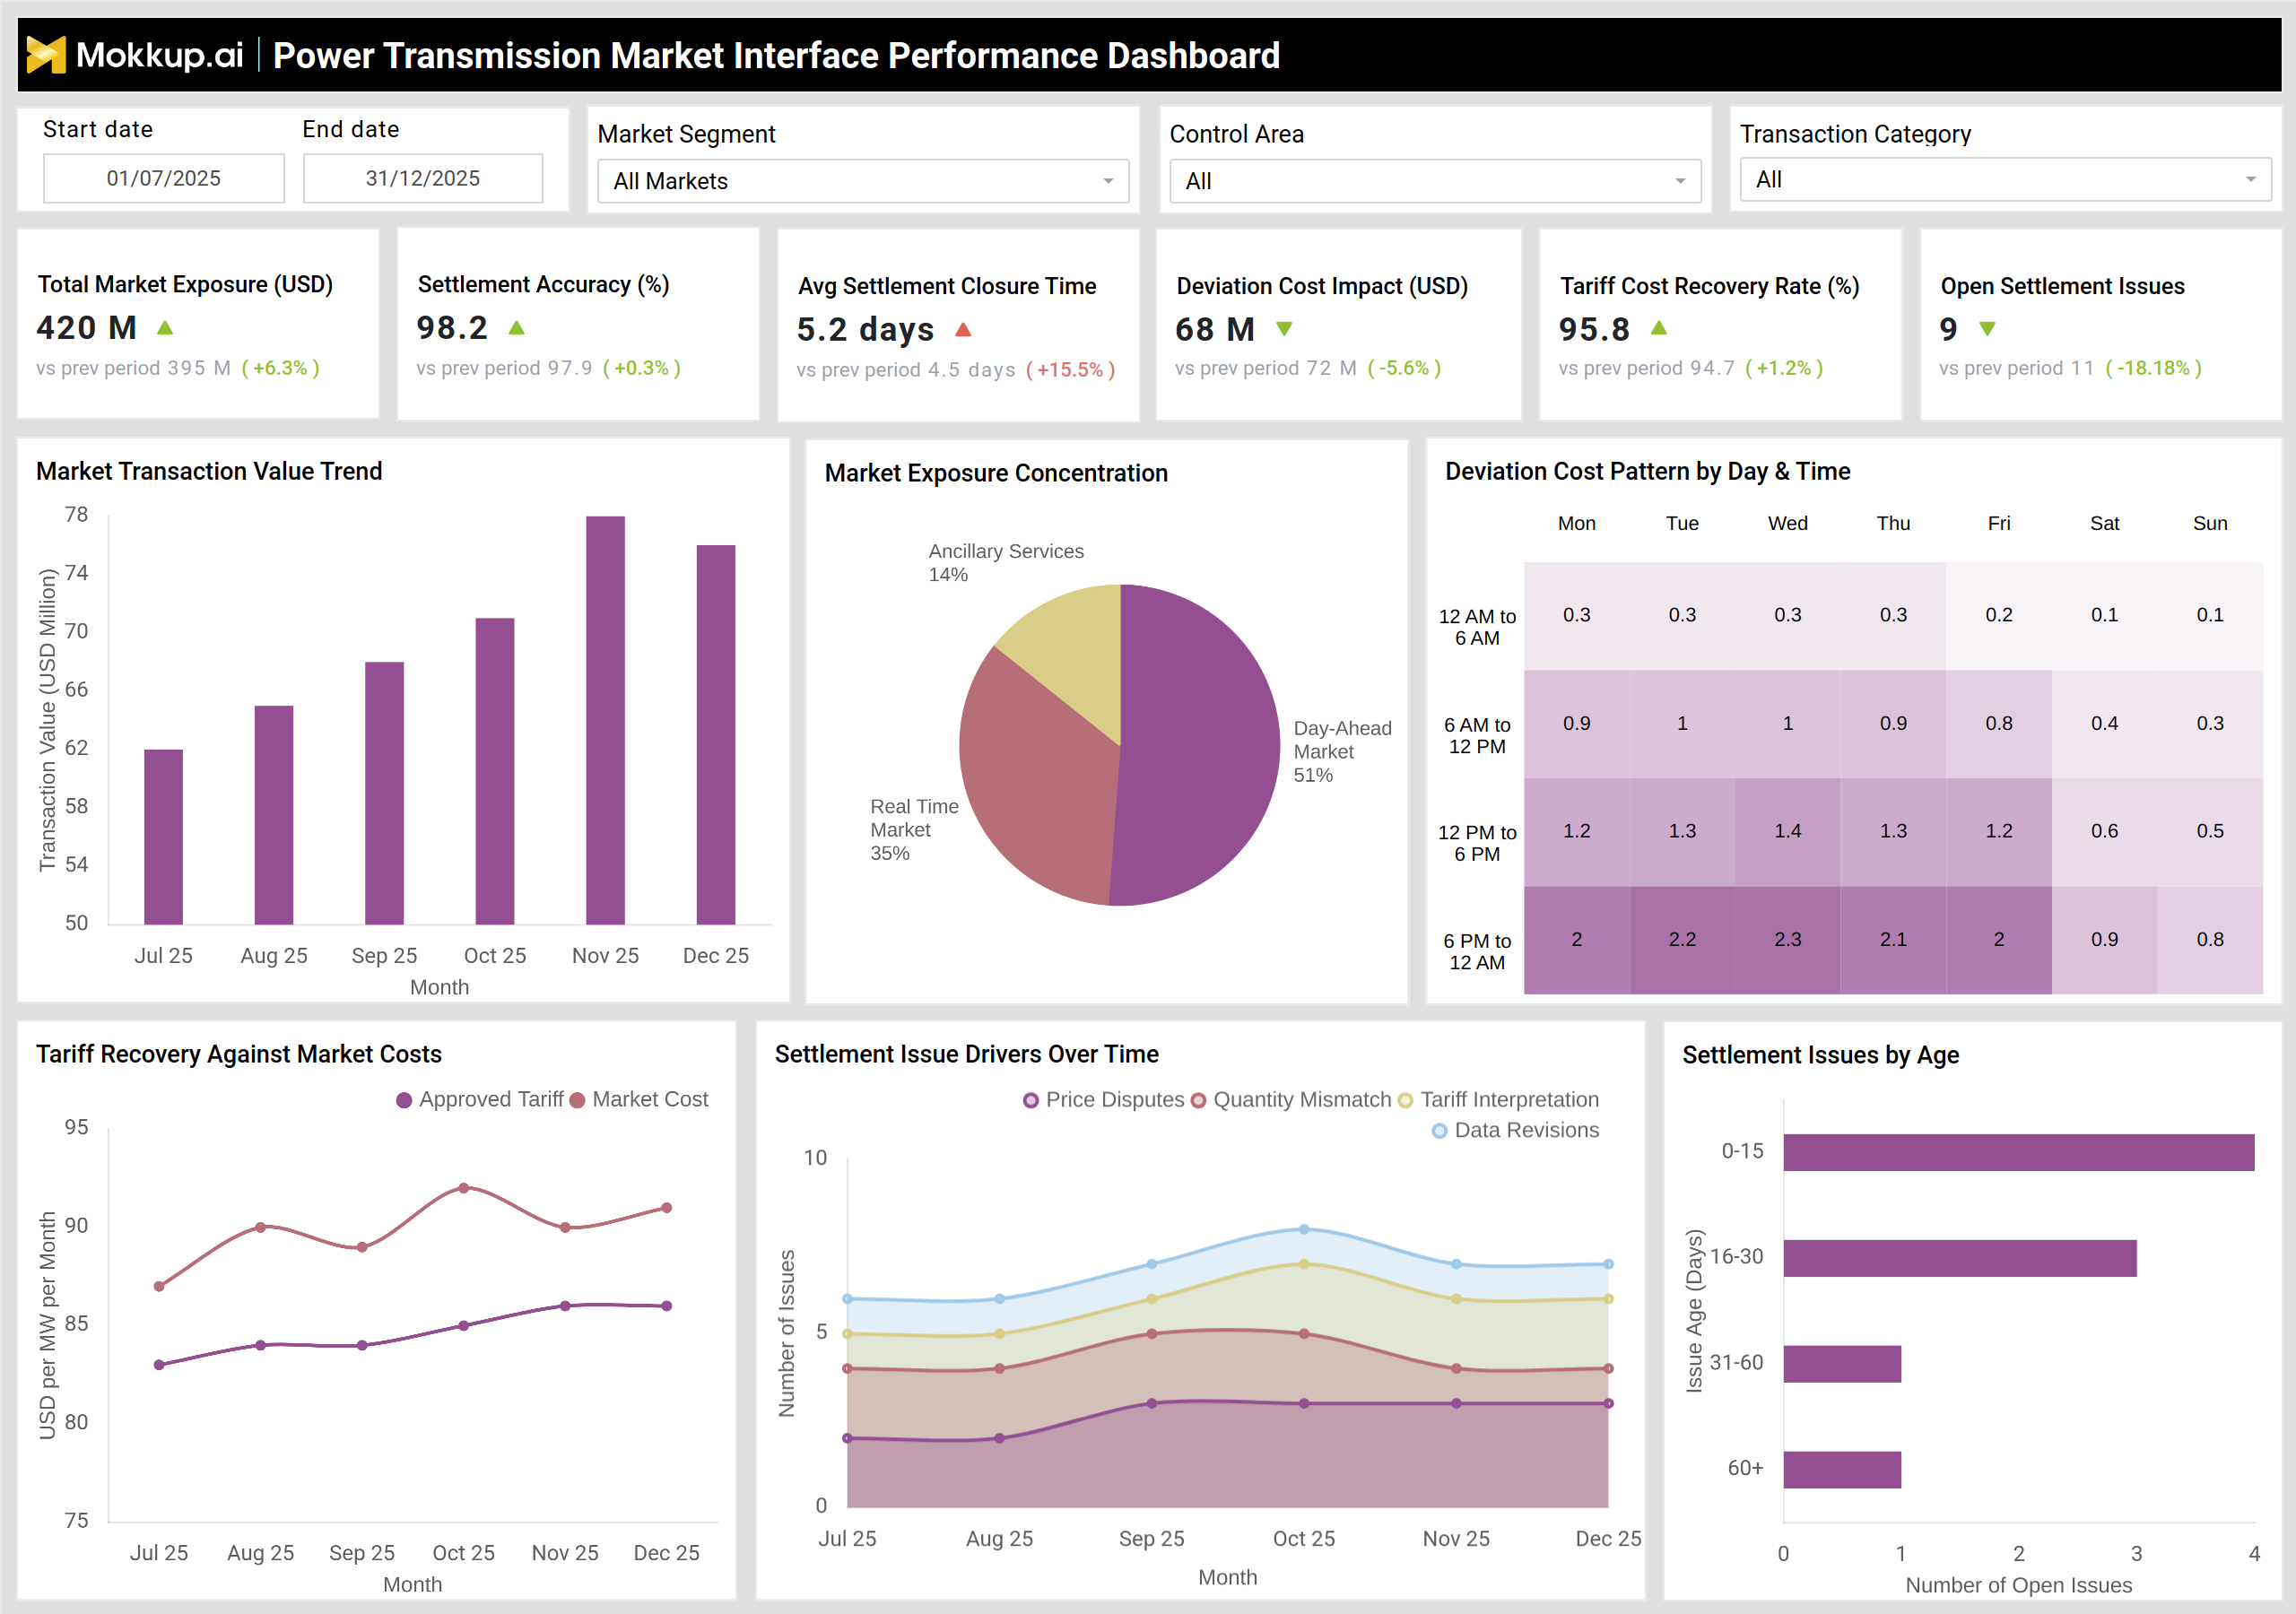
A typical Power Transmission Market Interface Performance Dashboard displays total market exposure, settlement accuracy, average settlement closure time, deviation cost impact, tariff cost recovery rate, and open settlement issues. These KPIs provide executives with an immediate understanding of market-facing financial and operational health. Visuals such as market transaction value trends show how exposure evolves across months, while market exposure concentration charts highlight dependency on day-ahead, real-time, or ancillary services markets.
Heatmaps for deviation cost patterns reveal high-risk time blocks by day and hour, supporting targeted corrective actions. Settlement issue drivers and aging views further strengthen transmission market interface performance analytics by exposing root causes such as price disputes, quantity mismatches, tariff interpretation gaps, and data revisions.
How to Analyze Data in Power Transmission Market Interface Performance Dashboard
Here is how you can analyze data from this dashboard:
- Review total market exposure trends to understand overall financial exposure to electricity markets.
- Track settlement accuracy (%) to ensure billing and reconciliation processes align with market outcomes.
- Monitor average settlement closure time to identify delays in financial finalization.
- Analyze deviation cost impact by day and time to detect recurring operational or scheduling gaps.
- Study market exposure concentration to assess reliance on specific market segments.
- Compare approved tariffs vs market costs to validate tariff cost recovery effectiveness.
- Examine settlement issue drivers to identify systemic pricing, quantity, or data-related problems.
- Use settlement issue aging to prioritize resolution of long-pending disputes.
- Correlate market transaction value trends with deviation and settlement metrics.
Benefits of Power Transmission Market Interface Performance Dashboard
The following are the benefits of using this dashboard:
- Improves transparency across transmission utility market operations dashboard workflows.
- Reduces financial risk through early identification of deviation cost drivers.
- Enhances settlement discipline by tracking accuracy and closure timelines.
- Strengthens regulatory compliance through structured tariff recovery monitoring.
- Enables proactive electricity transmission market performance tracking.
- Improves coordination between market operations, finance, and regulatory teams.
- Supports data-driven decisions for power transmission scheduling interface analytics.
- Reduces unresolved settlement issues and dispute backlogs.
KPIs to Track in Power Transmission Market Interface Performance Dashboard
The following key KPIs can be tracked by using this dashboard:
- Total Market Exposure (USD): Measures the total financial exposure of the transmission utility across electricity markets.
- Settlement Accuracy (%): Tracks the accuracy of market settlements against approved schedules and transactions.
- Average Settlement Closure Time (days): Indicates how long it takes to close and finalize settlements.
- Deviation Cost Impact (USD): Measures the financial impact of deviations from scheduled transmission operations.
- Tariff Cost Recovery Rate (%): Tracks the percentage of approved tariff costs successfully recovered.
- Open Settlement Issues (count): Shows the number of unresolved settlement-related issues.
- Market Transaction Value (USD): Tracks the total value of transactions processed through market interfaces.
- Market Exposure Concentration (%): Measures exposure distribution across day-ahead, real-time, and ancillary markets.
- Deviation Cost by Time Block (USD): Identifies high-cost deviation periods by day and hour.
- Settlement Issue Drivers (count): Tracks settlement issues by root cause such as pricing, quantity mismatch, or data revisions.
- Settlement Issue Aging (days): Monitors how long settlement issues remain unresolved.
Frequently Asked Questions
1. What is the primary purpose of a Power Transmission Market Interface Performance Dashboard?
It helps transmission utilities monitor market exposure, settlement accuracy, deviation costs, and tariff recovery across electricity markets.
2. Who uses this dashboard within a transmission organization?
Market operations teams, finance departments, regulatory teams, and executive leadership use this dashboard.
3. How does this dashboard support regulatory compliance?
It tracks settlement accuracy, tariff recovery rates, and unresolved issues that are critical for audits and regulatory reporting.