
What is a Power Transmission CSR & Public Interface Oversight Dashboard?
A Power Transmission CSR & Public Interface Oversight Dashboard template is an analytics solution used by transmission system operators (TSOs) to monitor CSR program execution and manage public-facing service accountability. It provides visibility into CSR project portfolio status, beneficiary reach, spend utilization, and partnerships while also tracking external public issues, media perception, and stakeholder engagement activities. This dashboard wireframe functions as a power transmission CSR oversight dashboard by combining CSR delivery performance with public interface oversight indicators. It supports leadership teams in ensuring CSR commitments are executed on time, aligned with community priorities, and backed by transparent reporting.
It also acts as a power grid public interface dashboard, enabling utilities to measure community interactions, grievance volumes, external queries, and unresolved public issues. With integrated performance and accountability views, the dashboard becomes a practical transmission CSR compliance monitoring tool and a power transmission stakeholder reporting dashboard for regulators, investors, and community stakeholders.
How to Create a Power Transmission CSR & Public Interface Oversight Dashboard
You don’t need to build your report from scratch, just start with a ready-to-use Power Transmission CSR & Public Interface Oversight dashboard template from Mokkup. Add in your data and export it however you like. Here’s how to do it:
1. Create or Log in to Your Mokkup Account
Start by signing up on Mokkup.ai using your email. If you already have an account, just log in, and you’ll be good to go.
2. Choose and Customize Your Dashboard Template
Find the Power Transmission CSR & Public Interface Oversight Dashboard template in the Templates section. Use the drag-and-drop editor to adjust KPIs, edit filters, or add elements based on your data.
3. Export to Your BI Tool
Once your dashboard wireframe is ready, use the BI Tool Export feature to send it directly to Power BI or Tableau for further analysis and enhancements. You can also download the dashboard as a PDF, PNG, or JPEG, embed it on a platform, or invite your team to collaborate.
Note: This is a Pro template. You’ll need a Pro subscription on Mokkup to use and customize this dashboard wireframe. Upgrade anytime to unlock full access.
Power Transmission CSR & Public Interface Oversight Dashboard Example
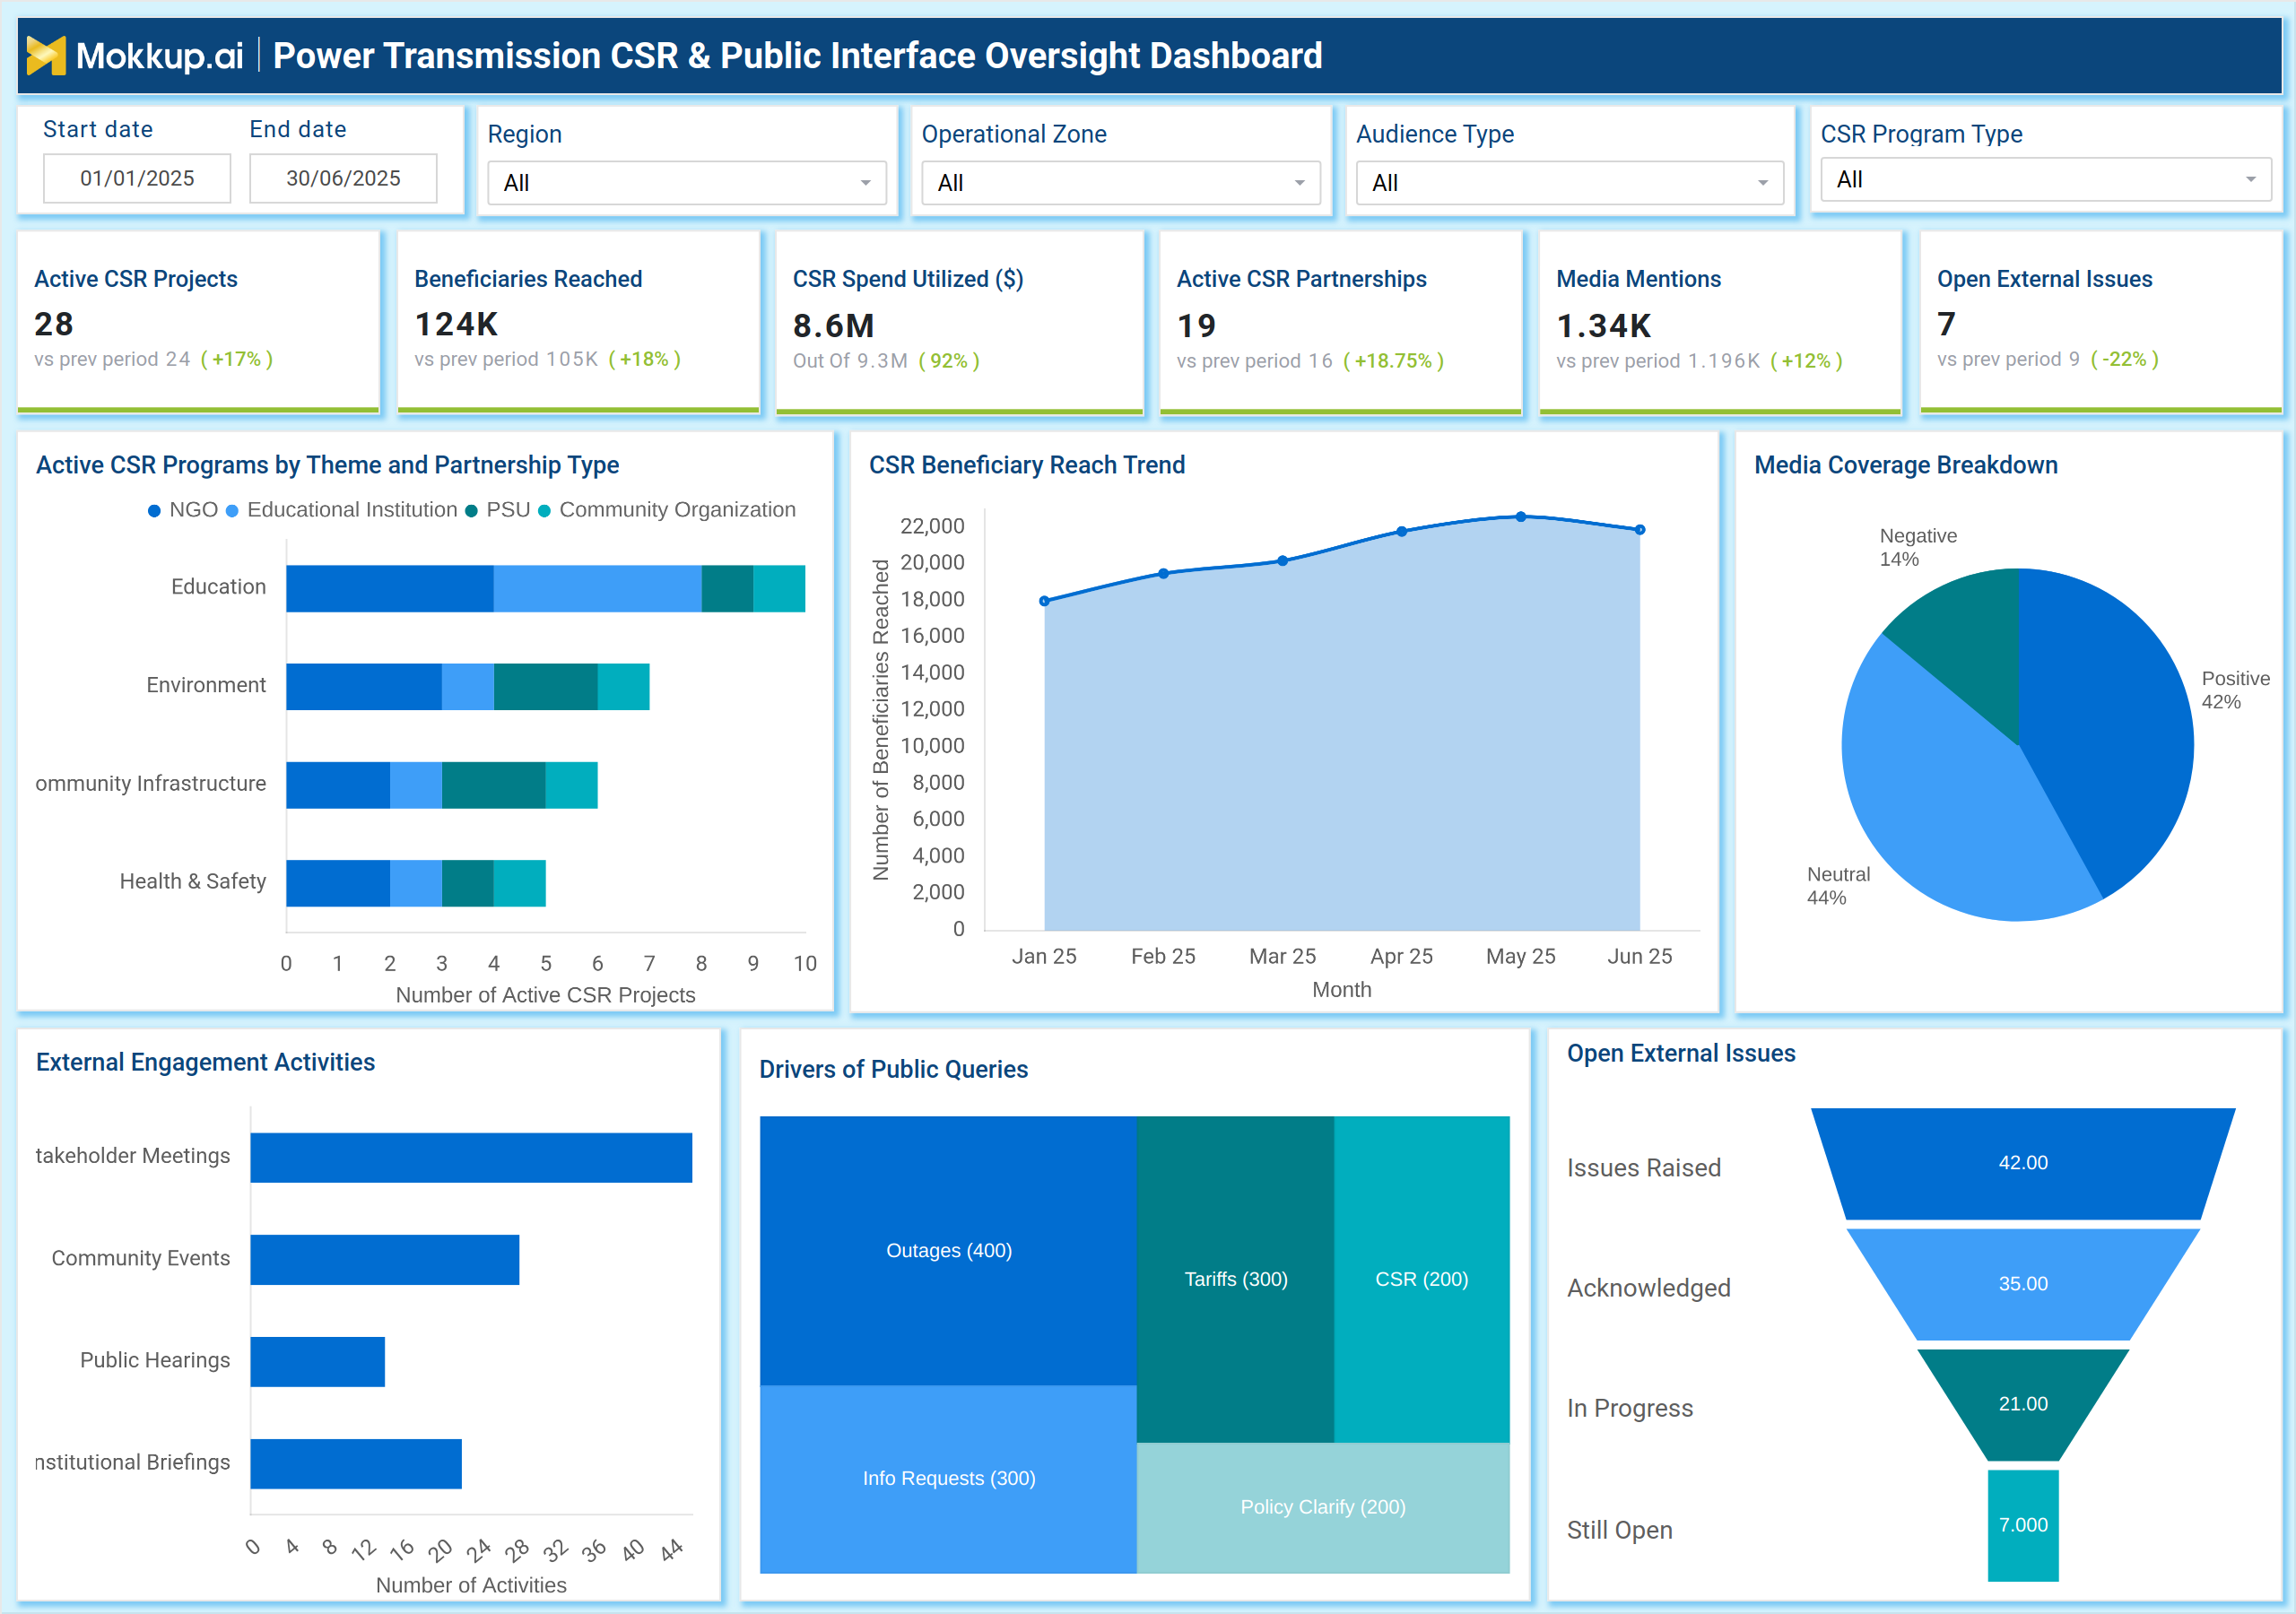
A typical Power Transmission CSR & Public Interface Oversight Dashboard starts with high-level KPIs including active CSR projects, beneficiaries reached, CSR spend utilized, active partnerships, media mentions, and open external issues. These indicators present both CSR delivery progress and the public sentiment context surrounding transmission operations. The dashboard also includes CSR program breakdowns by theme such as education, environment, community infrastructure, and health & safety. Theme distribution combined with partnership type classification (NGO, educational institutions, PSU partners, and community organizations) helps leadership assess which CSR channels are most active and where strategic focus exists. A CSR beneficiary reach trend chart tracks impact growth over time and validates outcome consistency.
Media coverage breakdown highlights positive, neutral, and negative sentiment proportions, supporting proactive communication management. Public engagement activity metrics show the intensity of stakeholder meetings, community events, public hearings, and institutional briefings. Finally, public issue analytics capture drivers of queries, such as outages, tariffs, CSR requests, policy clarifications, and information requests. An open external issues funnel tracks issue progression from raised to acknowledged, in progress, and still open, supporting structured accountability and response performance tracking. Together, these dashboard elements form a transmission utility CSR analytics dashboard and a transmission public engagement performance dashboard.
How to Analyze Data in Power Transmission CSR & Public Interface Oversight Dashboard
Here is how you can analyze data from this dashboard:
- CSR Portfolio Scale: Review Active CSR Projects to understand overall portfolio size and workload.
- Program Impact: Check Beneficiaries Reached to validate CSR impact and growth trends.
- Budget Utilization: Monitor CSR Spend Utilized ($) to ensure spending aligns with approved budgets and timelines.
- Partnership Coverage: Track Active CSR Partnerships to assess delivery capacity and partner diversification.
- Media & Reputation: Review Media Mentions and sentiment split to identify public perception and reputation risks.
- Public Issue Status: Analyze Open External Issues to measure unresolved public concerns and accountability gaps.
- CSR Focus Balance: Use CSR theme and partnership breakdowns to detect over-reliance on specific themes or partners.
- Impact Trends: Study CSR Beneficiary Reach Trend to identify dips in effectiveness and refine targeting.
- Stakeholder Engagement: Review External Engagement Activities volume to understand outreach intensity and visibility.
- Public Query Drivers: Analyze drivers of public queries to identify recurring causes such as outages or tariff issues.
- Resolution Efficiency: Use the Open External Issues Funnel to identify delays between acknowledgement and closure.
Benefits of Power Transmission CSR & Public Interface Oversight Dashboard
The following are the benefits of using this dashboard:
- Centralized Governance: Provides a single view of CSR execution and stakeholder accountability.
- CSR Performance Visibility: Improves tracking of project progress, partner contribution, and impact outcomes.
- Regulatory Transparency: Strengthens reporting clarity for regulators and government stakeholders.
- Public Interface Control: Supports effective tracking of public issues, engagement activity, and query trends.
- Faster Issue Closure: Reduces unresolved external issues through structured resolution workflows.
- Reputation Management: Enables proactive media sentiment monitoring and communication planning.
- Strategic CSR Planning: Aligns CSR initiatives with education, environment, infrastructure, and safety priorities.
- Audit Readiness: Enhances compliance and audit preparedness through measurable CSR indicators.
KPIs to Track in Power Transmission CSR & Public Interface Oversight Dashboard
The following key KPIs can be tracked by using this dashboard:
- Active CSR Projects (count): Measures the total number of running CSR initiatives under the transmission utility.
- Beneficiaries Reached (count): Tracks how many individuals or communities benefited from CSR programs.
- CSR Spend Utilized ($): Measures CSR budget utilization against the approved CSR allocation.
- CSR Spend Utilization Rate (%): Tracks the percentage of planned CSR spend completed during the reporting period.
- Active CSR Partnerships (count): Tracks the number of active delivery partners supporting CSR execution.
- CSR Programs by Theme (count): Measures CSR project distribution across themes like education, environment, infrastructure, and health & safety.
- CSR Partnership Mix (%): Tracks contribution split by partner type (NGO, PSU, educational institutions, community organizations).
- CSR Beneficiary Reach Trend (count): Monitors change in beneficiaries reached over time.
- External Engagement Activities (count): Tracks total stakeholder interactions such as meetings, hearings, briefings, and events.
Frequently Asked Questions
Q1. What is the main purpose of a Power Transmission CSR & Public Interface Oversight Dashboard?
It helps TSOs track CSR execution and monitor public-facing issues, engagement performance, and accountability in one view.
Q2. Who uses this dashboard in a transmission utility?
CSR teams, corporate communications, regulatory teams, and executive leadership.
Q3. How does this dashboard support CSR compliance?
It tracks CSR spend utilization, project portfolio execution, partnerships, and outcomes in measurable form.