
What is a Pediatrics Growth & Development Monitoring Dashboard?
A Pediatrics Growth & Development Monitoring Dashboard is a specialized healthcare analytics tool designed for pediatric hospitals and health programs to track child growth patterns, nutrition health, and developmental milestones. The dashboard consolidates critical data such as BMI, WHO growth standards, malnutrition rates, and obesity trends, helping healthcare professionals and administrators evaluate population health across regions and age groups.
By visualizing key indicators like autism and ADHD screening coverage, milestone achievements, and early intervention enrollment, the dashboard enhances decision-making in child wellness programs and supports evidence-based public health planning.
How to Create a Pediatrics Growth & Development Monitoring Dashboard
You don’t need to build your report from scratch—just start with a ready-to-use sample Pediatrics Growth & Development Monitoring Dashboard template from Mokkup. Plug in your own data and export it however you like. Here’s how to do it:
1. Create or Log in to Your Mokkup Account
Start by signing up on Mokkup.ai using your email. Already have an account? Just log in, and you’re good to go.
2. Choose and Customize Your Dashboard Template
Find the Pediatrics Growth & Development Monitoring Dashboard template in the Templates section. Use the drag-and-drop editor to adjust KPIs, edit filters, or add elements based on your data.
3. Export to Your BI Tool
Once your dashboard is ready, use the BI Tool Export feature to send it directly to Power BI or Tableau for further analysis and enhancements. You can also download the dashboard as a PDF, PNG, or JPEG, embed it on a platform, or invite your team to collaborate.
Note: This is a Pro template. To use and customize this dashboard wireframe, you’ll need a Pro subscription on Mokkup. Upgrade anytime to unlock full access.
Pediatrics Growth & Development Monitoring Dashboard Example
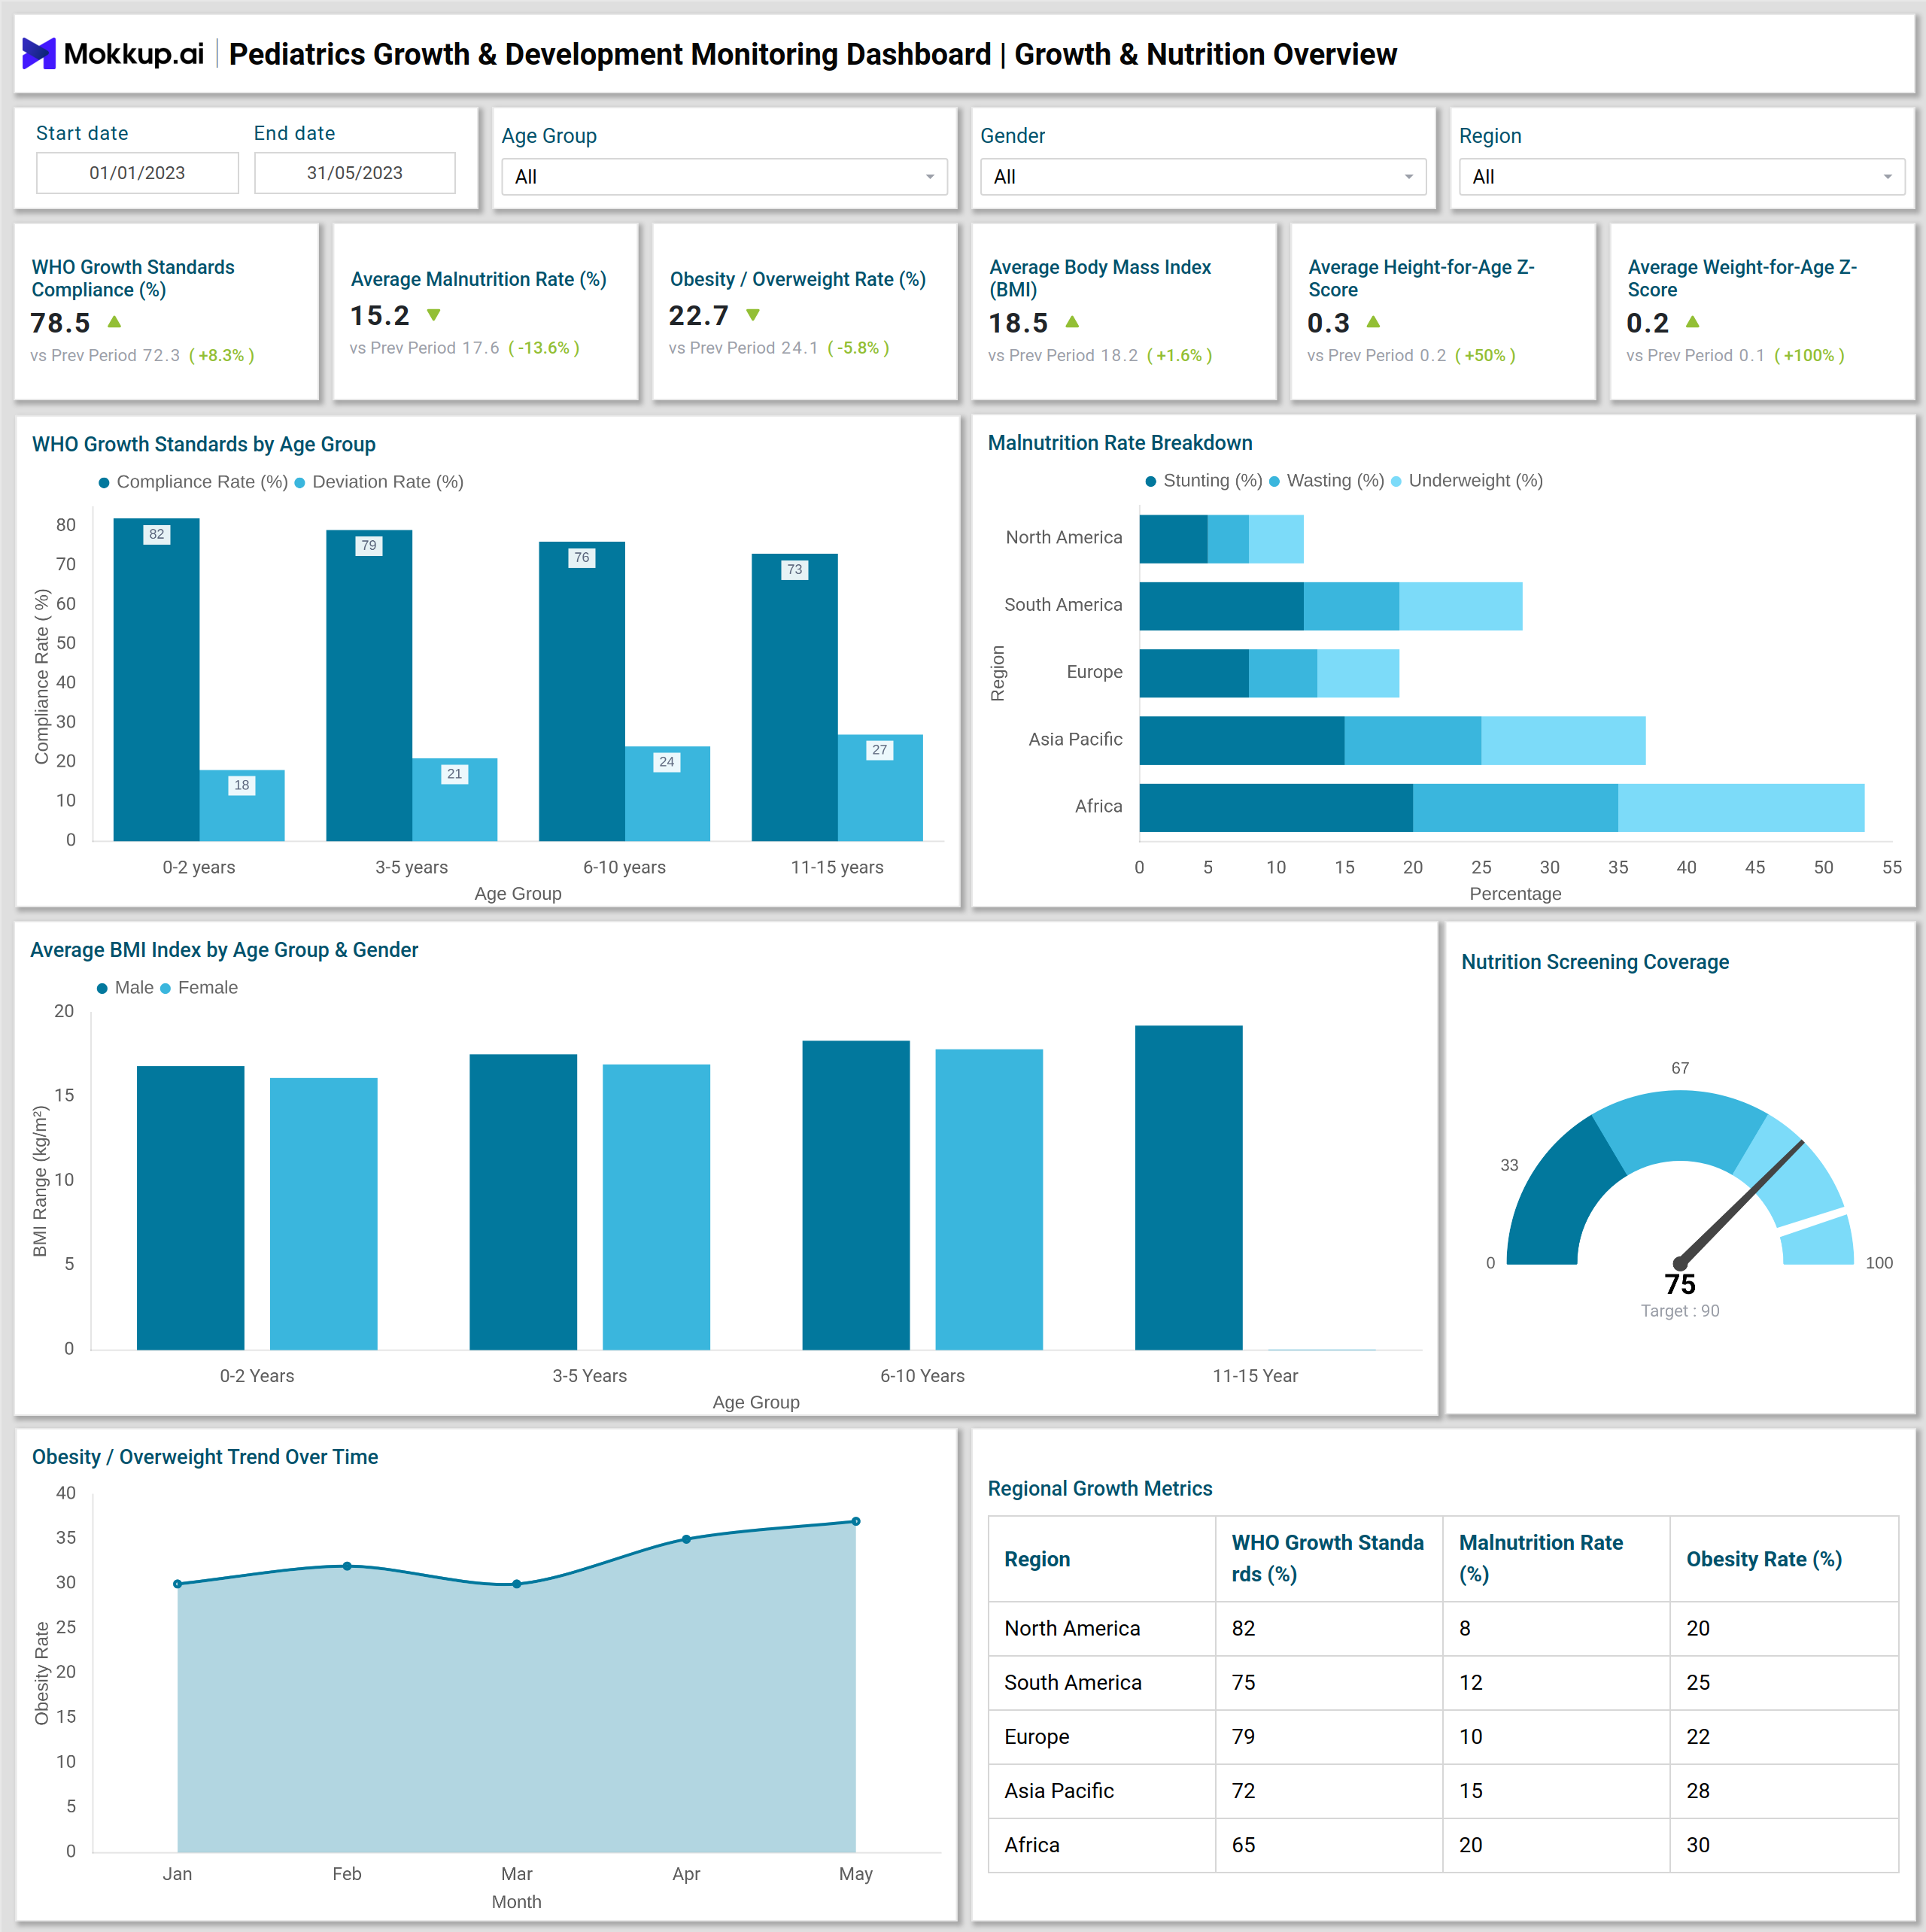
The Pediatrics Growth & Development Monitoring Dashboard Example combines nutrition analytics and developmental tracking into two focused views — the Growth & Nutrition Overview and Developmental & Screening Insights screens.
The Growth & Nutrition Overview screen visualizes child health indicators, including the malnutrition rate (15.2%), the obesity/overweight rate (22.7%), and BMI distribution by age and gender. Key metrics, such as WHO Growth Standards Compliance (78.5%) and nutrition screening coverage (75%), highlight progress toward global pediatric benchmarks. Regional comparisons reveal disparities in the prevalence of stunting, wasting, and underweight, enabling targeted policy actions.
Meanwhile, the Developmental & Screening Insights screen focuses on developmental health parameters, including autism screening coverage (65.2%), ADHD screening (62.8%), and milestone achievement rates (78.5%). Funnel visualizations represent the developmental milestone process, from screening eligible children to those meeting age-appropriate milestones. Additional heatmaps offer regional and age-based coverage to identify screening gaps and inform intervention priorities.
Together, these dashboards empower healthcare providers to measure growth outcomes, track developmental patterns, and ensure timely interventions in pediatric care programs.
How to Analyze Data in Pediatrics Growth & Development Dashboards
Here is how you can analyze data in the Pediatrics Growth & Development Dashboard:
- Review WHO Growth Standards Compliance to assess alignment with international child health benchmarks.
- Compare malnutrition and obesity trends across different regions to identify populations at risk.
- Analyze BMI distribution by age and gender for early detection of growth imbalances.
- Monitor autism and ADHD screening coverage to evaluate developmental health programs.
- Track milestone achievement rates and early intervention enrollment for developmental progress insights.
- Evaluate nutrition screening coverage to ensure comprehensive child health outreach.
- Use regional breakdowns to uncover disparities and guide resource allocation.
Benefits of Pediatrics Growth & Development Monitoring Dashboards
These are the benefits of using the Pediatrics Growth & Development Monitoring Dashboard:
- Improved Child Health Monitoring: Enables continuous tracking of growth, nutrition, and development.
- Data-Driven Public Health Strategy: Identifies regional or demographic gaps in pediatric healthcare delivery.
- Early Detection of Developmental Delays: Tracks autism, ADHD, and milestone progress for timely intervention.
- Enhanced Program Accountability: Monitors performance metrics for pediatric health initiatives.
- Efficient Decision-Making: Combines multiple data streams into one cohesive view for healthcare administrators.
KPIs to Track in a Pediatrics Growth & Development Monitoring Dashboard
Tracking these KPIs helps ensure efficient monitoring of child health outcomes and early intervention programs:
- WHO Growth Standards Compliance (%): Measures adherence to global child growth benchmarks.
- Malnutrition Rate (%): Tracks prevalence of stunting, wasting, and underweight children across regions.
- Obesity / Overweight Rate (%): Monitors overnutrition trends and obesity risk among children.
- Average Body Mass Index (BMI): Represents overall nutritional health across age and gender groups.
- Autism Screening Coverage (%): Indicates screening reach for early diagnosis of autism spectrum disorders.
- ADHD Screening Coverage (%): Tracks assessment rates for behavioral or attention-related developmental challenges.
- Milestone Achievement (%): Measures the proportion of children achieving age-appropriate growth and development benchmarks.
- Early Intervention Enrollment (%): Tracks the percentage of children enrolled in developmental support or rehabilitation programs.
Frequently Asked Questions
1. Who uses the Pediatrics Growth & Development Monitoring Dashboard?
Public health officials, pediatricians, and child welfare organizations use it to monitor and improve child health metrics at local and regional levels.
2. What are the key KPIs in this dashboard?
WHO Growth Compliance, Malnutrition Rate, Obesity Rate, Autism Screening, ADHD Screening, and Milestone Achievement.
3. How does this dashboard help healthcare programs?
It centralizes nutrition and developmental health insights, enabling early action to reduce malnutrition and support holistic child growth.