What is a Maternity & Pediatric Care Operations Dashboard?
A Maternity & Pediatric Care Operations Dashboard is a digital analytics solution designed to monitor, evaluate, and improve all critical aspects of maternal and pediatric clinical operations within a care center. Using real-time visuals, this dashboard tracks patient flow, consultant workloads, lab test turnaround times, resource utilization, bed occupancy, and other operational metrics.
How to Create a Maternity & Pediatric Care Operations Dashboard
You don’t need to build your report from scratch—just start with a ready-to-use dashboard template from Mokkup. Add in your data and export it however you like. Here’s how to do it:
1. Create or Log in to Your Mokkup Account
Start by signing up on Mokkup.ai using your email. If you already have an account, just log in, and you’ll be good to go.
2. Choose and Customize Your Dashboard Template
Find the Maternity & Pediatric Care Operations Dashboard template in the Templates section. Use the drag-and-drop editor to adjust KPIs, edit filters, or add elements based on your data.
3. Export to Your BI Tool
Once your dashboard wireframe is ready, use the BI Tool Export feature to send it directly to Power BI or Tableau for further analysis and enhancements. You can also download the dashboard as a PDF, PNG, or JPEG, embed it on a platform, or invite your team to collaborate.
Note: This is a Pro template. You’ll need a Pro subscription on Mokkup to use and customize this dashboard wireframe. Upgrade anytime to unlock full access.
Maternity & Pediatric Care Operations Dashboard Example
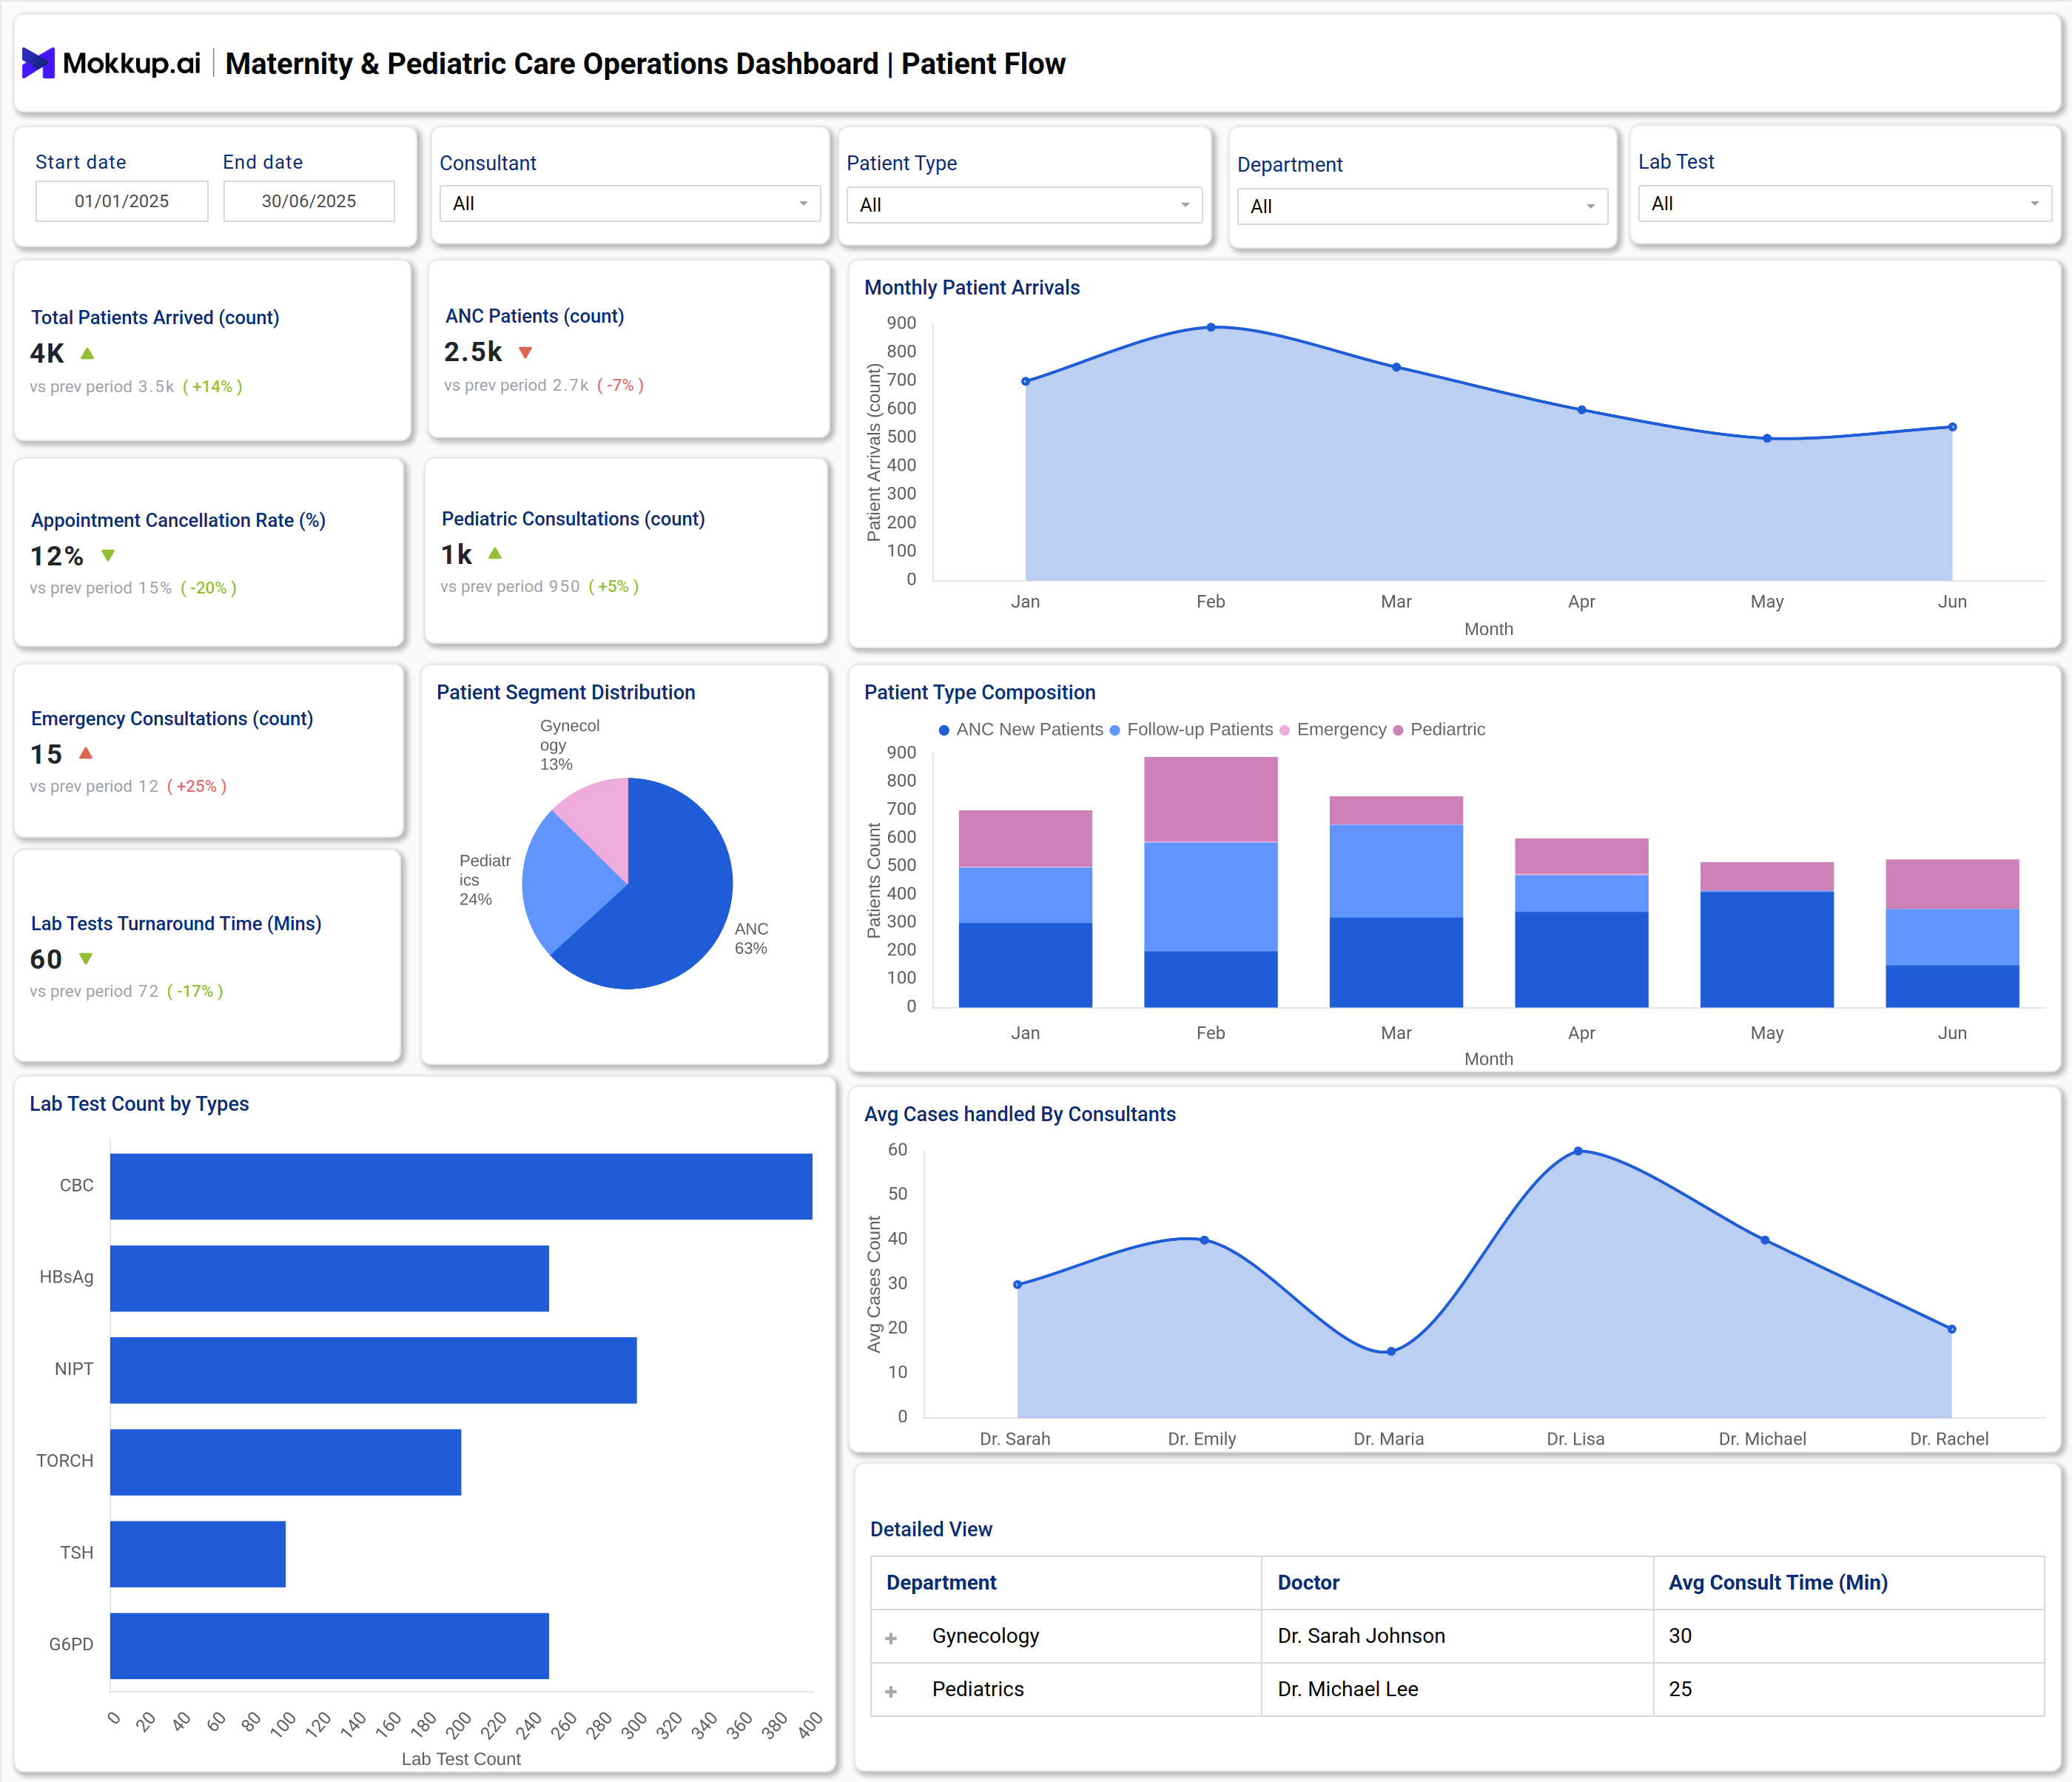
A typical Maternity & Pediatric Care Operations Dashboard combines multiple visualizations and KPI widgets for quick decision-making. For instance, it shows the total patient arrivals, pediatric and ANC consultations, emergency contacts, and rates of appointment cancellations. Pie and bar charts break down patient segments, lab test types, and monthly arrivals. Facility utilization panels track staff deployment, OT utilization percentages, average bed occupancy, and readmission trends. This data-centric template enables administrators to instantly identify peak workloads, delayed procedures, or areas where resources are underutilized. All core operational metrics are displayed on a single interface, enabling leaders to boost productivity and enhance patient outcomes by leveraging data.
How to Analyze Data in Maternity & Pediatric Care Operations Dashboard
- Focus on trend lines for patient arrivals, appointment cancellations, and consult volumes.
- Use segmentation charts to identify which patient types or departments require more resources.
- Analyze staff performance widgets to optimize scheduling and resource allocation.
- Check lab test turnaround times to identify delays that impact patient flow.
- Review bed occupancy and OT utilization to maximize facility operations.
- Compare actual performance to targets to identify inefficiencies or emerging issues promptly.
Benefits of Maternity & Pediatric Care Operations Dashboard
- Centralized management of patient flow and facility resources.
- Faster decisions through actionable data on operational bottlenecks.
- Improved accuracy for staff and consultant allocation.
- Reduced delays in lab tests and procedures by tracking turnaround times.
- Supports regulatory reporting with standardized, exportable metrics.
- Enables real-time KPI monitoring for continuous process improvement.
KPIs to Track in Maternity & Pediatric Care Operations Dashboard
- ANC Patients Count: Tracks the number of antenatal care patients seen.
- Appointment Cancellation Rate: Measures the percentage of scheduled appointments that were canceled.
- Pediatric Consultations Count: Counts consultations specifically for pediatric patients.
- Emergency Consultations Count: Tracks the number of emergency cases handled.
- Lab Tests Turnaround Time: Average time taken to complete lab tests from order to result.
- Lab Test Count by Types: Number of each type of lab test performed.
Frequently Asked Questions
Q1. Who uses a Mother & Child Care Operations Dashboard?
Hospital administrators, department heads, and care center managers use this dashboard for daily operations, resource planning, and quality improvement.
Q2. What kind of data sources connect to the dashboard?
Admissions systems, electronic health records, lab management applications, and facility scheduling platforms are standard sources that can be added manually to the dashboard.
Q3. How does it improve patient care?
By optimizing patient flow, reducing bottlenecks, and supporting resource allocation based on up-to-date metrics.