What is a Pediatric Telehealth Engagement Dashboard?
A pediatric telehealth engagement monitoring dashboard is a digital analytics tool that helps hospitals track how effectively pediatric patients and parents interact with telehealth services. It consolidates virtual visit data, engagement metrics, satisfaction scores, and follow-up outcomes in one place. This dashboard gives clinical and operational teams a complete view of how telemedicine is used, where engagement gaps exist, and what factors influence visit completion. Hospitals use this platform to assess teleconsultation volume, engagement funnel performance, wait time distribution, connection success rates, and reasons for missed appointments. By monitoring parent participation and virtual visit behaviors, the dashboard supports better planning for telehealth operations, clinical support, and patient experience improvements.
How to Create a Pediatric Telehealth Engagement Dashboard
You don’t need to build your report from scratch, just start with a ready-to-use dashboard template from Mokkup. Add in your data and export it however you like. Here’s how to do it:
1. Create or Log in to Your Mokkup Account
Start by signing up on Mokkup.ai using your email. If you already have an account, just log in, and you’ll be good to go.
2. Choose and Customize Your Dashboard Template
Find the Pediatric Telehealth Engagement Dashboard template in the Templates section. Use the drag-and-drop editor to adjust KPIs, edit filters, or add elements based on your data.
3. Export to Your BI Tool
Once your dashboard wireframe is ready, use the BI Tool Export feature to send it directly to Power BI or Tableau for further analysis and enhancements. You can also download the dashboard as a PDF, PNG, or JPEG, embed it on a platform, or invite your team to collaborate.
Note: This is a Pro template. You’ll need a Pro subscription on Mokkup to use and customize this dashboard wireframe. Upgrade anytime to unlock full access.
Pediatric Telehealth Engagement Dashboard Example
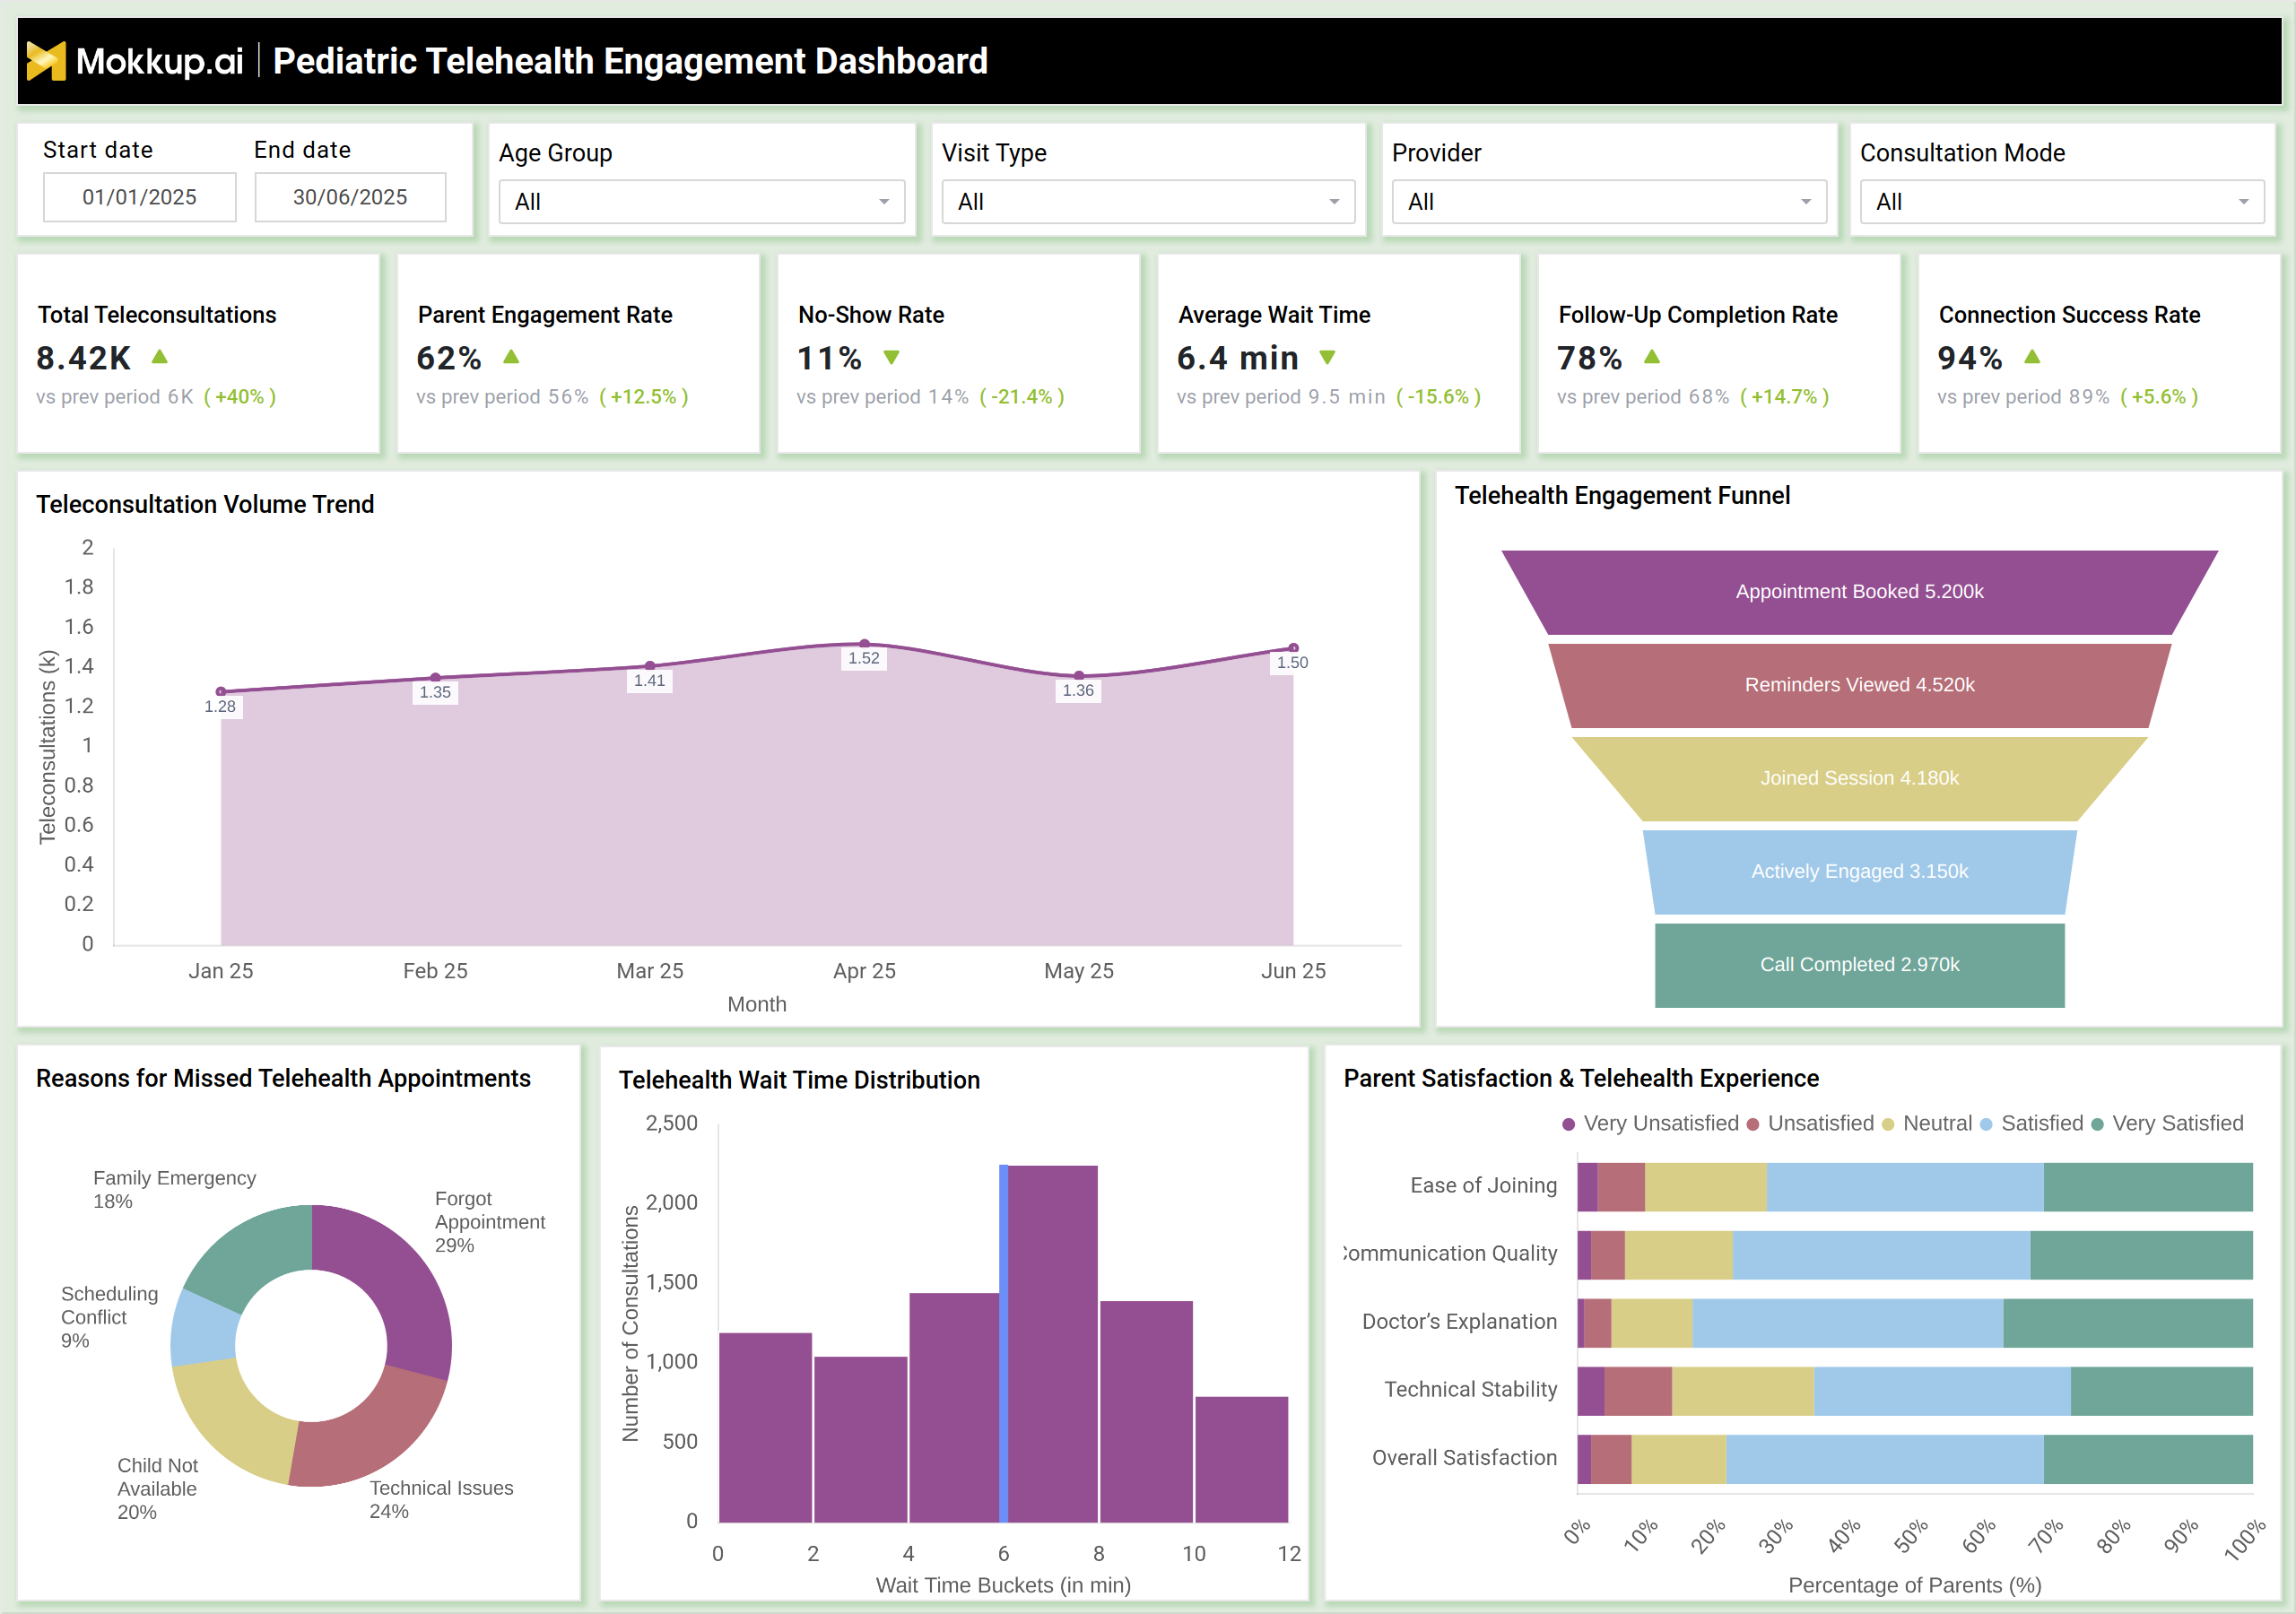
The dashboard example above visualizes the full virtual care journey, from teleconsultation booking to session completion. Metrics such as Total Teleconsultations, Parent Engagement Rate, No-Show Rate, Average Wait Time, Follow-Up Completion Rate, and Connection Success Rate highlight the overall efficiency of remote pediatric care. A key component is the Telehealth Engagement Funnel, which breaks down each stage Appointments Booked, Reminders Viewed, Joined Session, Actively Engaged, and Call Completed. This structure aligns with how a pediatric telemedicine patient engagement dashboard evaluates participation and drop-off. Additional visuals, such as Teleconsultation Volume Trend and Wait Time Distribution, enable operational teams to assess demand patterns and service bottlenecks. Charts like Reasons for Missed Telehealth Appointments and Parent Satisfaction & Telehealth Experience support quality improvement initiatives. Together, these features reflect a comprehensive digital pediatric care engagement tracking platform, offering actionable insights for improving virtual care delivery.
How to Analyze Data in Pediatric Telehealth Engagement Dashboard
A pediatric telehealth engagement dashboard helps you break down how families interact with virtual care, and here’s how to analyze the data in a way that actually reveals what’s working and what needs attention:
- Track Teleconsultation Volume: Identify usage trends across months to understand demand for virtual pediatric services.
- Evaluate Engagement Funnel: Review each stage of the telehealth funnel to pinpoint where parents drop off before completing a visit.
- Assess Parent Engagement Rates: Monitor how many parents join sessions, respond to reminders, or actively participate in virtual visits.
- Analyze No-Show Patterns: Understand the drivers of no-shows using reasons such as scheduling conflicts, technical issues, or forgotten appointments.
- Monitor Wait Time Distribution: Detect bottlenecks that lead to long waits and affect patient satisfaction.
- Review Technical Stability: Use connection success rates to evaluate system performance and telehealth platform reliability.
- Measure Follow-Up Completion: Track how many telehealth visits lead to completed follow-up actions or in-person care.
- Evaluate Parent Satisfaction: Analyze ratings for ease of joining, communication quality, doctor clarity, and technical stability.
- Compare Provider Performance: Assess whether specific providers have higher engagement, longer wait times, or more dropped sessions.
- Identify Remote Care Adoption Trends: Use insights from pediatric remote care adoption and usage analytics to support telehealth expansion.
Benefits of Pediatric Telehealth Engagement Dashboard
A pediatric telehealth engagement dashboard gives hospitals a clear view of how well their virtual care system is actually working, and these are the key benefits it brings to the table:
- Improves Virtual Visit Efficiency: Tracks engagement, wait times, and technical issues to streamline telehealth workflows.
- Enhances Patient and Parent Experience: Provides data to improve communication, satisfaction, and participation in remote visits.
- Supports Data-Driven Telehealth Strategy: The pediatric virtual care utilization analytics tool helps leaders understand usage trends and resource needs.
- Reduces No-Show Rates: Insights into scheduling issues and engagement gaps help hospitals create targeted interventions.
- Optimizes Teleconsultation Workflows: The pediatric teleconsultation performance monitoring dashboard highlights delays, drop-offs, and system issues.
- Improves Follow-Up Compliance: Tracks post-visit actions to ensure continuity of pediatric care.
- Strengthens Technical Infrastructure: Identifies bandwidth or platform issues affecting call stability and connection success.
- Supports Remote Care Expansion: Helps hospitals assess which age groups, visit types, and providers benefit most from virtual care.
KPIs to Track in Pediatric Telehealth Engagement Dashboard
- Total Teleconsultations (Count): Measures demand and usage of pediatric telehealth services.
- Parent Engagement Rate (%): Tracks how effectively parents participate in virtual visits.
- No-Show Rate (%): Indicates scheduling, reminder, or technical challenges.
- Average Wait Time (Minutes): Shows how long families wait before joining telehealth sessions.
- Follow-Up Completion Rate (%): Measures how many telehealth visits lead to completed follow-up care.
- Connection Success Rate (%): Tracks platform reliability and call connectivity.
- Engagement Funnel Stage Metrics: Helps evaluate conversion across appointment reminders, session joins, and call completion.
- Reasons for Missed Appointments: Identifies barriers such as technical issues or forgotten appointments.
- Wait Time Distribution: Detects operational delays affecting satisfaction.
- Parent Satisfaction Scores: Provides feedback across joining ease, communication, doctor explanations, and overall experience.
Frequently Asked Questions
Q1. What is the purpose of a Pediatric Telehealth Engagement Dashboard?
It helps hospitals monitor parent engagement, telehealth usage, and virtual care performance to improve pediatric remote care delivery.
Q2. Who uses this dashboard?
Telehealth coordinators, pediatric care teams, digital health managers, and operational leaders.
Q3. How does it enhance telehealth efficiency?
By highlighting wait times, no-shows, engagement drop-offs, and technical issues that affect telehealth performance.
Q4. Can the dashboard track patient satisfaction?
Yes, it visualizes parent satisfaction and experience metrics to improve communication and care quality.
Q5. Does it support trend analysis?
Yes, it shows monthly usage trends, engagement funnel metrics, and changes in teleconsultation volume.