
What is a Pediatric Outreach & Referral Acquisition Dashboard?
A pediatric outreach and referral management dashboard is a healthcare analytics tool designed to track community outreach activities, referral patterns, and patient navigation flows across pediatric hospitals. It provides a centralized view of pediatric referral sources, outreach performance, and conversion stages, allowing hospitals to analyze how effectively children move through the referral pipeline from initial outreach to scheduled appointments and completed visits.
This dashboard serves as a pediatric patient referral tracking and analytics tool, enabling healthcare teams to understand which outreach channels and referral partners generate the most pediatric cases. By combining referral volume, conversion insights, outreach engagement, and follow-up status in one place, it supports faster decision-making and improves pediatric access across regions.
How to Create a Pediatric Outreach & Referral Acquisition Dashboard
You don’t need to build your report from scratch, just start with a ready-to-use dashboard template from Mokkup. Add in your data and export it however you like. Here’s how to do it:
1. Create or Log in to Your Mokkup Account
Start by signing up on Mokkup.ai using your email. If you already have an account, just log in, and you’ll be good to go.
2. Choose and Customize Your Dashboard Template
Find the Pediatric Outreach & Referral Acquisition Dashboard template in the Templates section. Use the drag-and-drop editor to adjust KPIs, edit filters, or add elements based on your data.
3. Export to Your BI Tool
Once your dashboard wireframe is ready, use the BI Tool Export feature to send it directly to Power BI or Tableau for further analysis and enhancements. You can also download the dashboard as a PDF, PNG, or JPEG, embed it on a platform, or invite your team to collaborate.
Note: This is a Pro template. You’ll need a Pro subscription on Mokkup to use and customize this dashboard wireframe. Upgrade anytime to unlock full access.
Pediatric Outreach & Referral Acquisition Dashboard Example
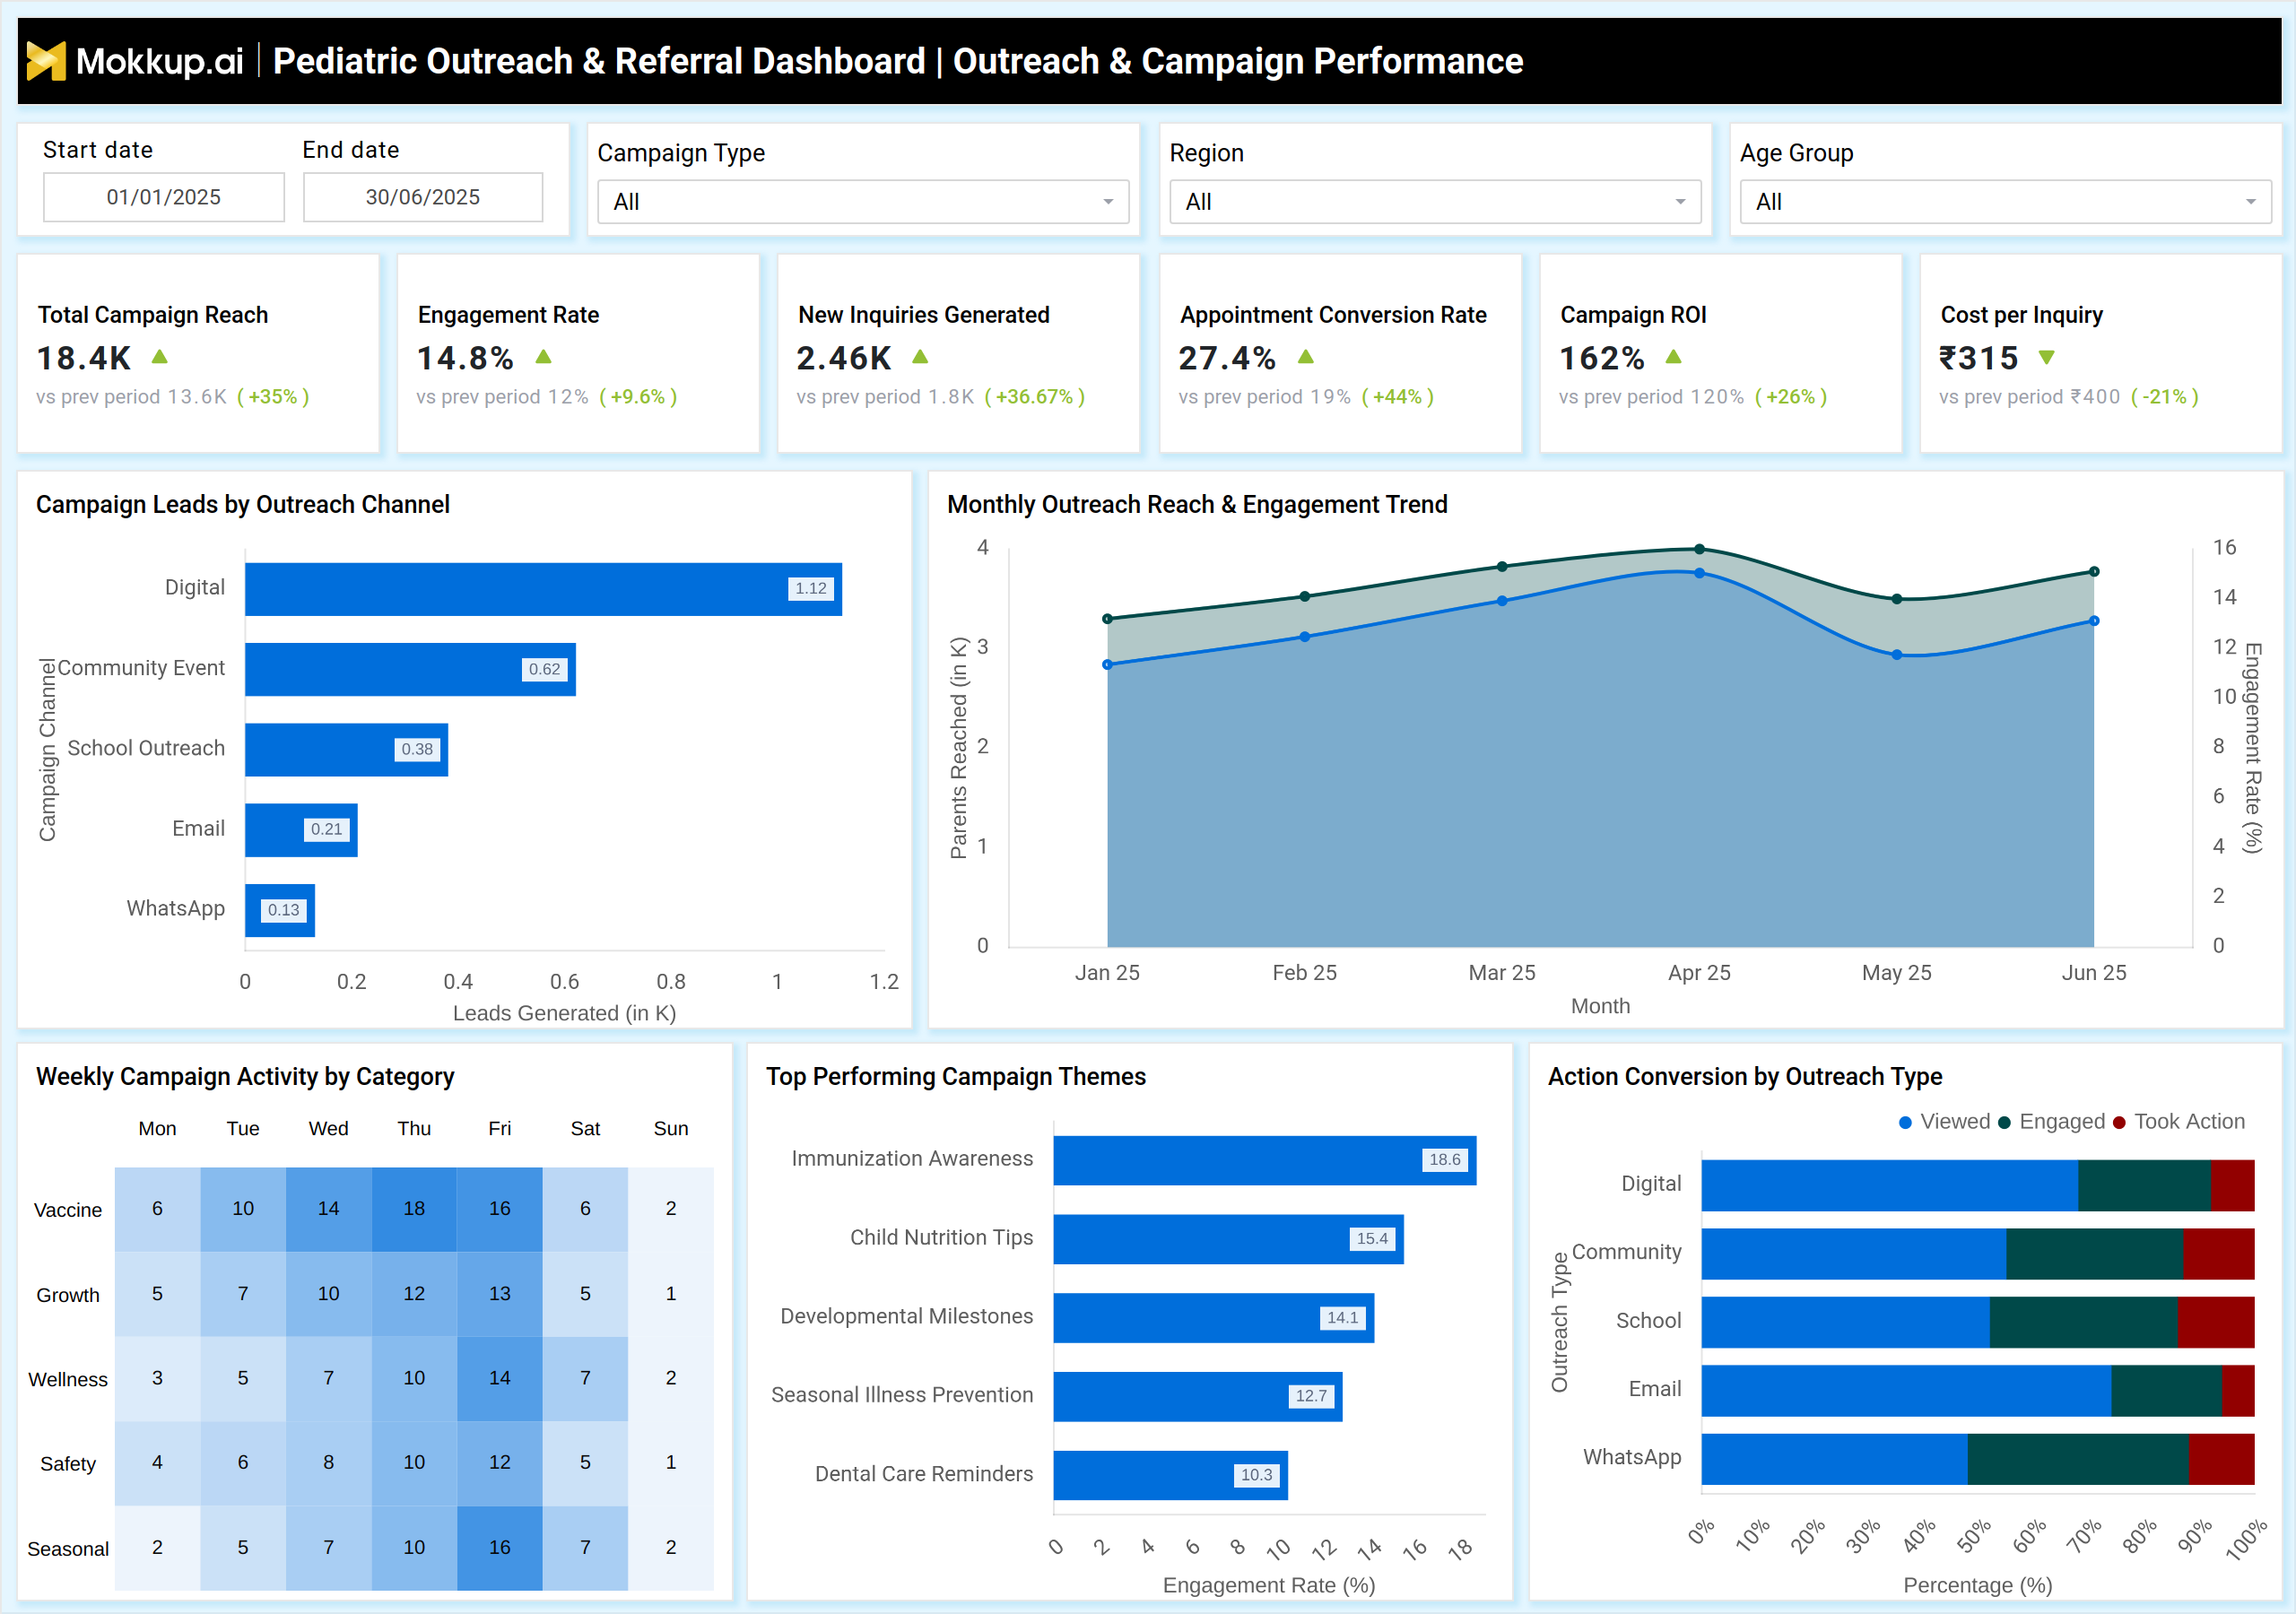
The example dashboard above displays a comprehensive view of both outreach impact and referral workflow performance. It includes KPIs such as Total Referrals, Referral Completion Rate, Outreach Engagement Rate (%), Referral Conversion Rate (%), and Average Referral Turnaround Time. Visual components, such as Monthly Referral Volume Trend, Top Referral Sources, and Community Outreach Engagement by Region, demonstrate how outreach activities impact pediatric referral flows.
This aligns with the purpose of a community pediatric outreach performance monitoring dashboard, enabling hospitals to measure the effectiveness of outreach programs in attracting and retaining pediatric patients. The dashboard also analyzes the pediatric referral pipeline and conversion tracking dashboard stages, such as Outreach → Referral → Scheduled Visit → Attended Visit. Funnel and bar chart visuals help identify where drop-offs occur. Additional charts, such as Referral Completion by Specialty and Follow-Up Status by Facility, enable pediatric teams to identify bottlenecks and implement targeted improvements. Overall, this dashboard serves as a comprehensive pediatric hospital outreach and engagement analytics solution, providing detailed insights into referral quality, outreach effectiveness, and downstream patient movement.
How to Analyze Data in Pediatric Outreach & Referral Acquisition Dashboard
Here is how you can analyze data from this dashboard:
- Track Referral Volume Trends: Review monthly referral increases and decreases to understand community demand and the impact of outreach.
- Compare Referral Source Performance: Identify which schools, clinics, or community partners generate the highest number of pediatric referrals.
- Assess Outreach Effectiveness: Utilize engagement metrics to gauge the effectiveness of outreach programs in connecting with communities and caregivers.
- Analyze Referral Completion Rates: Evaluate the percentage of referrals that convert into scheduled and attended pediatric visits.
- Monitor Turnaround Time: Track the time it takes for a referral to be processed and scheduled, identifying any workflow delays that may occur.
- Review Region-Wise Outreach Impact: Assess engagement and referral rates across geographic regions to focus resources effectively.
- Study Specialty-Specific Referrals: Identify which pediatric specialties receive the most referrals and whether capacity aligns with demand.
- Evaluate Pipeline Drop-Offs: Analyze where patients exit the referral pipeline, specifically before scheduling, attending, or during follow-up.
- Measure Follow-Up Compliance: Track the number of referred children who complete post-visit follow-ups or return for scheduled care.
- Optimize Workflow Efficiency: Use insights from the pediatric care referral workflow optimization dashboard to streamline processes.
Benefits of Pediatric Outreach & Referral Acquisition Dashboard
- Improved Referral Visibility: Centralized tracking of all pediatric referrals, sources, and conversion outcomes.
- Higher Outreach Impact: Measures the effectiveness of community programs and identifies areas for improvement.
- Streamlined Referral Workflow: Supports faster processing and reduced delays across the pediatric referral pipeline.
- Better Resource Allocation: Helps hospitals deploy outreach teams and pediatric specialists where demand is highest.
- Enhanced Community Engagement: Builds stronger relationships with schools, clinics, and outreach partners.
- Data-Driven Program Management: Enables leadership to understand what drives referral volume and where systems need strengthening.
- Reduced Drop-Off Rates: Identifies barriers preventing families from scheduling or completing pediatric referrals.
- Improved Access to Pediatric Care: Ensures children move efficiently from outreach to completed appointments.
KPIs to Track in Pediatric Outreach & Referral Acquisition Dashboard
- Total Pediatric Referrals (Count): Measures the total number of incoming referrals from all community partners.
- Referral Completion Rate (%): Tracks how many referrals result in completed pediatric visits.
- Outreach Engagement Rate (%): Measures participation and interaction levels within community programs.
- Top Referral Sources: Identifies clinics, schools, or community groups generating the highest referral volume.
- Referral Conversion Rate (%): Indicates the percentage of referrals that progress through each stage of the pipeline.
- Average Referral Turnaround Time: Measures the time from initial referral to scheduled appointment.
- Referral Drop-Off Rate (%): Indicates the percentage of patients who drop out of the referral pipeline.
- Referral Volume by Region: Highlights geographic variations in outreach performance.
- Specialty-Based Referral Trends: Tracks referral distribution across pediatric specialties.
- Follow-Up Completion Rate (%): Measures post-visit adherence and continuity of care.
Frequently Asked Questions
1. What is the purpose of a Pediatric Outreach & Referral Acquisition Dashboard?
It helps hospitals analyze referral sources, track patient referral journeys, and measure the performance of outreach programs for pediatric care.
2. Who uses this dashboard?
Pediatric program managers, hospital administrators, outreach coordinators, and community engagement teams.
3. How does it support community outreach?
By providing insights into outreach engagement, referral volume, and conversion trends, enabling teams to focus efforts on high-impact areas.
4. Can the dashboard track referral pipeline performance?
Yes. It visualizes each referral stage, creating a comprehensive pediatric referral pipeline and conversion tracking dashboard.