
What is a Patient Imaging Insights Dashboard?
The patient imaging dashboard tracks radiology performance, allowing hospital departments to get an overview of data in a visual form. Monitoring the key diagnostic imaging KPIs can empower departments to improve and brainstorm ideas to address issues. It can be deemed an imaging solution used in medical and diagnostic settings to optimize imaging processes, enhance patient satisfaction, and clinical effectiveness.
How to Create a Patient Imaging Insights Dashboard
You don’t need to build it from scratch. Just find the Mokkup.ai imaging dashboard template, add your data, and export it however you like. Follow these steps:
1. Create or Log in to Your Mokkup Account
Start by signing up on Mokkup.ai using your email. If you already have an account, just log in, and you’ll be good to go.
2. Choose and Customize Your Dashboard Template
The Patient Imaging Insights dashboard template is in the Templates section. Use the drag-and-drop editor to adjust KPIs, edit filters, or add elements based on your data.
3. Export to Your BI Tool
Once your dashboard wireframe is ready, use the BI Tool Export feature to send it directly to Power BI or Tableau for further analysis and enhancements. You can also download the dashboard as a PDF, PNG, or JPEG, embed it on a platform, or invite your team to collaborate.
Note: This is a Pro template. You’ll need a Pro subscription on Mokkup to use and customize this dashboard wireframe. Upgrade anytime to unlock full access.
Patient Imaging Insights Dashboard Example
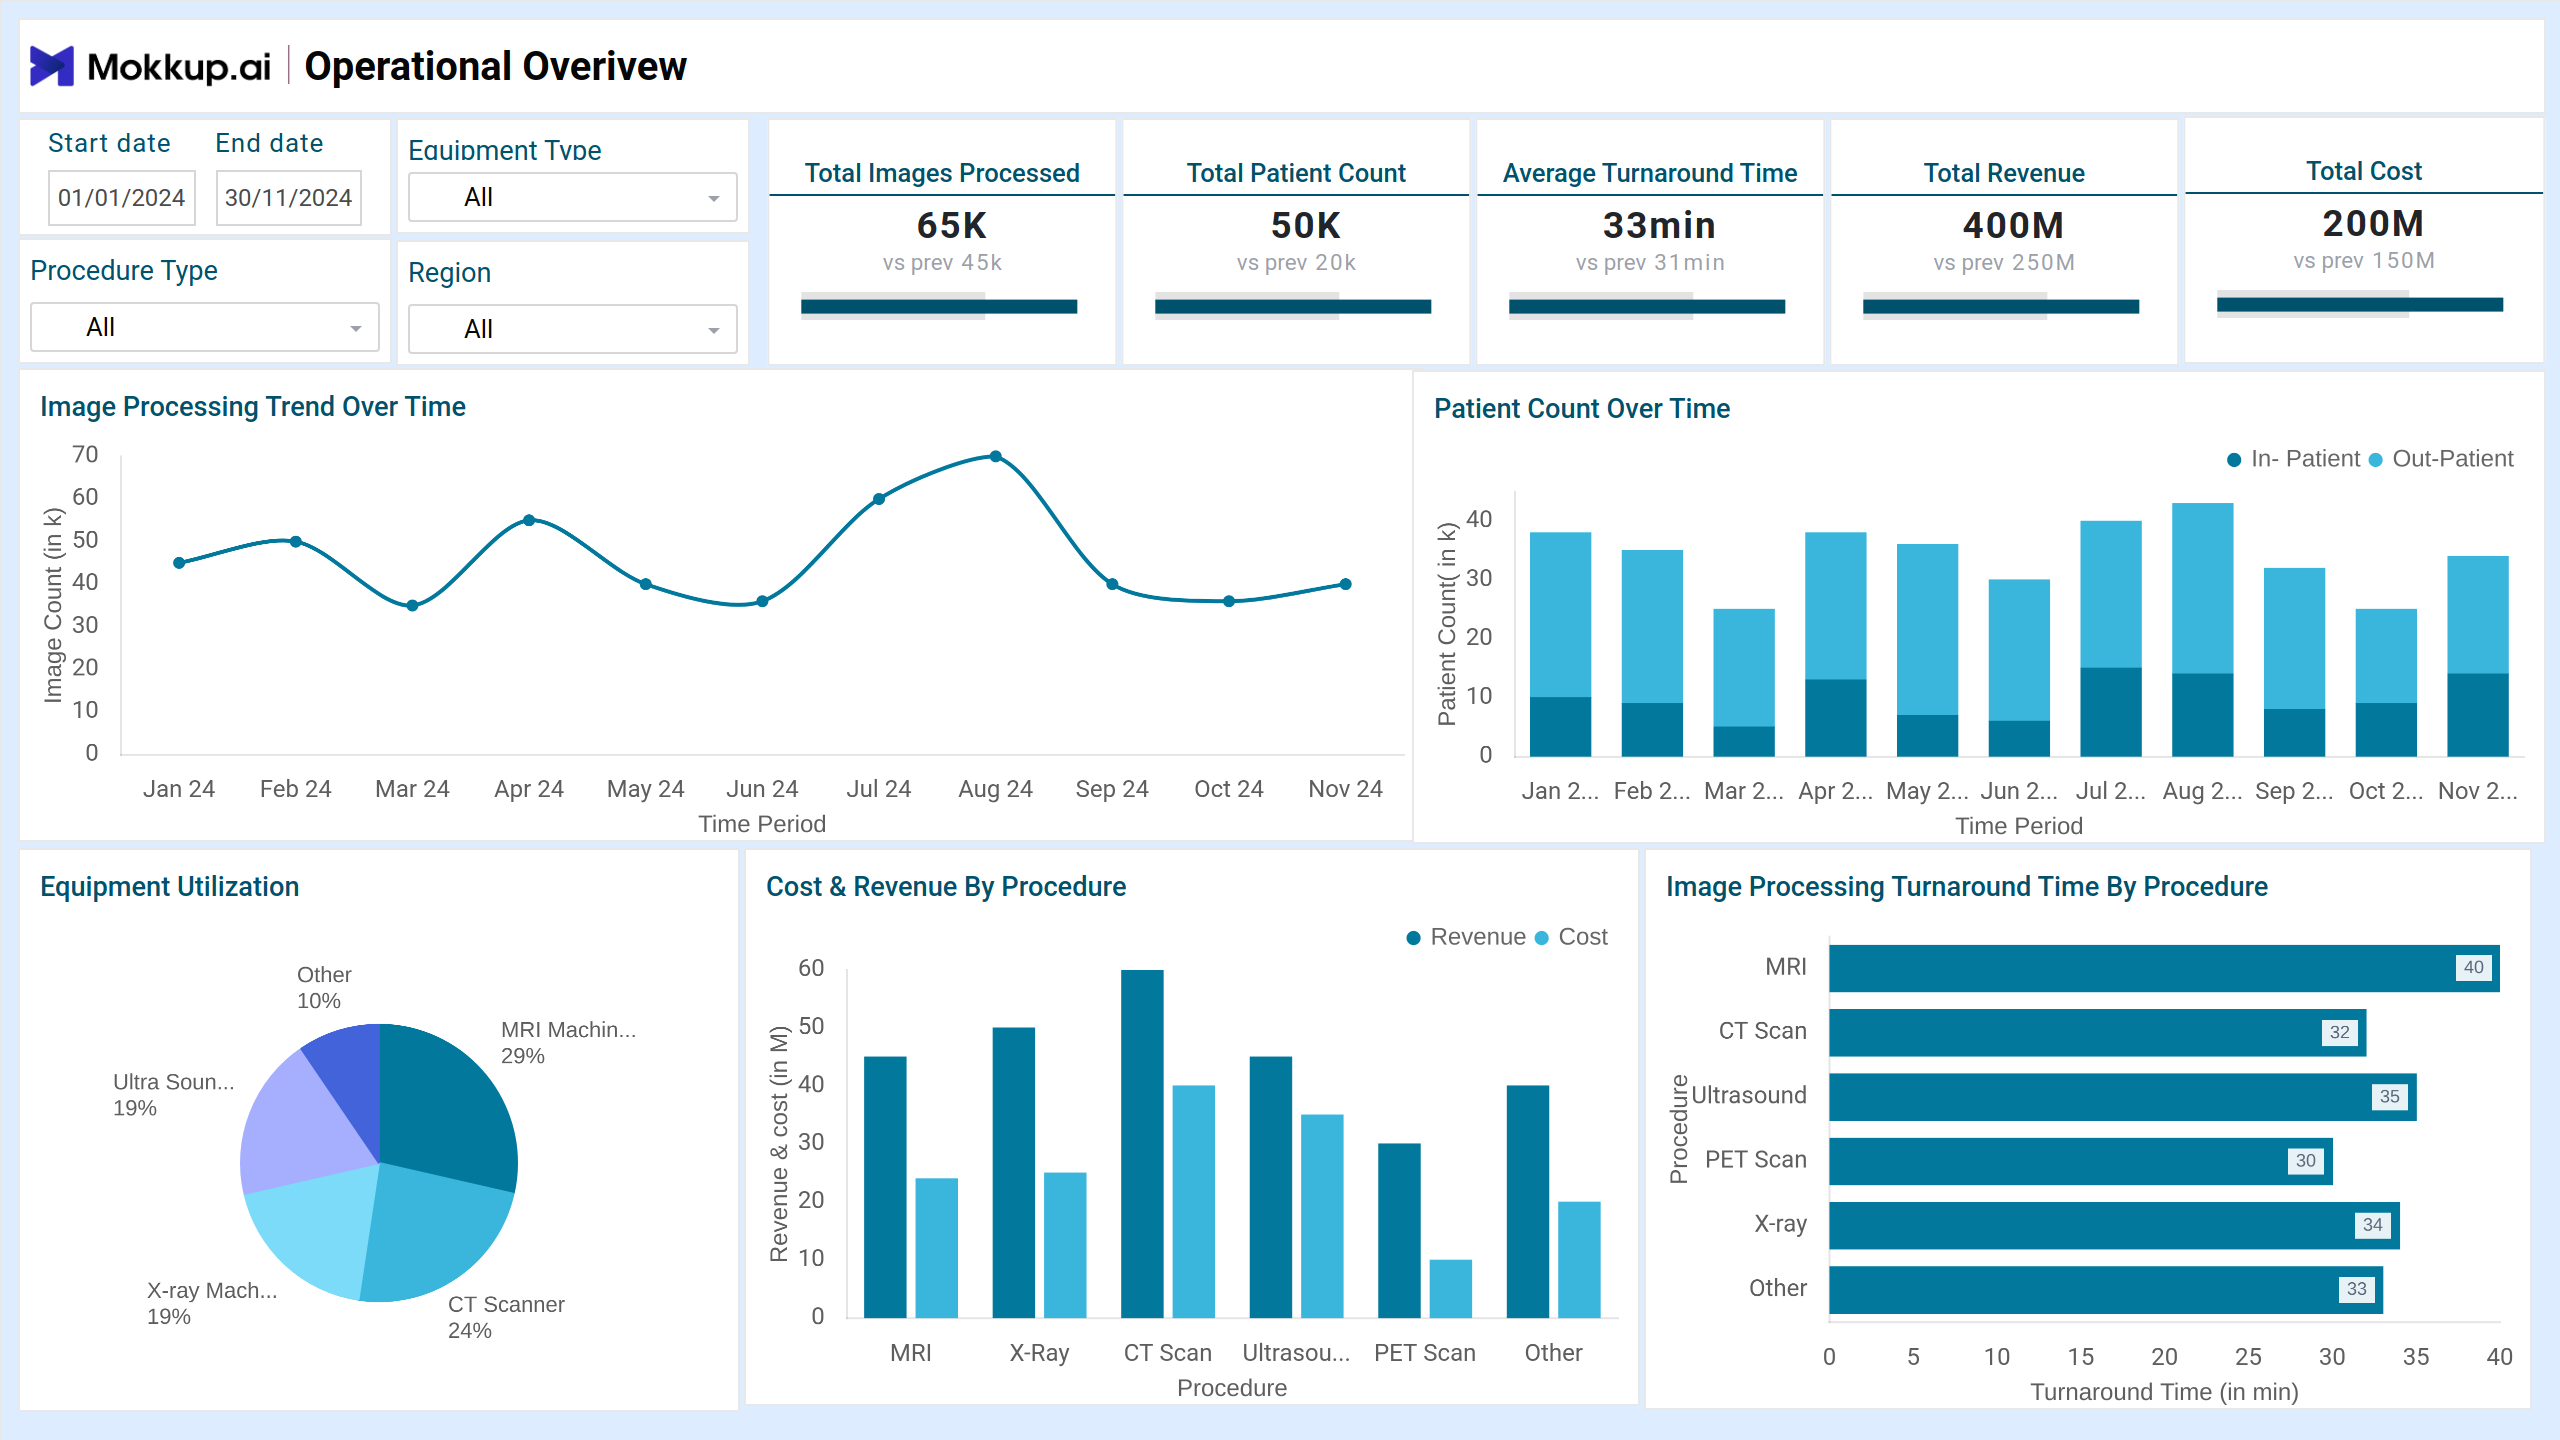
This real-time scan result dashboard can be used by radiology departments to monitor and optimize diagnostic imaging workflows, covering modalities like X-rays, MRIs, CT scans, and ultrasounds. It features intuitive navigation filters such as date range, equipment type, procedure type, and region for drilling down to specific imaging insights. Additionally, the KPI tiles in this dashboard wireframe give a wholesome view of imaging performance while enabling data-driven decision making.
How to Analyze Data in Medical Imaging Dashboards
Analyzing data in this Radiology results dashboard comprises interpretation KPIs to uncover patterns, assess efficiency, and drive improvements in radiology workflows. Start by looking at the images processed to understand overall laboratory testing insights. The average turnaround time (TAT) is crucial for evaluating how quickly imaging results are delivered and how patients count change over time to analyze imaging trends, seasonal fluctuations, or the impact of specific campaigns or policy changes.
Benefits of Imaging Insights Dashboards
The imaging workflow efficiency dashboard enhances the efficiency of the laboratory department by tracking trends that impact the diagnostic accuracy and analysis. Here is how medical imaging analytics can be beneficial for you:
- This customizable dashboard template helps administrators and radiologists track various performance metrics in one place.
- With all critical areas covered by this dashboard, it supports data-driven resource allocation.
- It allows healthcare facilities to improve radiology efficiency by facilitating real-time updates on workflow efficiency.
- It also helps identify imaging inefficiencies, such as wait times or slow processing times, which aids resource planning.
KPIs to Track in Patient Imaging Dashboards
This CT/MRI scan reporting tool includes essential KPIs such as:
- Total Images Processed: Volume of images the system handles within a specific timeframe.
- Image Processing Trend Over Time: This metric measures the processing speed and accuracy change over time.
- Patient Count Over Time: The total number of patients undergoing imaging procedures within a specific period.
- Average Wait Time: It is the average wait time for patients before receiving medical attention.
- Rework Rate: It involves the percentage of imaging results that require repeated scans due to some error.
- Average Equipment Downtime: This is the average amount of time the imaging equipment was non-operational due to repairs or other technical issues.
Frequently Asked Questions
1. Who uses the patient imaging insights dashboard?
Radiologists, hospital administrators, imaging technicians, and quality assurance teams use it to monitor key metrics and optimize imaging workflows.
2. Is patient data protected in these dashboards?
Absolutely. Dashboards are typically built with secure, HIPAA-compliant infrastructure, ensuring patient data is anonymized and protected.