
What is a Pathology Labs Patient Acquisition Dashboard?
A Pathology Labs Patient Acquisition Dashboard is a strategic tool designed for pathology lab managers, marketing teams, and business development executives to monitor and analyze patient acquisition performance. It provides comprehensive visibility into new patient numbers, conversion rates, acquisition costs, marketing ROI, and channel effectiveness. Unlike scattered reports, this dashboard acts as a centralized pathology labs patient acquisition tracking dashboard, helping institutions understand where their patients are coming from, which marketing efforts are working, and how efficiently they are converting leads into patients.
How to Create a Pathology Labs Patient Acquisition Dashboard
You don’t need to build your report from scratch—just start with a ready-to-use Pathology Labs Patient Acquisition Dashboard template from Mokkup. Add in your data and export it however you like. Here’s how to do it:
1. Create or Log in to Your Mokkup Account
Start by signing up on Mokkup.ai using your email. If you already have an account, just log in, and you’ll be good to go.
2. Choose and Customize Your Dashboard Template
Find the Pathology Labs Patient Acquisition Dashboard template in the Templates section. Use the drag-and-drop editor to adjust KPIs, edit filters like date ranges and acquisition channels, or add elements based on your specific data.
3. Export to Your BI Tool
Once your dashboard wireframe is ready, use the BI Tool Export feature to send it directly to Power BI or Tableau for further analysis and enhancements. You can also download the dashboard as a PDF, PNG, or JPEG, embed it on a platform, or invite your team to collaborate.
Note: This is a Pro template. You’ll need a Pro subscription on Mokkup to use and customize this dashboard wireframe. Upgrade anytime to unlock full access.
Pathology Labs Patient Acquisition Dashboard Example
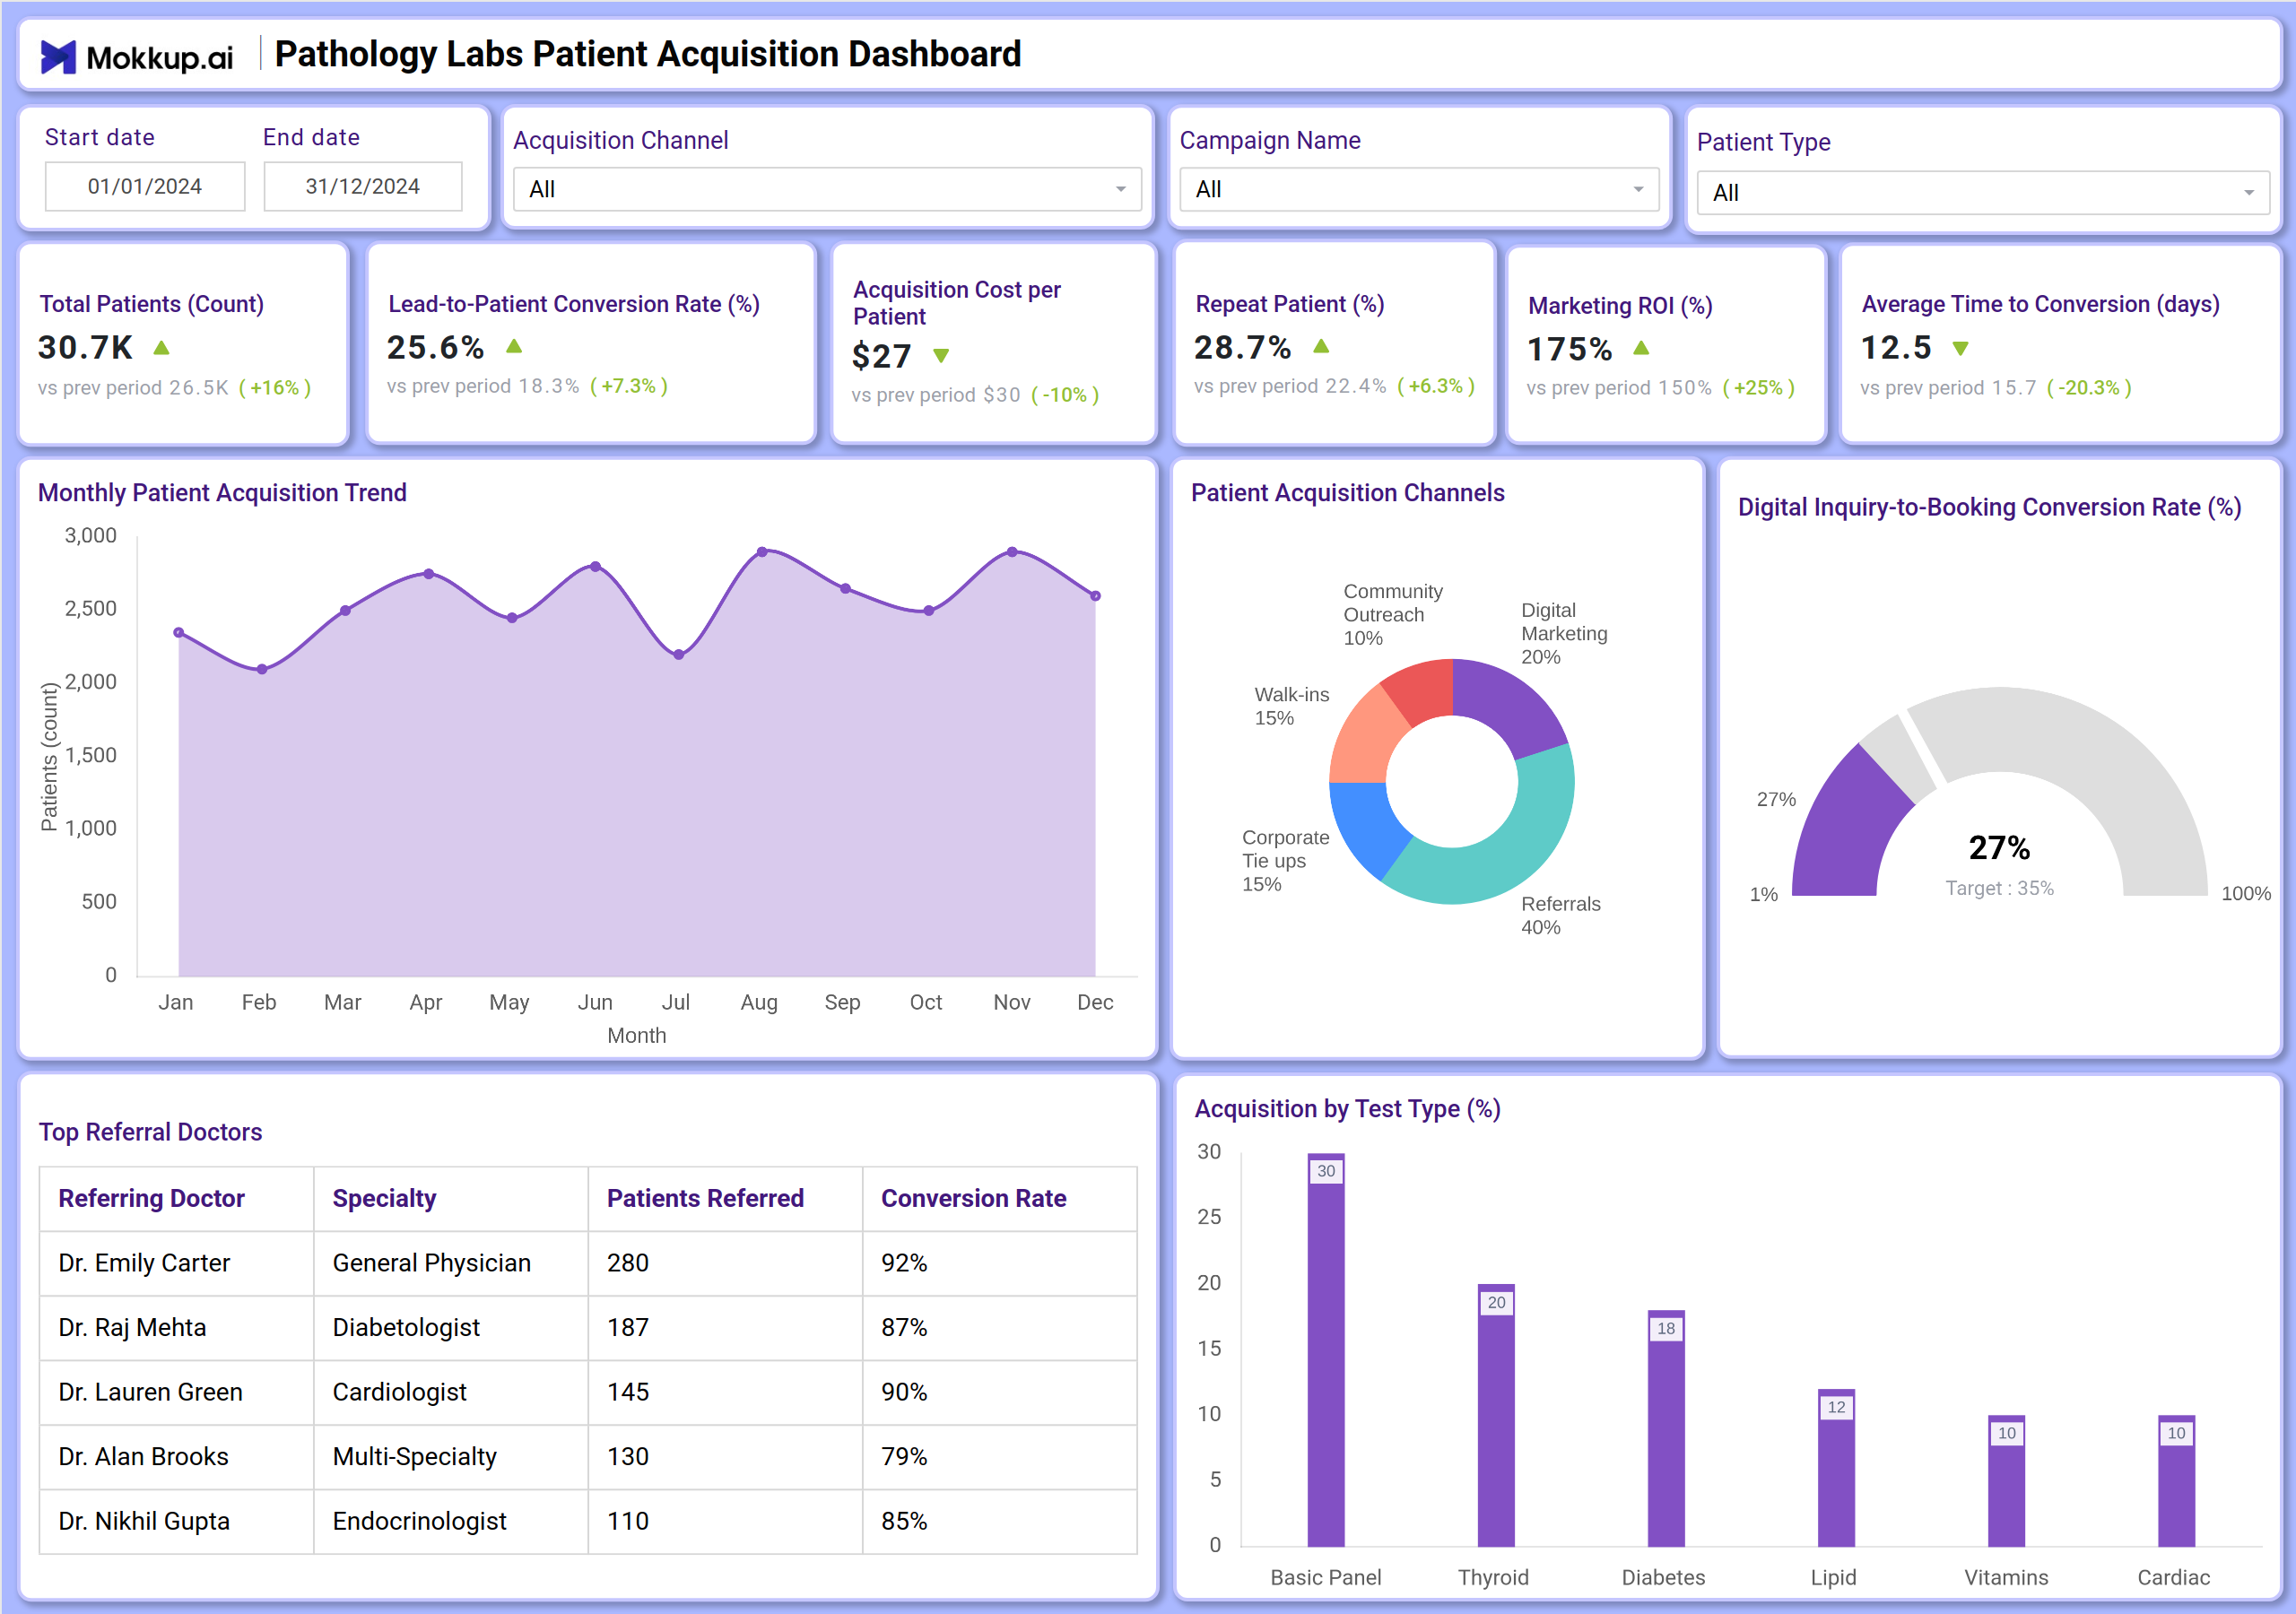
You can create a Pathology Labs Patient Acquisition Dashboard with a mix of KPI tiles and visualizations. At the top, KPI cards track key metrics such as total new patients, lead-to-patient conversion rate, and acquisition cost per patient. Below that, charts show the monthly patient acquisition trend, breakdown of patients by acquisition channel, and the performance of top referral doctors. A gauge chart tracks the digital inquiry-to-booking conversion rate against a target, and a bar chart shows acquisition distribution by test type. Together, this dashboard works as a dashboard for tracking pathology lab patient acquisition metrics, ensuring management gets a holistic view of marketing effectiveness and patient sourcing.
How to Analyze Data in Pathology Labs Patient Acquisition Dashboards
Here’s how pathology labs can make the most of the data available on the Pathology Labs patient acquisition dashboard:
- Track Patient Growth: Use the monthly trend line chart to identify seasonal patterns and growth in new patient numbers.
- Monitor Conversion Efficiency: Analyze the lead-to-patient conversion rate to see how effectively your lab turns potential inquiries into booked appointments.
- Review Acquisition Cost: Monitor the acquisition cost per patient to ensure marketing spend is efficient and sustainable.
- Evaluate Channel Performance: See which acquisition channels—like Physician Referrals, Digital Marketing, or Walk-ins—bring in the most patients.
- Assess Referral Partnerships: Use the top referral doctors table to identify and nurture relationships with your most valuable partners.
- Measure Patient Loyalty: Track the repeat patient percentage to understand patient retention and satisfaction.
- Gauge Marketing Effectiveness: Calculate marketing ROI to see the financial return on your campaigns and initiatives.
- Understand Patient Journey: Review the average time to conversion to see how long it takes for a lead to become a patient.
Benefits of Pathology Labs Patient Acquisition Dashboards
This dashboard offers several key benefits:
- Improved Marketing Visibility: Clear KPIs across all acquisition channels and campaigns.
- Cost Efficiency: Tracks acquisition cost per patient and marketing ROI for better budget allocation.
- Enhanced Conversion Rates: Identifies bottlenecks in the patient journey from lead to appointment.
- Data-Driven Partnerships: Highlights the most effective referral doctors for strategic relationship management.
- Strategic Planning: Trend analysis supports forecasting and strategic decision-making for growth.
- Performance Benchmarking: Allows labs to compare current performance against previous periods.
Together, these elements provide management with a clear picture of patient acquisition health, making it easier to align marketing strategies with business growth objectives. That’s why many lab managers call it the best patient acquisition dashboard for pathology labs for scaling patient volume and marketing efficiency.
KPIs to Track in Pathology Labs Patient Acquisition Dashboards
You can track below KPIs via a Pathology Labs Patient Acquisition dashboard:
- Total New Patients (Count): The total number of new patients acquired within a selected period, indicating overall growth.
- Lead-to-Patient Conversion Rate (%): The percentage of leads or inquiries that successfully convert into booked patients, measuring process efficiency.
- Acquisition Cost per Patient: The average marketing and sales spend required to acquire a single new patient, indicating cost-effectiveness.
- Repeat Patient (%): The percentage of patients who return for additional tests, reflecting patient satisfaction and loyalty.
- Marketing ROI (%): The return on investment from marketing activities, showing the financial effectiveness of campaigns.
- Average Time to Conversion (days): The average number of days it takes for a lead to become a patient, highlighting the speed of the acquisition process.
- Acquisition by Channel: The breakdown of where new patients come from (e.g., Physician Referrals, Digital Marketing).
- Digital Inquiry-to-Booking Conversion Rate (%): The specific conversion rate for digital leads, measured against a set target.
- Top Referral Doctors: A list of referring physicians who send the most patients, along with their conversion rates.
- Acquisition by Test Type (%): The distribution of new patients by the type of diagnostic test they initially book.
Frequently Asked Questions
1. Who should use a Pathology Labs Patient Acquisition Dashboard?
Lab managers, marketing directors, business development managers, and practice owners responsible for patient growth and marketing strategy.
2. Can this dashboard help reduce patient acquisition costs?
Yes. By tracking acquisition cost per patient and marketing ROI, labs can identify the most cost-effective channels and campaigns, optimizing spend.
3. How does it support marketing strategy?
It provides data on which channels and referral partners are most effective, allowing for strategic allocation of marketing resources and efforts.
4. Is this dashboard useful for managing doctor relationships?
Absolutely. The top referral doctors section provides actionable insights to strengthen relationships with high-performing partners and improve collaboration with others.