
What is an Orthopedic Surgery Analytics Dashboard?
An orthopedic operations analytics dashboard is a digital platform designed for hospitals and orthopedic institutions to monitor, analyze, and optimize all aspects of surgical and operational performance. The dashboard aggregates data from various hospital departments—covering everything from resource allocation, surgical procedure efficiency, and case progression to post-operative outcomes.
How to Create an Orthopedic Surgery Analytics Dashboard
You don’t need to build your report from scratch—just start with a ready-to-use dashboard template from Mokkup. Add in your data and export it however you like. Here’s how to do it:
1. Create or Log in to Your Mokkup Account
Start by signing up on Mokkup.ai using your email. If you already have an account, just log in, and you’ll be good to go.
2. Choose and Customize Your Dashboard Template
Find the orthopedic surgery analytics Dashboard template in the Templates section. Use the drag-and-drop editor to adjust KPIs, edit filters, or add elements based on your data.
3. Export to Your BI Tool
Once your dashboard wireframe is ready, use the BI Tool Export feature to send it directly to Power BI or Tableau for further analysis and enhancements. You can also download the dashboard as a PDF, PNG, or JPEG, embed it on a platform, or invite your team to collaborate.
Note: This is a Pro template. You’ll need a Pro subscription on Mokkup to use and customize this dashboard wireframe. Upgrade anytime to unlock full access.
Orthopedic Surgery Analytics Dashboard Example
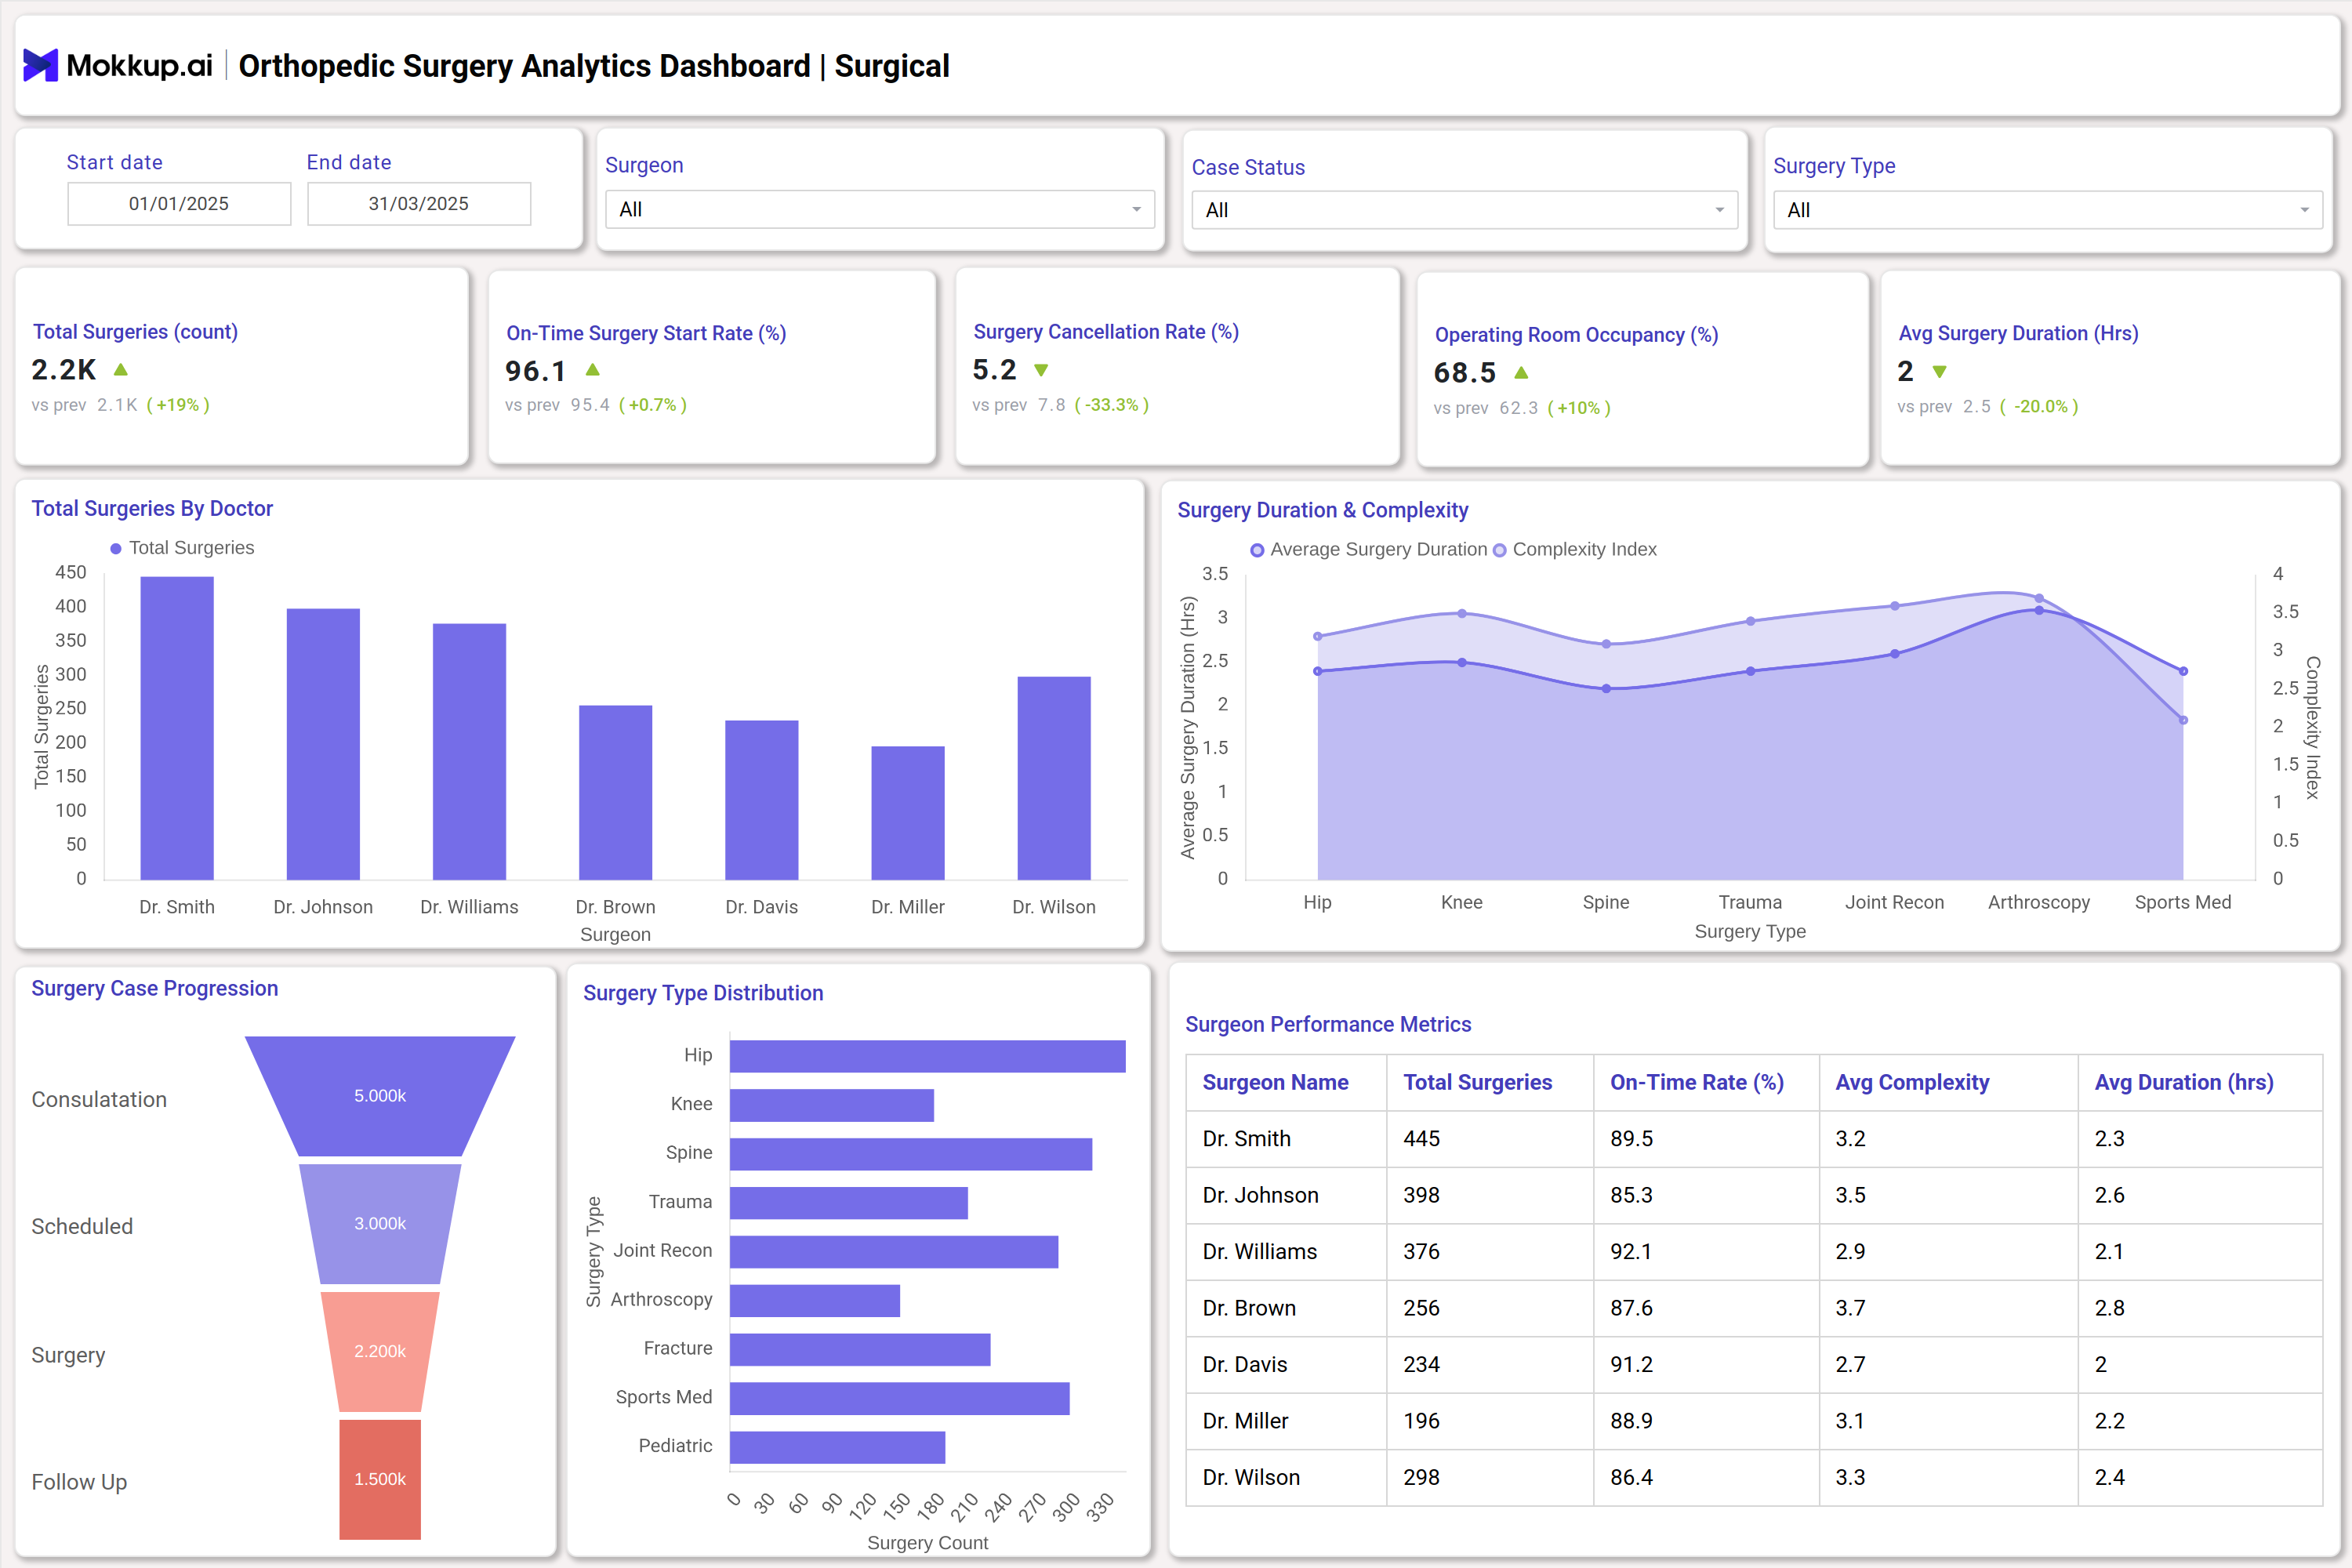
A typical orthopedic operations analytics dashboard for hospitals provides a unified view of surgery volumes, implant utilization, equipment downtime, staff allocation, and post-operative recovery. The dashboard presents visual summaries, including surgical efficiency dashboards, orthopedic caseload analysis, and detailed breakdowns by department, surgeon, and implant type. For example, a dashboard might display trends in hip, shoulder, and spine surgeries, highlight on-time surgery start performance, track bed and operating room utilization, and monitor staff utilization. The orthopedic procedure tracking features also include real-time monitoring of post-op infections, readmission rates, and resource consumption—all focused on managing and optimizing every stage of patient care.
How to Analyze Data in Orthopedic Surgery Analytics Dashboards
You can analyze data in the following ways from orthopedic performance metrics hospital orthopedic dashboard:
- Begin with surgical efficiency metrics: review on-time start rates, average surgery duration, and surgery cancellation rates for actionable insights.
- Monitor staff and bed utilization trends to identify resource bottlenecks or overages.
- Track implant usage by type, analyzing cost impact and usage trends to optimize procurement and reduce waste.
- Drill down into operations by department (e.g., joint replacement, trauma, sports medicine) for focused caseload analysis.
- Review equipment downtime logs alongside cost and mitigation strategies to assess the effectiveness of maintenance.
- Utilize patient outcome metrics—such as average length of stay and mobility improvement scores—to evaluate and improve the quality of care.
- Regularly assess KPIs for deviations and identify opportunities for improvement in workflow, case throughput, and infection control.
Benefits of Orthopedic Surgery Analytics Dashboards
The following are the benefits of implementing this dashboard:
- Enhance surgical workflow efficiency by leveraging real-time data and analytics.
- Enable data-driven decisions through comprehensive orthopedic performance metrics.
- Optimize staff allocation by tracking utilization trends and workloads.
- Reduce operational costs by closely monitoring implant usage and equipment downtime, which enhances the hospital's diagnostic capabilities.
- Enhance patient outcomes with better post-operative tracking and infection control analytics.
- Facilitate regulatory compliance with robust, standardized data reporting.
- Deliver transparency for stakeholders—from surgeons to hospital management—ensuring accountability and continuous improvement.
KPIs to Track in Orthopedic Surgery Analytics Dashboards
You can track the following orthopedic operations KPIs for better clinical performance and outcomes:
- Total Surgeries (count): Tracks the number of surgeries performed in a period.
- On-Time Surgery Start Rate: Measures the percentage of surgeries that begin as scheduled.
- Surgical Cancellation Rate: Shows the rate of cancelled surgeries to flag operational issues.
- Operating Room Occupancy: Assesses the efficiency of OR utilization.
- Average Surgery Duration: Reports the mean surgery time for workflow optimization.
- Average Implant Cost: Monitors cost trends across implant types.
Frequently Asked Questions
1. What makes this dashboard crucial for orthopedic hospitals?
This dashboard centralizes all critical surgical and operational data, enabling quick, informed actions to boost care quality and resource efficiency.
2. How does it improve surgical efficiency?
By continuously monitoring surgery times, cancellations, and staff activity, inefficiencies can be quickly detected and resolved, leading to smoother workflows.
3. What orthopedic surgery analytics does it provide?
It covers procedure tracking, staff allocation, implant costs, infection monitoring, clinical outcomes, and much more, tailored for hospital and institutional use.