What is an Orthopedic Hospital Diagnostics Dashboard?
An Orthopedic Hospital Diagnostics Dashboard is a healthcare analytics tool that tracks diagnostic test volumes, accuracy, abnormal findings, and revenue performance. It consists of test data from multiple sources, such as X-rays, MRIs, CT scans, ultrasounds, and blood tests, giving hospitals real-time visibility into diagnostic efficiency and patient outcomes.
The orthopedic hospital diagnostics dashboard template helps administrators monitor diagnostic accuracy, utilization rates, and financial performance. It ensures hospitals can reduce errors, optimize test usage, and improve overall care delivery.
How To Create an Orthopedic Hospital Diagnostics Dashboard
You don’t need to build your report from scratch—just start with a ready-to-use Orthopedic Hospital Diagnostics dashboard template from Mokkup. Add in your data and export it however you like. Here’s how to do it:
1. Create or Log in to Your Mokkup Account
Start by signing up on Mokkup.ai using your email. If you already have an account, just log in, and you’ll be good to go.
2. Choose and Customize Your Dashboard Template
You can find the Orthopedic Hospital Diagnostics Dashboard template in the Templates section. Use the drag-and-drop editor to adjust KPIs, edit filters, or add elements based on your data.
3. Export to Your BI Tool
Once your dashboard wireframe is ready, use the BI Tool Export feature to send it directly to Power BI or Tableau for further analysis and enhancements. You can also download the dashboard as a PDF, PNG, or JPEG, embed it on a platform, or invite your team to collaborate.
Note: This is a Pro template. You’ll need a Pro subscription on Mokkup to use and customize this dashboard wireframe. Upgrade anytime to unlock full access.
Orthopedic Hospital Diagnostics Dashboard Example
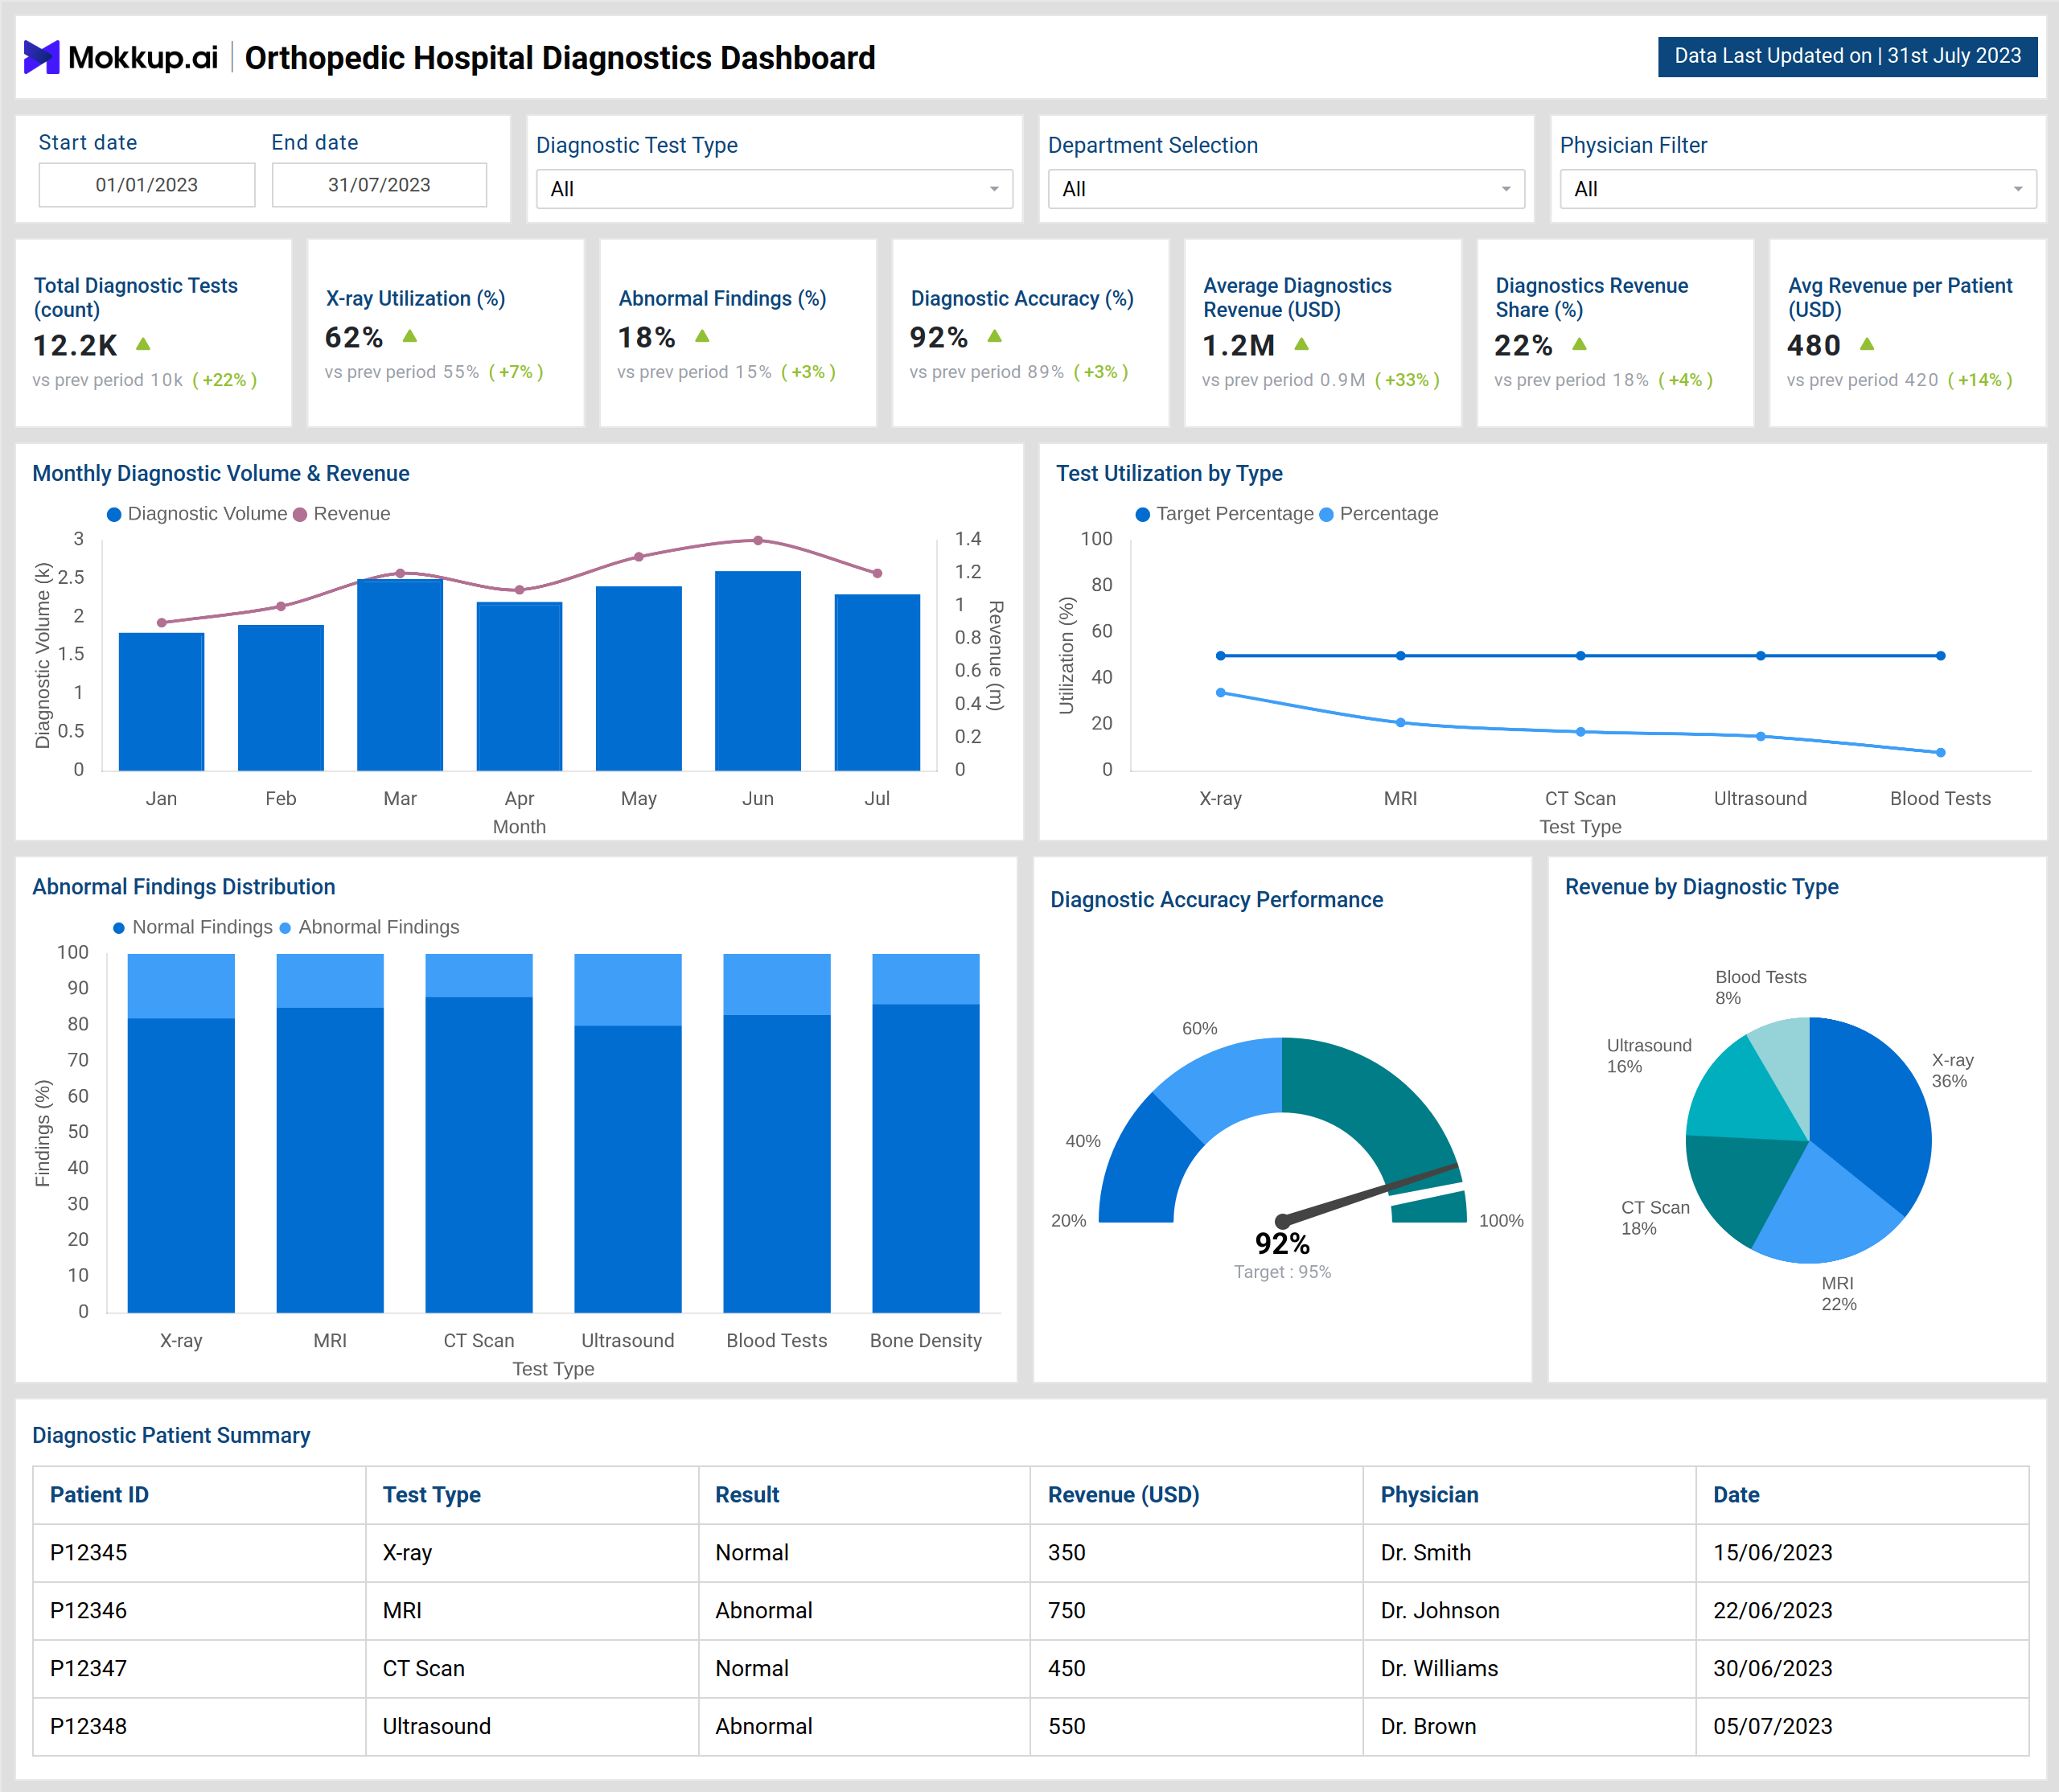
The example dashboard highlights key performance indicators for diagnostic operations in orthopedic hospitals. It tracks total diagnostic tests, abnormal findings, diagnostic accuracy, and revenue share, alongside average revenue per patient.
Visuals such as diagnostic volume and revenue trends, utilization by test type, and abnormal findings distribution provide insights into performance. Accuracy gauges help hospitals assess whether diagnostic processes meet required standards. Pie charts showing revenue by diagnostic type and abnormal findings by test type give a clear breakdown of operational and clinical effectiveness.
The diagnostic patient summary table adds further granularity by displaying individual patient test data, results, revenue contribution, and physician accountability. This level of detail allows administrators to analyze both high-level performance and individual case outcomes.
Together, this dashboard functions as a performance and diagnostic quality tracking dashboard, ensuring hospitals maintain both efficiency and accuracy.
How to Analyze Data in Orthopedic Hospital Diagnostics Dashboards
Orthopedic hospitals can leverage a diagnostics dashboards to track and optimize testing, accuracy, and revenue performance:
- Track Test Utilization: Measure usage rates of X-ray, MRI, CT scan, and other tests against targets.
- Monitor Diagnostic Accuracy: Use the accuracy performance gauge to evaluate test reliability.
- Analyze Abnormal Findings: Identify which test types report higher abnormal findings for targeted interventions.
- Review Revenue Contribution: Track revenue share by test type to balance financial performance with clinical demand.
- Audit Patient-Level Data: Use detailed diagnostic records to improve accountability and follow-up care.
Benefits of Orthopedic Hospital Diagnostics Dashboards
By centralizing diagnostic and financial data, these dashboards help hospitals improve patient care, optimize operations, and drive informed decisions:
- Improved Diagnostic Accuracy: Reduces errors and improves patient treatment outcomes.
- Operational Efficiency: The orthopedic hospital diagnostics dashboard template highlights test utilization and performance gaps.
- Revenue Optimization: Tracks financial contribution from different diagnostic tests.
- Enhanced Patient Safety: Real-time monitoring of abnormal findings ensures timely medical intervention.
- Data Transparency: Combines test, physician, and revenue data for holistic reporting.
KPIs to Track in Orthopedic Hospital Diagnostics Dashboards
Tracking key performance indicators helps hospitals measure diagnostic efficiency, financial impact, and patient safety in a structured way.
- Total Diagnostic Tests (count): Measures testing activity across the hospital.
- Abnormal Findings (%): Tracks cases requiring medical follow-up.
- Diagnostic Accuracy (%): Evaluates the reliability of diagnostic results.
- Diagnostics Revenue Share (%): Shows revenue contribution of different test types.
- Average Revenue per Patient (USD): Provides financial efficiency insights per patient.
Frequently Asked Questions
Q1. Why is an Orthopedic Hospital Diagnostics Dashboard important?
It provides real-time visibility into test accuracy, utilization, and financial performance, ensuring better patient care and operational efficiency.
Q2. How does it support administrators and physicians?
It offers both high-level performance tracking and detailed patient test summaries, helping improve accountability and decision-making.
Q3. Can the dashboard help identify trends over time?
Yes, it allows hospitals to track diagnostic usage, accuracy, and revenue trends over days, weeks, or months, helping in resource planning and strategic decision-making.