What is an Orthopedic Hospital Patient Experience & Quality Dashboard?
An Orthopedic Hospital Patient Experience & Quality Dashboard is a centralized tool designed for hospital leadership and clinical teams to monitor overall performance in real time, including surgeons, nursing managers, and quality & patient safety teams. It provides visibility into patient volumes, elective vs. emergency admissions, surgeries performed, surgical success rates, readmission and complication rates, length of stay, post-surgical recovery outcomes, infection rates, and patient satisfaction.
Unlike static reports, this dashboard acts as a real-time orthopedic hospital performance dashboard, helping institutions track clinical outcomes, operational efficiency, and patient experience in one place.
How to Create an Orthopedic Hospital Patient Experience & Quality Dashboard
You don’t need to build your report from scratch—just start with a ready-to-use Orthopedic Hospital Patient Experience & Quality Dashboard template from Mokkup. Add in your data and export it however you like. Here’s how to do it:
1. Create or Log in to Your Mokkup Account
Start by signing up on Mokkup using your email. If you already have an account, just log in, and you’ll be ready to go.
2. Choose and Customize Your Dashboard Template
Find the Patient experience & quality dashboard template for Orthopedic hospitals in the Templates section. Use the drag-and-drop editor to adjust KPIs, edit filters, or add elements based on your hospital’s data.
3. Export to Your BI Tool
Once your dashboard wireframe is ready, use the BI Tool Export feature to send it directly to Power BI or Tableau for further analysis and enhancements. You can also download the dashboard as a PDF, PNG, or JPEG, embed it on a platform, or invite your team to collaborate.
Note: This is a Pro template. You’ll need a Pro subscription on Mokkup to use and customize this dashboard wireframe. Upgrade anytime to unlock full access.
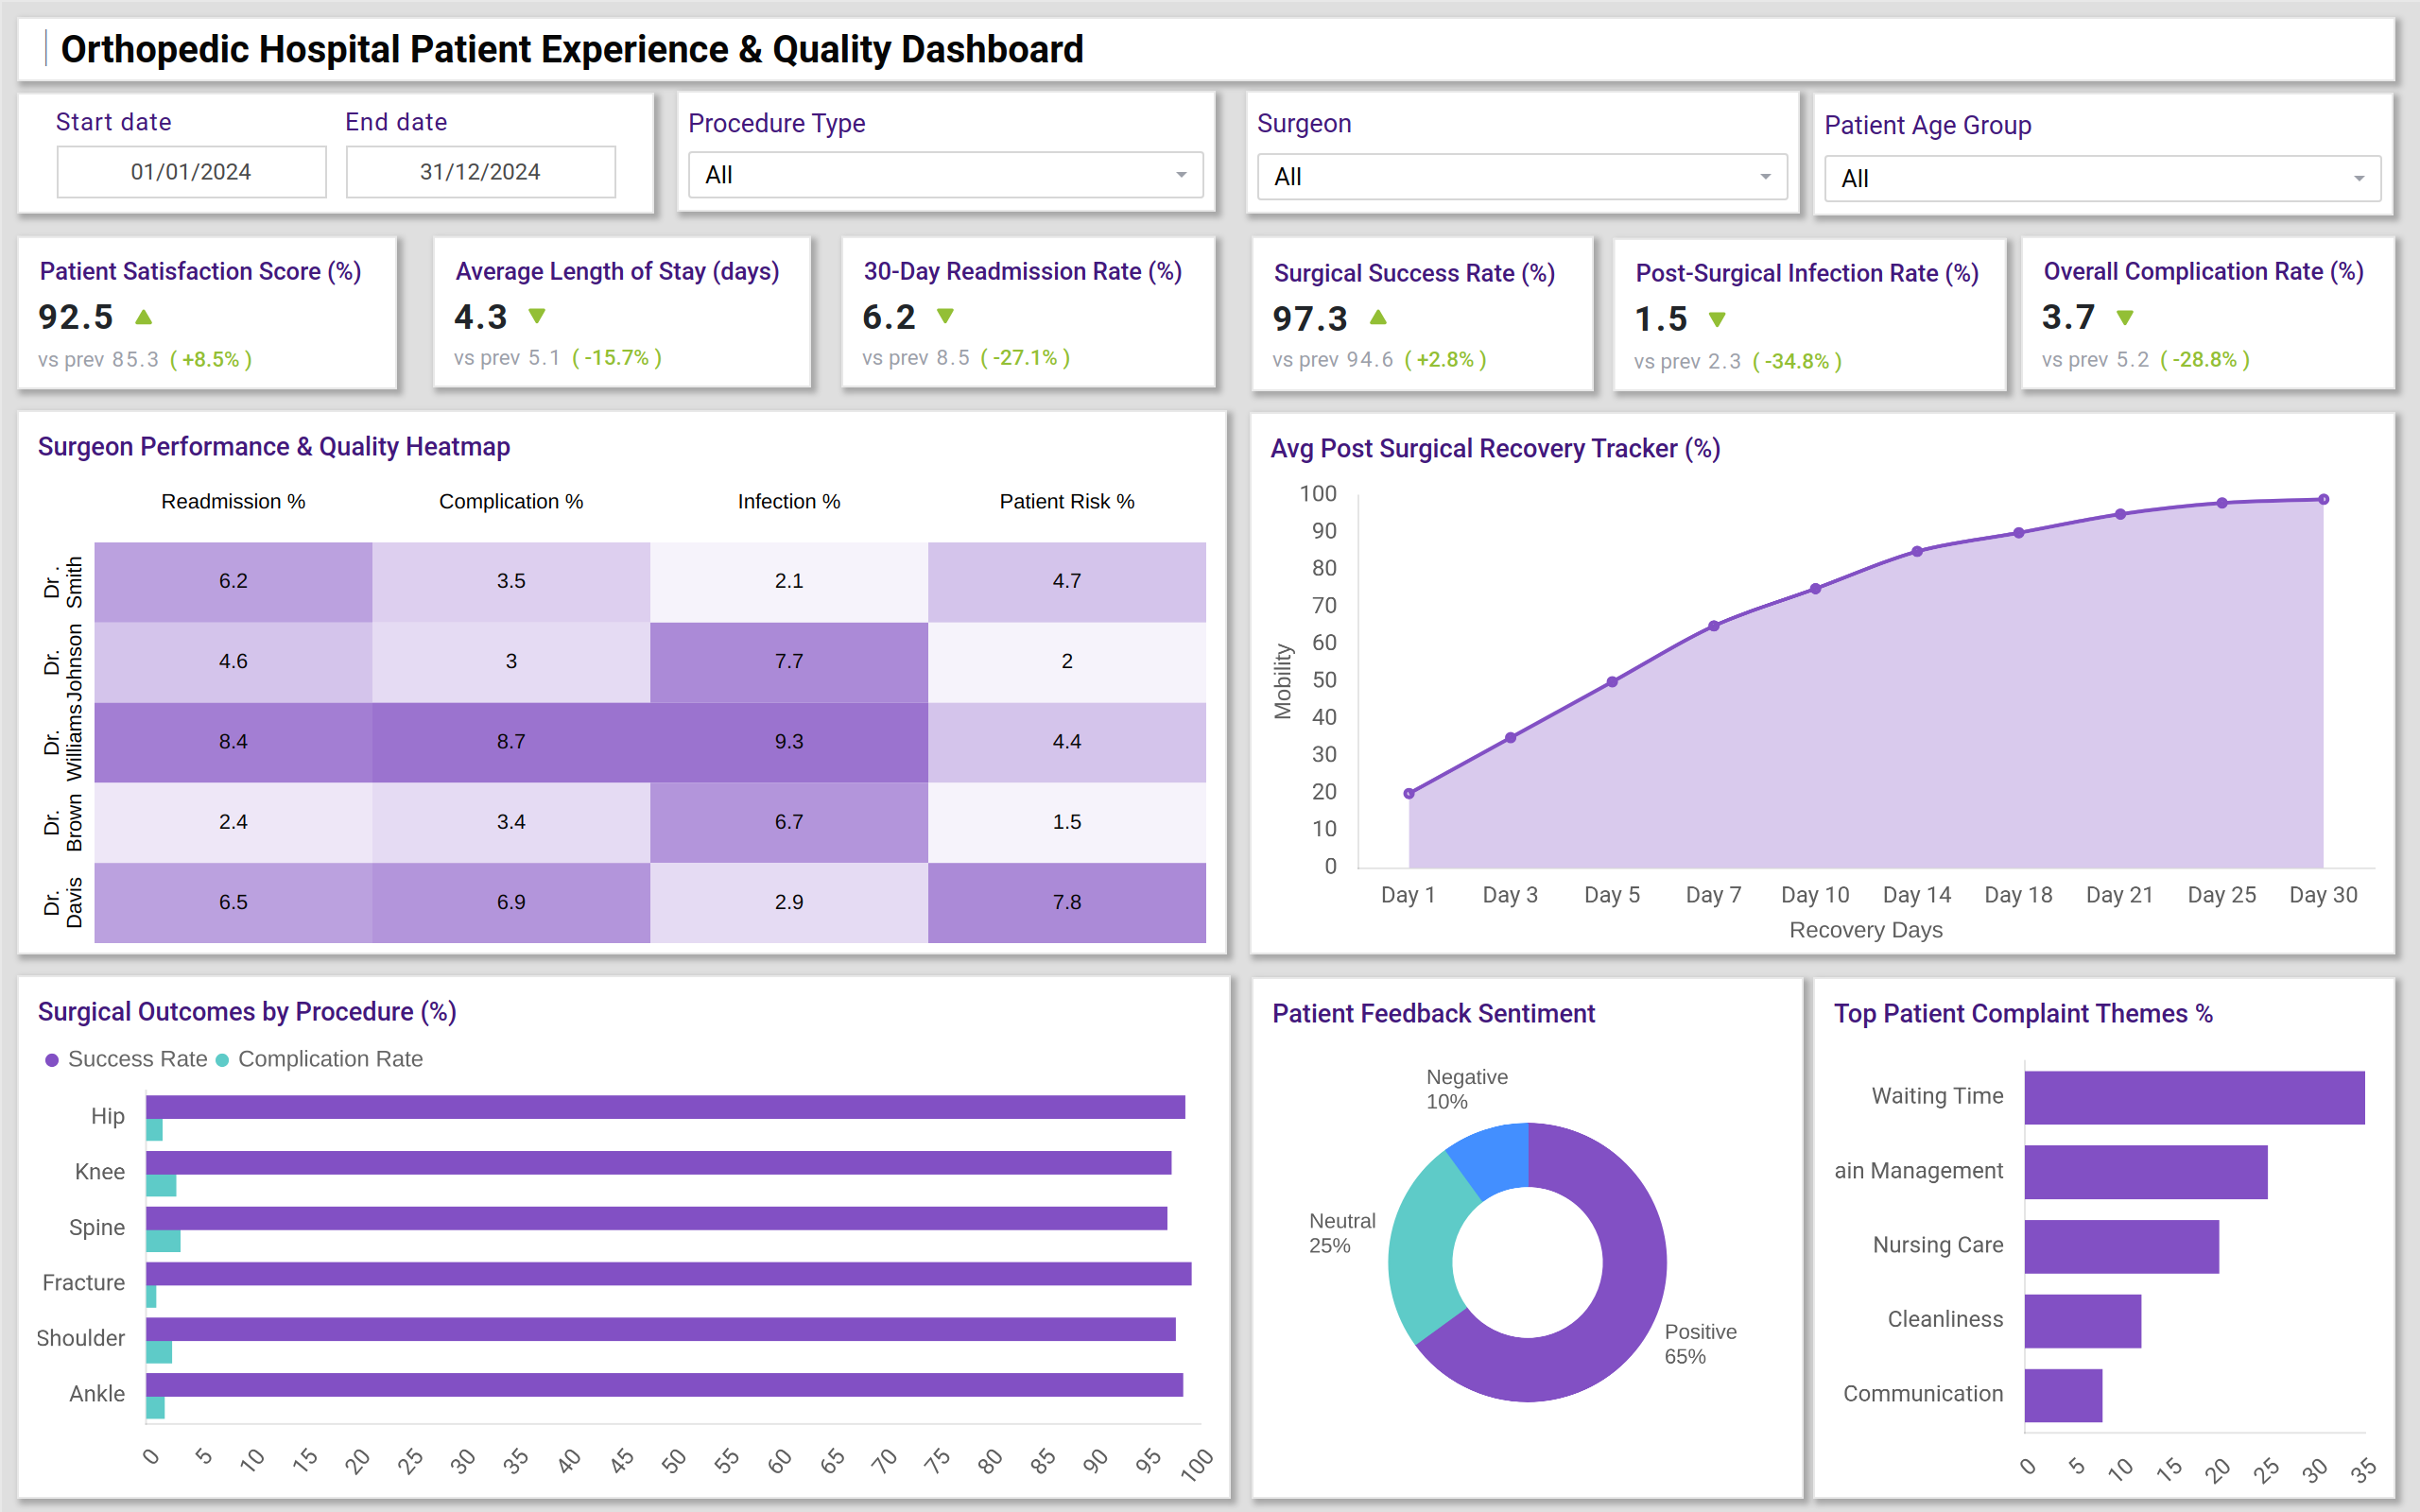
Orthopedic Hospital Patient Experience & Quality Dashboard Example
You can create this dashboard with a mix of KPI cards and visualizations. At the top, KPI cards track key metrics such as patient satisfaction score, surgical success rate, readmission rate, average length of stay, post-surgical infection rate, and complication rate. Below the KPI cards, charts that show trends in surgical outcomes by procedure, readmission, and complication heatmaps, recovery tracker trends, patient feedback sentiment, and top complaint themes can come. Line and bar charts help monitor infection rates and length of stay distributions.
Together, this dashboard works as a comprehensive Orthopedic surgical outcomes dashboard, ensuring clinical teams and quality & patient safety managers get both outcome and operational visibility.
How to Analyze Data in Orthopedic Hospital Patient Experience & Quality Dashboards
Here’s how hospitals can make the most of the data available on this dashboard:
- Track patient activity: Use line charts and bar charts to compare elective vs. emergency admissions and surgery trends over time.
- Monitor surgical quality: Analyze surgical success, complication rates, and readmissions across procedures or surgeons.
- Evaluate recovery outcomes: Track post-surgical mobility, pain reduction, and length of stay trends to improve rehabilitation.
- Assess patient experience: Monitor satisfaction scores and complaint categories for actionable insights.
- Ensure patient safety: Use a clinical quality and patient safety dashboard to analyze infection rates and complication metrics, and maintain high standards.
- Compare departments/teams: Use heatmaps to evaluate outcomes by surgical department or surgeon.
Benefits of Orthopedic Hospital Patient Experience & Quality Dashboards
- Improved visibility: Real-time KPIs across patient orthopedic care, quality, and operational metrics.
- Operational efficiency: Track recovery trends for resource planning.
- Clinical performance tracking: Monitor surgical success, readmissions, complications, and infection rates.
- Enhanced patient experience: Track satisfaction scores and complaints to improve care delivery.
- Evidence-based interventions: Recovery and complication metrics help prioritize interventions or policy changes.
- Compliance & reporting: Supports audits, quality reviews, and patient safety reporting.
Together, these elements provide clinical teams and quality managers with actionable insights, making it easier to align operations, patient outcomes, and safety standards. That’s why many healthcare leaders call it the best orthopedic hospital dashboard for institutions focused on patient experience and quality care.
KPIs to Track in Orthopedic Hospital Patient Experience & Quality Dashboards
- Patient Satisfaction Score (avg %) – Overall satisfaction with care.
- Surgical Success Rate (%) – Surgeries without complications or revisions.
- Readmission Rate (30-day, %) – Patients readmitted within 30 days post-surgery.
- Average Length of Stay (days) – Duration of inpatient stay.
- Post-Surgical Infection Rate (%) – Hospital-acquired infection frequency.
- Complication Rate (%) – Patients experiencing post-surgery complications.
Frequently Asked Questions
1. Who should use this dashboard?
Clinical teams, orthopedic surgeons, nursing managers, and quality & patient safety teams responsible for monitoring patient care and outcomes should use an Orthopedic hospital patient experience and quality dashboard.
2. Can this dashboard help improve surgical outcomes?
Yes. Teams can identify trends in complications, readmissions, and infection rates to implement improvements.
3. How does it support patient experience?
It combines patient satisfaction with clinical outcomes to provide a holistic view of care quality.