What is an Orthopedic Care Insights Dashboard?
The Orthopedic Dashboard template offers healthcare administrators and decision-makers an overview of treatment performance and financial details to improve the quality of services. This bone health KPI dashboard enables key insights into daily hospital operations, such as bed occupancy rates and rehospitalization trends, that contribute to streamlining operations and improving patient outcomes.
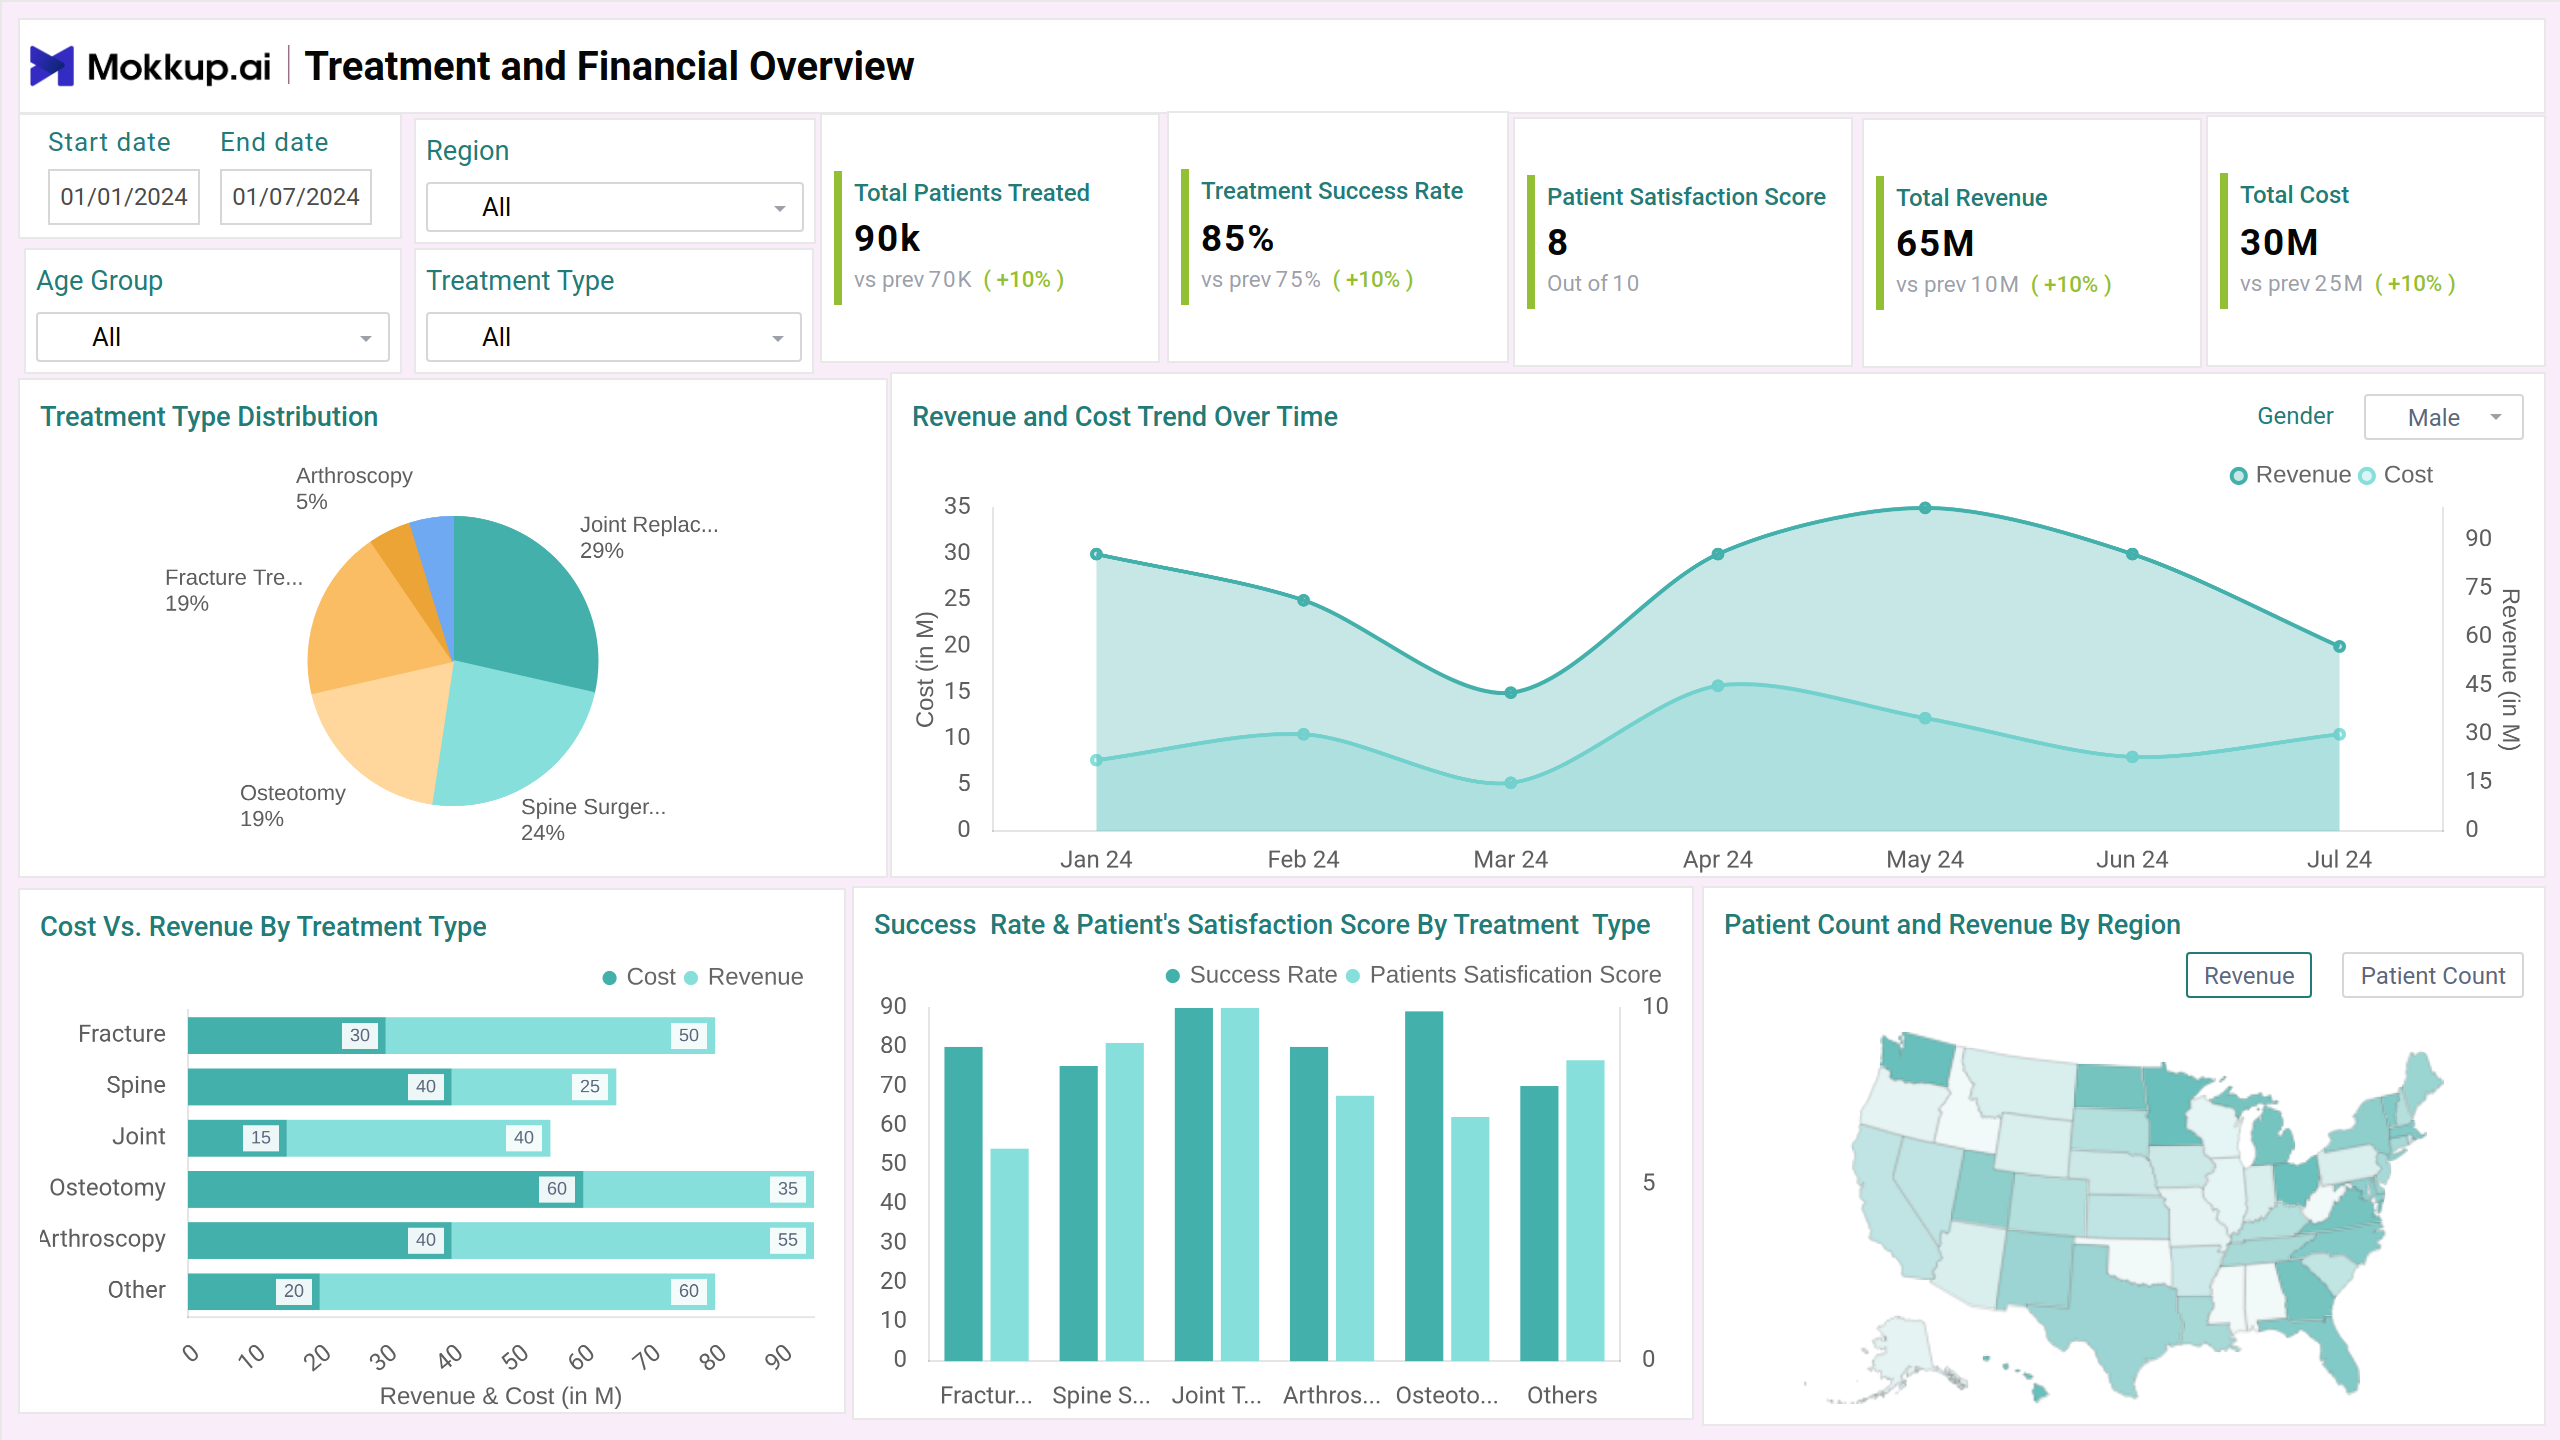
Orthopedic Dashboard Example
This dashboard can be used as a Musculoskeletal treatment tracker, combining critical treatment, financial, and operational metrics into an easy-to-understand interface. The orthopedic care performance dashboard has an intuitive navigation and dynamic filters for region, treatment type, and age group for drilling down to specific target segments. It features clear visuals like bar charts for surgical trends, pie charts for procedure distribution, and KPIs for critical indicators such as recovery time, readmission rates, and patient satisfaction.
How to Analyze Data in Orthopedic Dashboards
Analyzing data in this dashboard involves evaluating the critical KPIs that reflect clinical outcomes. Mokkup.ai orthopedic dashboard typically uses line charts to show trends in recovery or surgery volumes, bar charts for comparing procedure success rates across departments or surgeons, pie charts for treatment distribution, and tables with conditional formatting to highlight high-risk or delayed recovery cases. This dashboard wireframe involves two screens, including treatment and financial overview, and operational insights & efficiency, providing a holistic view of the orthopedic department.
How to Create an Orthopedic Dashboard
You don’t need to build your Physical therapy progress monitor dashboard from scratch. Use Mokkup’s orthopedic dashboard template to speed up your setup. Add your data and export it in your preferred format. Here's how to get started:
1. Create or Log in to Your Mokkup Account
To access the dashboard templates, sign up on Mokkup.ai using your email. If you already have an account, just log in and use it right away.
2. Choose and Customize Your Dashboard
Head to the Templates section and select the orthopedic care insights dashboard. Use the drag-and-drop editor to modify metrics, apply demographic filters, or add elements to adjust filters for better reporting.
3. Export to Your BI Tool
Once your dashboard is set, use the BI Tool Export feature to move it to Power BI or Tableau for deeper insights. You can also download it as a PDF, PNG, or JPEG, embed it where needed, or share it with your team for enhanced collaboration.
Note: This is a Pro template. A Mokkup Pro subscription is required to use and customize this dashboard. Upgrade anytime to unlock full access.
Benefits of Orthopedic Insights Dashboards
The orthopedic care dashboard shows a consolidated view of major hospital operations in which clinicians can perform joint replacement outcome analytics and track the revenues of the treatments. Here are some essential benefits of using this dashboard:
- Clinicians can get the real-time information that helps them make timely decisions.
- By tracking KPIs such as treatment success rates and rehospitalization rates, clinicians can quickly identify trends in recovery patterns.
- It can aid in proactive staff utilization by visualizing operating room usage and equipment bottlenecks.
- Consistent positive treatment outcomes ensure patient satisfaction and engagement.
KPIs to Track in Orthopedic Dashboards
This dashboard can be viewed as a surgical recovery tracking tool wherein you can view operational data and do healthcare payment analysis with key metrics. Here are some metrics that are crucial to look at:
- Total Patients Treated: Tracks the total number of patients treated, offering an overall view of service volume.
- Treatment Success Rate: Measures the percentage of successful treatments, indicating clinical effectiveness.
- Patient Satisfaction Score: Captures feedback on patient experience to assess service quality.
- Treatment Type Distribution: Visualizes the proportion of treatments provided across different categories, offering insights into service focus and diversity.
- Bed Occupancy Rate: The percentage of available beds that patients occupy over a given time period.
Frequently Asked Questions
1. Who uses an Orthopedic Dashboard?
The dashboard benefits orthopedic surgeons, hospital administrators, care coordinators, financial planners, and operations managers by allowing them to monitor performance, improve care delivery, and optimize workflows.
2. Can the dashboard help reduce operational costs?
Yes. Administrators can find opportunities to reduce waste, optimize staffing, and ensure cost-effective care delivery by analyzing procedure costs, surgical efficiency, and resource utilization.