What is an Orthopedic Hospital Finance Dashboard?
An Orthopedic Hospital Finance Dashboard is a financial analytics platform that helps orthopedic hospitals and institutions monitor revenue, expenses, and profitability in real time. It integrates hospital accounting, billing, and surgical data into one interface, making it easier to understand the financial health of orthopedic departments.
The orthopedic healthcare financial analytics dashboard template allows finance teams to identify trends, compare revenue sources, and track operating efficiency. This dashboard wireframe supports better decision-making across inpatient and outpatient services by combining operational metrics with financial outcomes. It enables administrators to manage budgets, evaluate costs, and ensure the financial sustainability of orthopedic healthcare organizations.
How to Create an Orthopedic Hospital Finance Dashboard
You don’t need to build your report from scratch—just start with a ready-to-use Orthopedic Hospital Finance dashboard template from Mokkup. Add in your data and export it however you like. Here’s how to do it:
1. Create or Log in to Your Mokkup Account
Start by signing up on Mokkup.ai using your email. If you already have an account, just log in, and you’ll be good to go.
2. Choose and Customize Your Dashboard Template
Find the Orthopedic Hospital Finance Dashboard template in the Templates section. Use the drag-and-drop editor to adjust KPIs, edit filters, or add elements based on your data.
3. Export to Your BI Tool
Once your dashboard wireframe is ready, use the BI Tool Export feature to send it directly to Power BI or Tableau for further analysis and enhancements. You can also download the dashboard as a PDF, PNG, or JPEG, embed it on a platform, or invite your team to collaborate.
Note: This is a Pro template. You’ll need a Pro subscription on Mokkup to use and customize this dashboard wireframe. Upgrade anytime to unlock full access.
Orthopedic Hospital Finance Dashboard Example
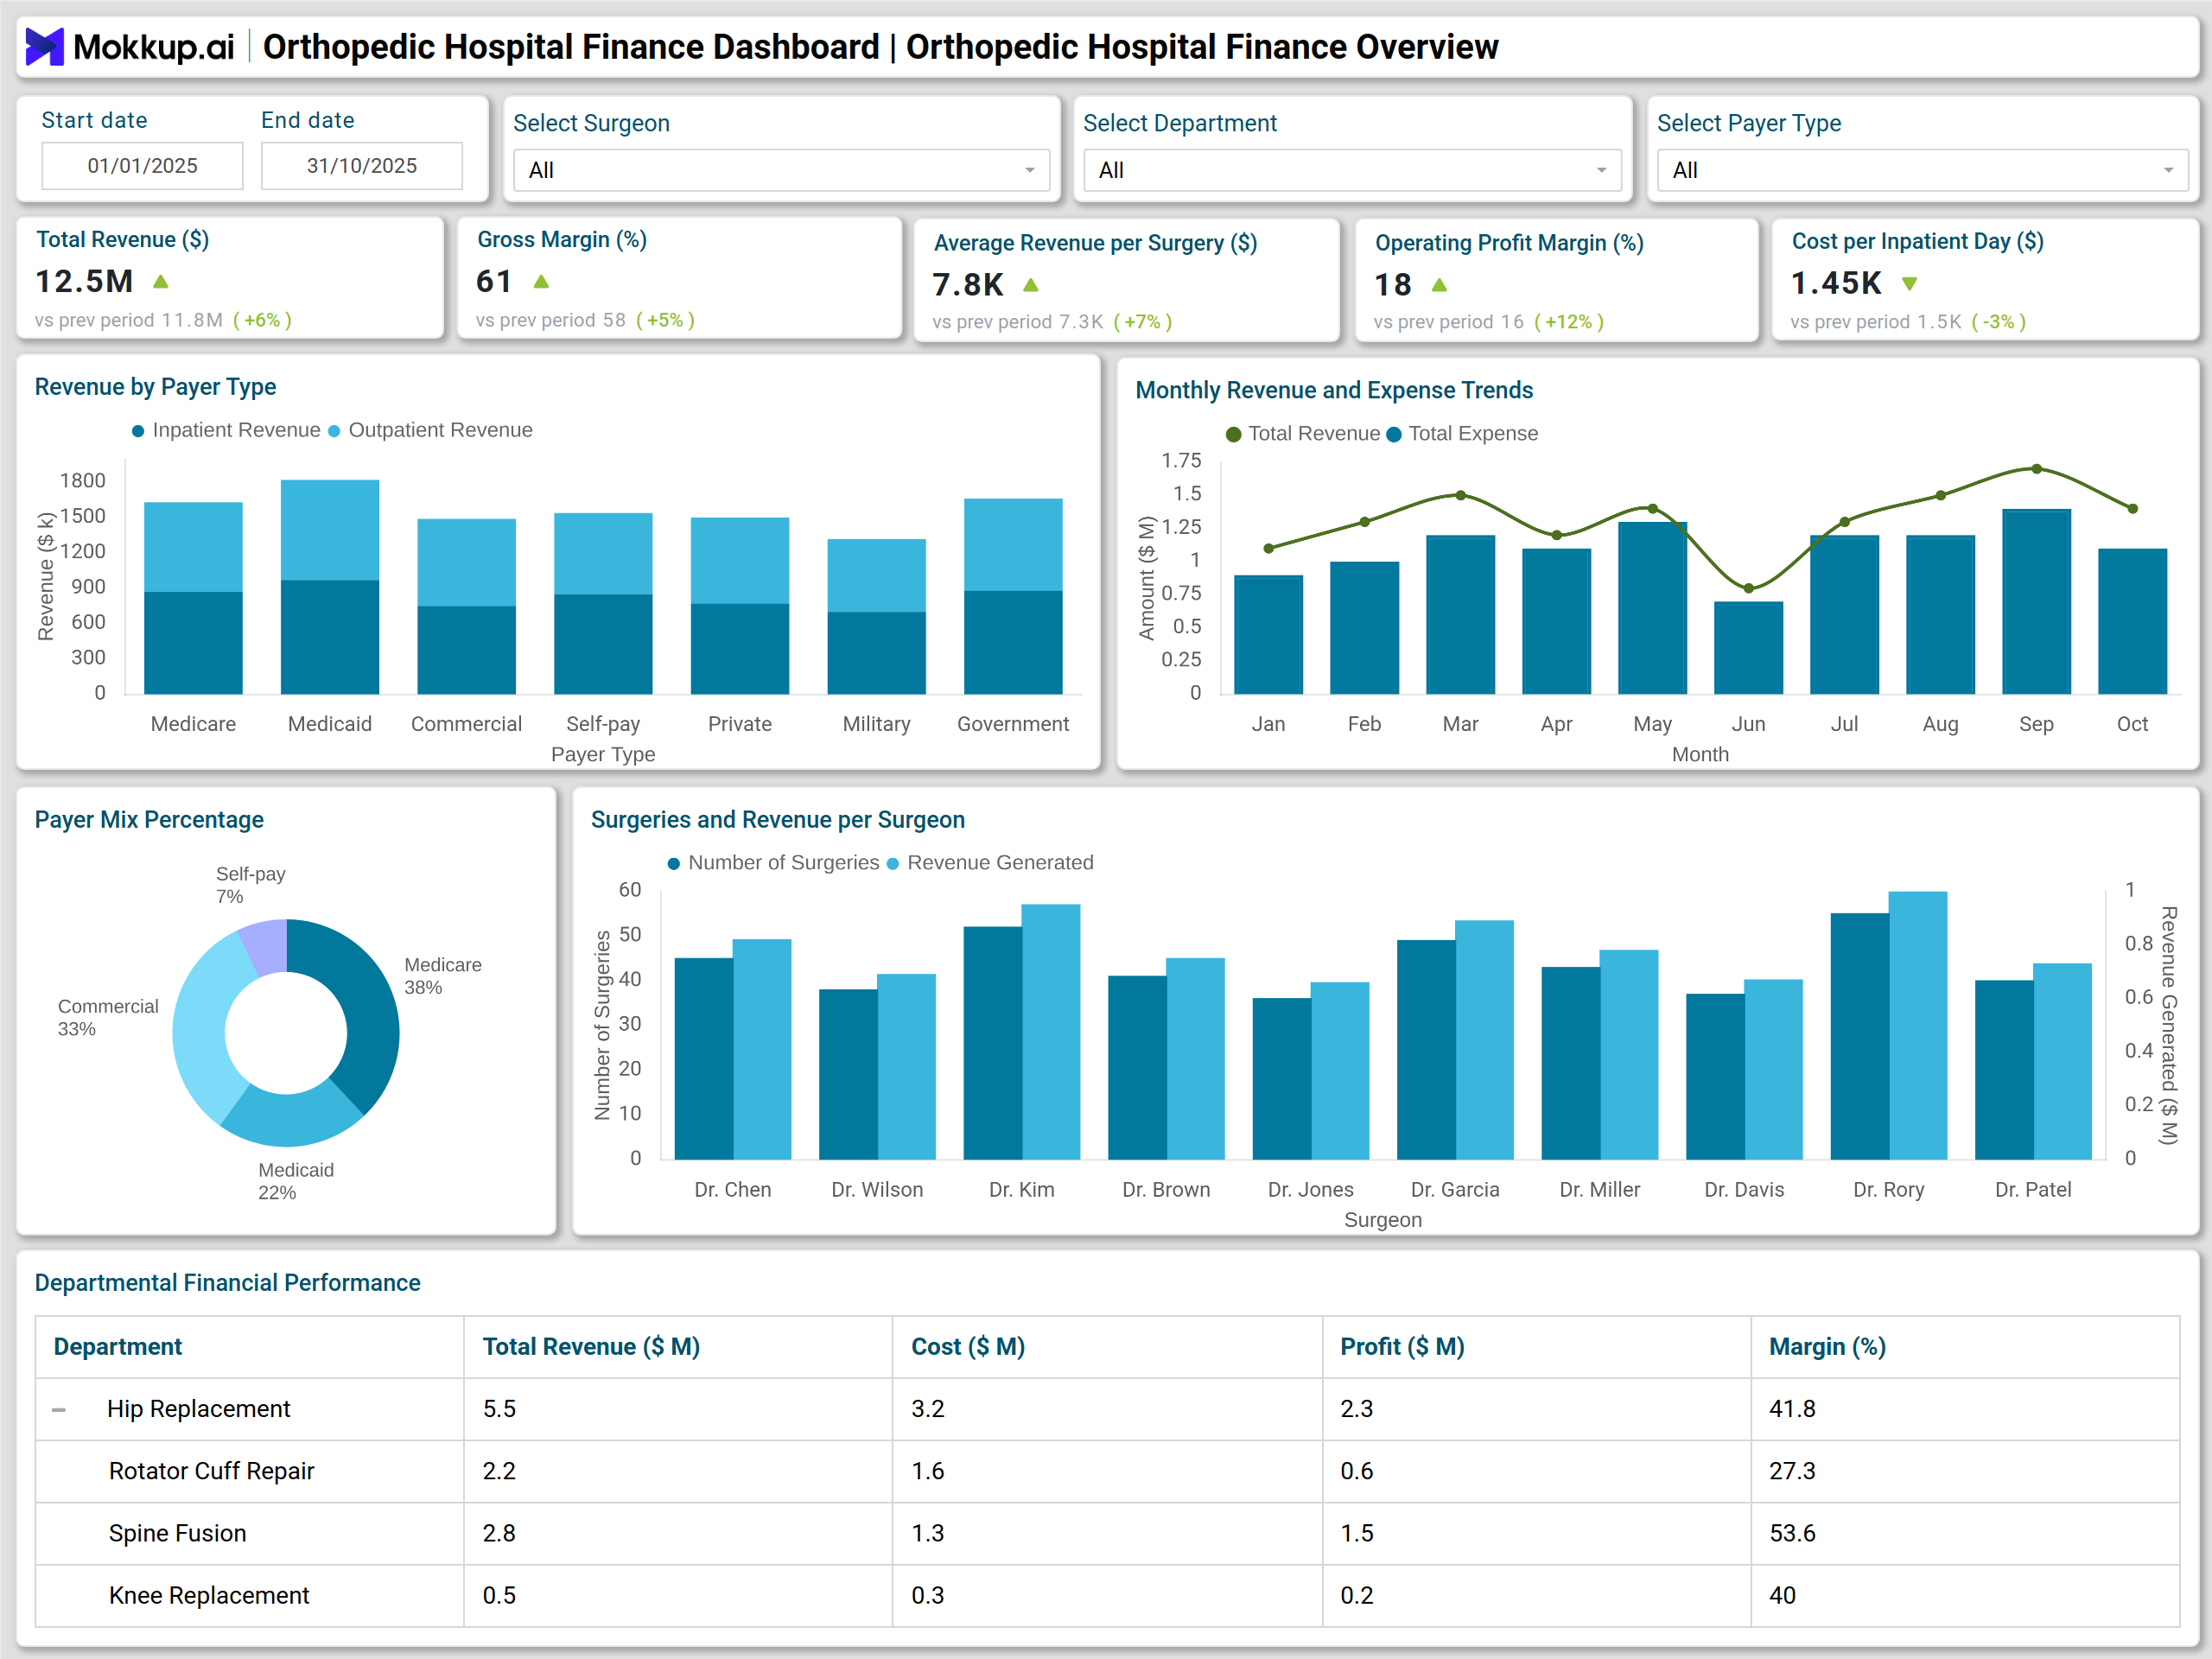
A comprehensive orthopedic institution revenue dashboard displays both high-level and granular insights. For instance, a stacked column chart can show revenue by payer type (inpatient vs. outpatient), while a multiple line chart compares monthly revenue and expenses to highlight fluctuations in profitability. A donut chart can visualize payer mix percentages, and bar charts can compare surgeries and revenue per surgeon to assess individual performance.
Tables present detailed departmental breakdowns, while waterfall charts illustrate profit per case. Advanced visuals like combo charts (surgeries vs. average cost), heatmaps (profitability by surgeon and procedure type), funnel charts (patient financial flow), and treemaps (expense distribution by category) provide multidimensional insights into financial performance. This approach transforms raw hospital data into actionable insights through financial performance metrics for orthopedic hospitals, helping leaders focus on revenue growth and operational efficiency.
How to Analyze Data in Orthopedic Hospital Finance Dashboards
Orthopedic hospitals handle complex financial data involving surgeries, implants, and care costs. A finance dashboard helps convert these numbers into insights for better budgeting, resource allocation, and profitability tracking. Here’s how to analyze the data effectively:
- Evaluate Procedure Profitability: Use orthopedic care cost and revenue tracking to assess the profitability of inpatient vs. outpatient procedures.
- Identify Cost Trends: Compare monthly revenue and expense trends to spot high-cost periods or services.
- Improve Margins: Review the orthopedic finance KPI dashboard to understand where operational or financial margins can be enhanced.
- Analyze Department Performance: Examine department-level data to identify top revenue-contributing areas.
- Assess Surgeon Profitability: Track surgeon-specific revenue and profitability to guide compensation or resource allocation.
- Control Supply Costs: Evaluate implant and device spending to uncover cost-saving opportunities.
- Optimize Utilization: Monitor occupancy rates, average length of stay, and OR turnover time to improve efficiency.
Benefits of Orthopedic Hospital Finance Dashboards
An orthopedic hospital finance dashboard offers a comprehensive view of financial performance, helping hospitals streamline operations and make informed business decisions.
- Unified Financial Overview: Consolidates all orthopedic financial and operational data in one place.
- Data-Driven Decisions: Supports decision-making with detailed financial analytics.
- Better Cost Control: Provides visibility into department-level spending for improved cost management.
- Accurate Forecasting: Enhances financial planning with precise revenue and expense data.
- Profitability Insights: Enables surgeons and administrators to monitor profitability per case and procedure.
- Efficiency Gains: Reduces manual reporting and ensures accuracy across financial systems.
- Simplified Visualization: Makes complex financial metrics easy to understand through clear visuals and intuitive dashboards.
KPIs to Track in Orthopedic Hospital Finance Dashboards
To get the most value from your hospital finance KPI dashboard for orthopedics, these KPIs are critical:
- Total Revenue: Total income generated from inpatient, outpatient, and surgical services.
- Gross Margin Percentage: Measures profitability before operational costs.
- Average Revenue per Surgery: Helps assess income from orthopedic procedures.
- Operating Profit Margin: Evaluates efficiency in converting revenue into profit.
- Bed Occupancy Rate: Monitors hospital bed utilization and patient flow.
- Cost per Inpatient Day: Tracks daily costs to maintain profitability.
- Profit per Case: Determines net earnings for each surgical procedure.
Monitoring these KPIs enables precise orthopedic care cost and revenue tracking, improving financial transparency and accountability across departments.
Frequently Asked Questions
Q1. What is the main purpose of an Orthopedic Hospital Finance Dashboard?
It provides an at-a-glance view of hospital financial health, combining revenue, expenses, and profitability data through orthopedic healthcare financial analytics.
Q2. Who should use an orthopedic institution revenue dashboard?
Finance teams, administrators, and department heads in orthopedic hospitals can use it to monitor revenue, control expenses, and optimize operations.
Q3. How does the dashboard improve cost control?
The dashboard enables data-driven orthopedic care cost and revenue tracking by highlighting expense drivers such as implant spend, inpatient day costs, and length of stay.
Q4. What kind of visuals work best for orthopedic financial analysis?
Stacked column charts, line graphs, tables, waterfall charts, combo charts, and treemaps are ideal for presenting complex financial performance metrics for orthopedic hospitals.