What is an Orthopedic Hospital Clinical Performance Dashboard?
An Orthopedic Hospital Clinical Performance Dashboard is a healthcare management tool that helps hospitals monitor patient outcomes, surgical performance, rehabilitation progress, and overall care quality. It integrates patient demographics, surgical data, readmission rates, and rehabilitation compliance into a single platform.
The orthopedic hospital clinical performance dashboard template provides a complete view of surgical efficiency, operating theater (OT) utilization, complication rates, and recovery outcomes. As a real-time orthopedic care monitoring dashboard, it supports evidence-based decision-making, improves resource utilization, and enhances patient care standards.
How To Create an Orthopedic Hospital Clinical Performance Dashboard
You don’t need to build your report from scratch—just start with a ready-to-use sample orthopedic hospital clinical performance dashboard template from Mokkup. Add in your data and export it however you like.
Here’s how to do it:
1. Create or Log in to Your Mokkup Account
Start by signing up on Mokkup.ai using your email. If you already have an account, just log in, and you’ll be good to go.
2. Choose and Customize Your Dashboard Template
You can find the Orthopedic Hospital Clinical Performance Dashboard template in the Templates section. Use the drag-and-drop editor to adjust KPIs, edit filters, or add elements based on your data.
3. Export to Your BI Tool
Once your dashboard wireframe is ready, use the BI Tool Export feature to send it directly to Power BI or Tableau for further analysis and enhancements. You can also download the dashboard as a PDF, PNG, or JPEG, embed it on a platform, or invite your team to collaborate.
Note: This is a Pro template. You’ll need a Pro subscription on Mokkup to use and customize this dashboard wireframe. Upgrade anytime to unlock full access.
Orthopedic Hospital Clinical Performance Dashboard Example
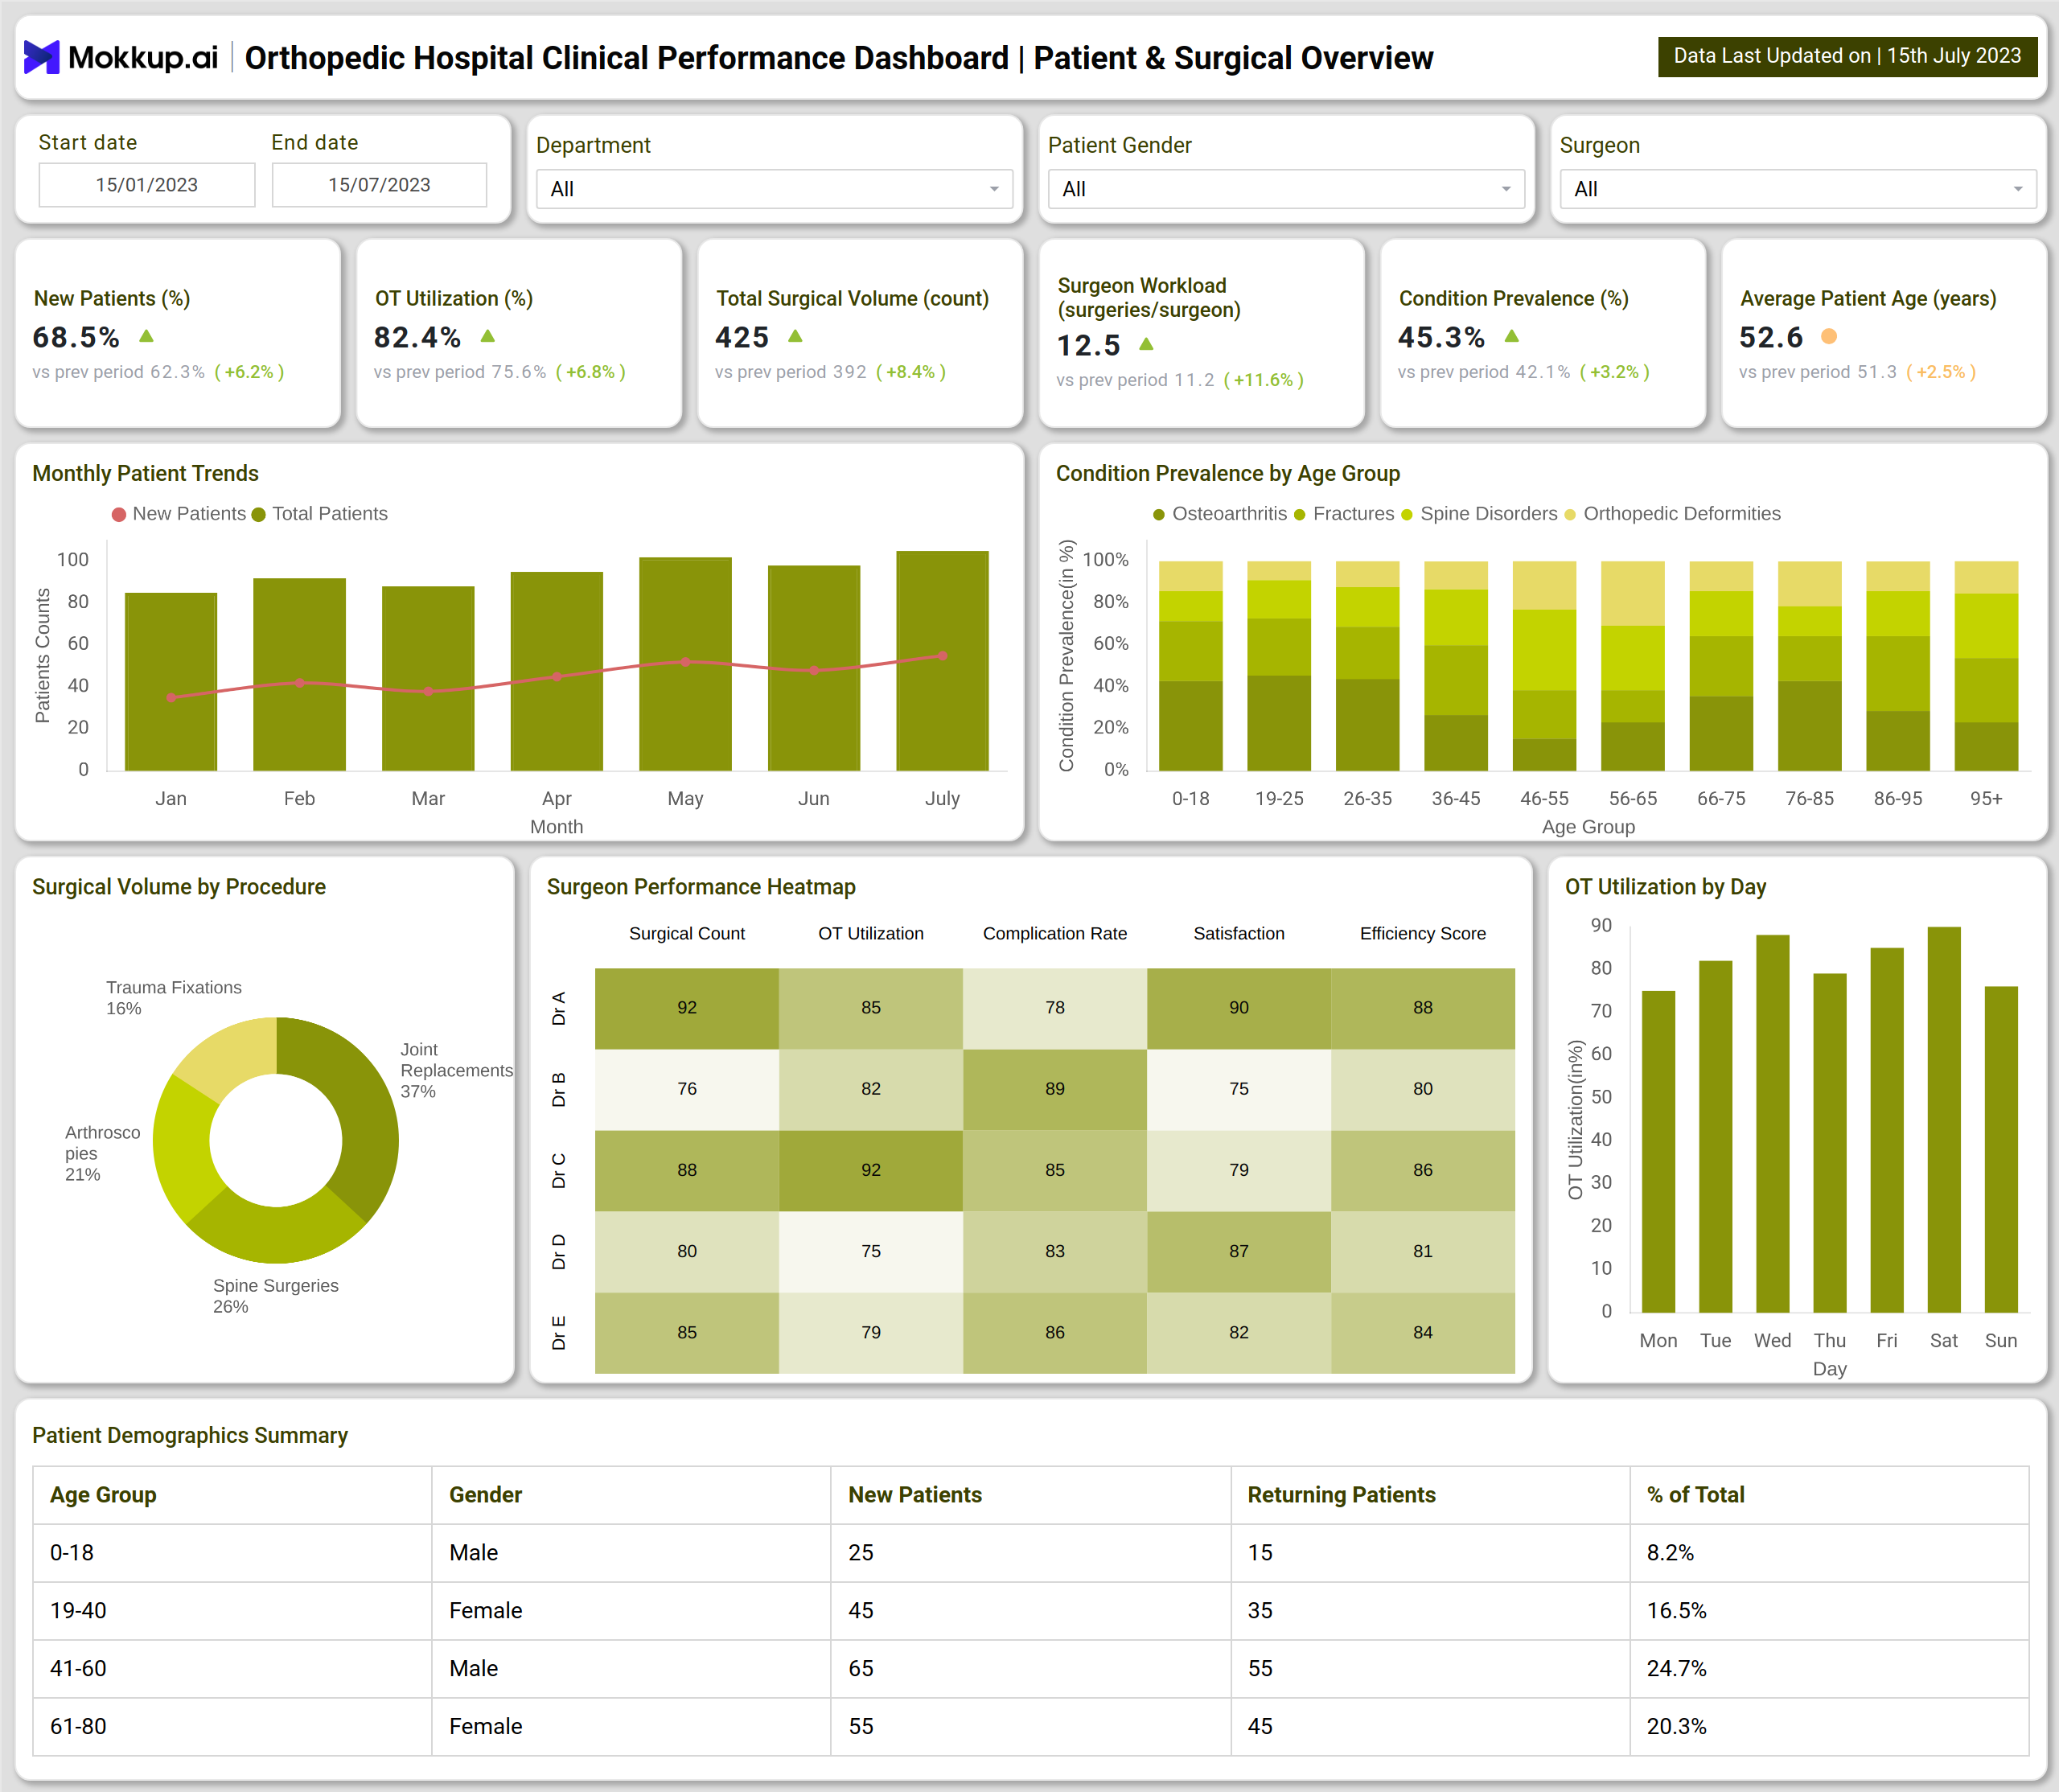
The example dashboard is divided into two main sections: Patient & Surgical Overview and Outcomes & Rehabilitation.
The Patient & Surgical Overview Dashboard focuses on hospital metrics like surgical efficiency and patient demographics. Key KPIs include new vs. returning patients, OT utilization, total surgical volume, surgeon workload, and condition prevalence. Visuals such as surgical volume by procedure, condition prevalence by age group, and OT utilization trends highlight the hospital’s operational strengths. Heatmaps track surgeon performance in terms of surgical count, complication rates, satisfaction, and efficiency scores, while patient demographics tables provide insights into age and gender-based distribution of cases.
The Outcomes & Rehabilitation Dashboard emphasizes patient recovery and post-surgical performance. It tracks complication rates, revision surgeries, readmission rates, pain score improvements, and functional outcomes. Charts compare mobility improvement and quality-of-life scores, while funnels map the rehabilitation patient journey from assessment to full recovery. Additional visuals, such as complication distribution, revision surgeries by surgeon, and readmission analysis, provide granular insights into recovery challenges and areas needing intervention.
Together, these dashboards create a performance and outcomes tracking dashboard, helping orthopedic hospitals balance clinical excellence with operational efficiency.
How to Analyze Data in Orthopedic Hospital Clinical Performance Dashboards
- Track Surgical Efficiency – Monitor OT utilization, surgical counts, and complication rates for performance benchmarking.
- Evaluate Patient Demographics – Identify patterns in age, gender, and condition prevalence for targeted treatments.
- Analyze Recovery Outcomes – Compare pain scores, mobility improvements, and rehabilitation compliance rates.
- Monitor Readmissions – Use readmission analysis to uncover recurring issues in procedures or complications.
- Review Surgeon Performance – Use heatmaps and revision surgery data to identify high and low performers.
Benefits of Orthopedic Hospital Clinical Performance Dashboards
- Enhanced Surgical Efficiency – Optimizes OT utilization and surgeon workload distribution.
- Improved Patient Outcomes – The orthopedic hospital clinical performance dashboard template links surgical results with rehabilitation success.
- Proactive Risk Management – Identifies complications and readmission risks early for better intervention.
- Data-Driven Decision Making – Supports hospital administrators with real-time orthopedic care monitoring dashboard insights.
- Patient-Centered Care – Ensures recovery journeys are tracked for continuous improvement in treatment.
KPIs to Track in Orthopedic Hospital Clinical Performance Dashboards
- OT Utilization (%) – Measures efficiency in operating theater use.
- Condition Prevalence (%) – Tracks orthopedic cases across different age groups.
- Complication Rate (%) – Evaluates risks and post-surgical complications.
- Readmission Rate (%) – Indicates quality of surgical outcomes and recovery management.
- Rehabilitation Compliance (%) – Tracks adherence to rehabilitation programs for better recovery results.
Frequently Asked Questions
1. Why is an Orthopedic Hospital Clinical Performance Dashboard important?
It provides hospitals with real-time insights into surgical efficiency, patient recovery, and overall care quality, enabling better performance management.
2. What key KPIs should be included in an Orthopedic Hospital Clinical Performance Dashboard?
Some essential metrics include OT utilization, complication rate, readmission rate, rehabilitation compliance, surgical volume by procedure, and surgeon-wise performance benchmarks. These KPIs help compare Orthopedic clinical Performance across departments and track both efficiency and patient recovery outcomes.
3. How does it support hospital administration?
By consolidating surgical, patient, and rehabilitation data, it provides administrators with a clear picture of both performance and patient outcomes.