What is a Recovery Progress Dashboard?
The recovery progress dashboard illustrates the patient's recovery progress in a visual format. It is used for post-surgical recovery, occupational therapy, or physical therapy to determine whether the recovery was made as expected. Clinicians can track their short and long-term goals and work on adjusting the treatment for effective clinical outcomes with patient recovery tracking. It can be used as a real-time recovery monitoring tool to determine treatment progress so that patients are committed to the rehab program.
Recovery Progress Dashboard Example
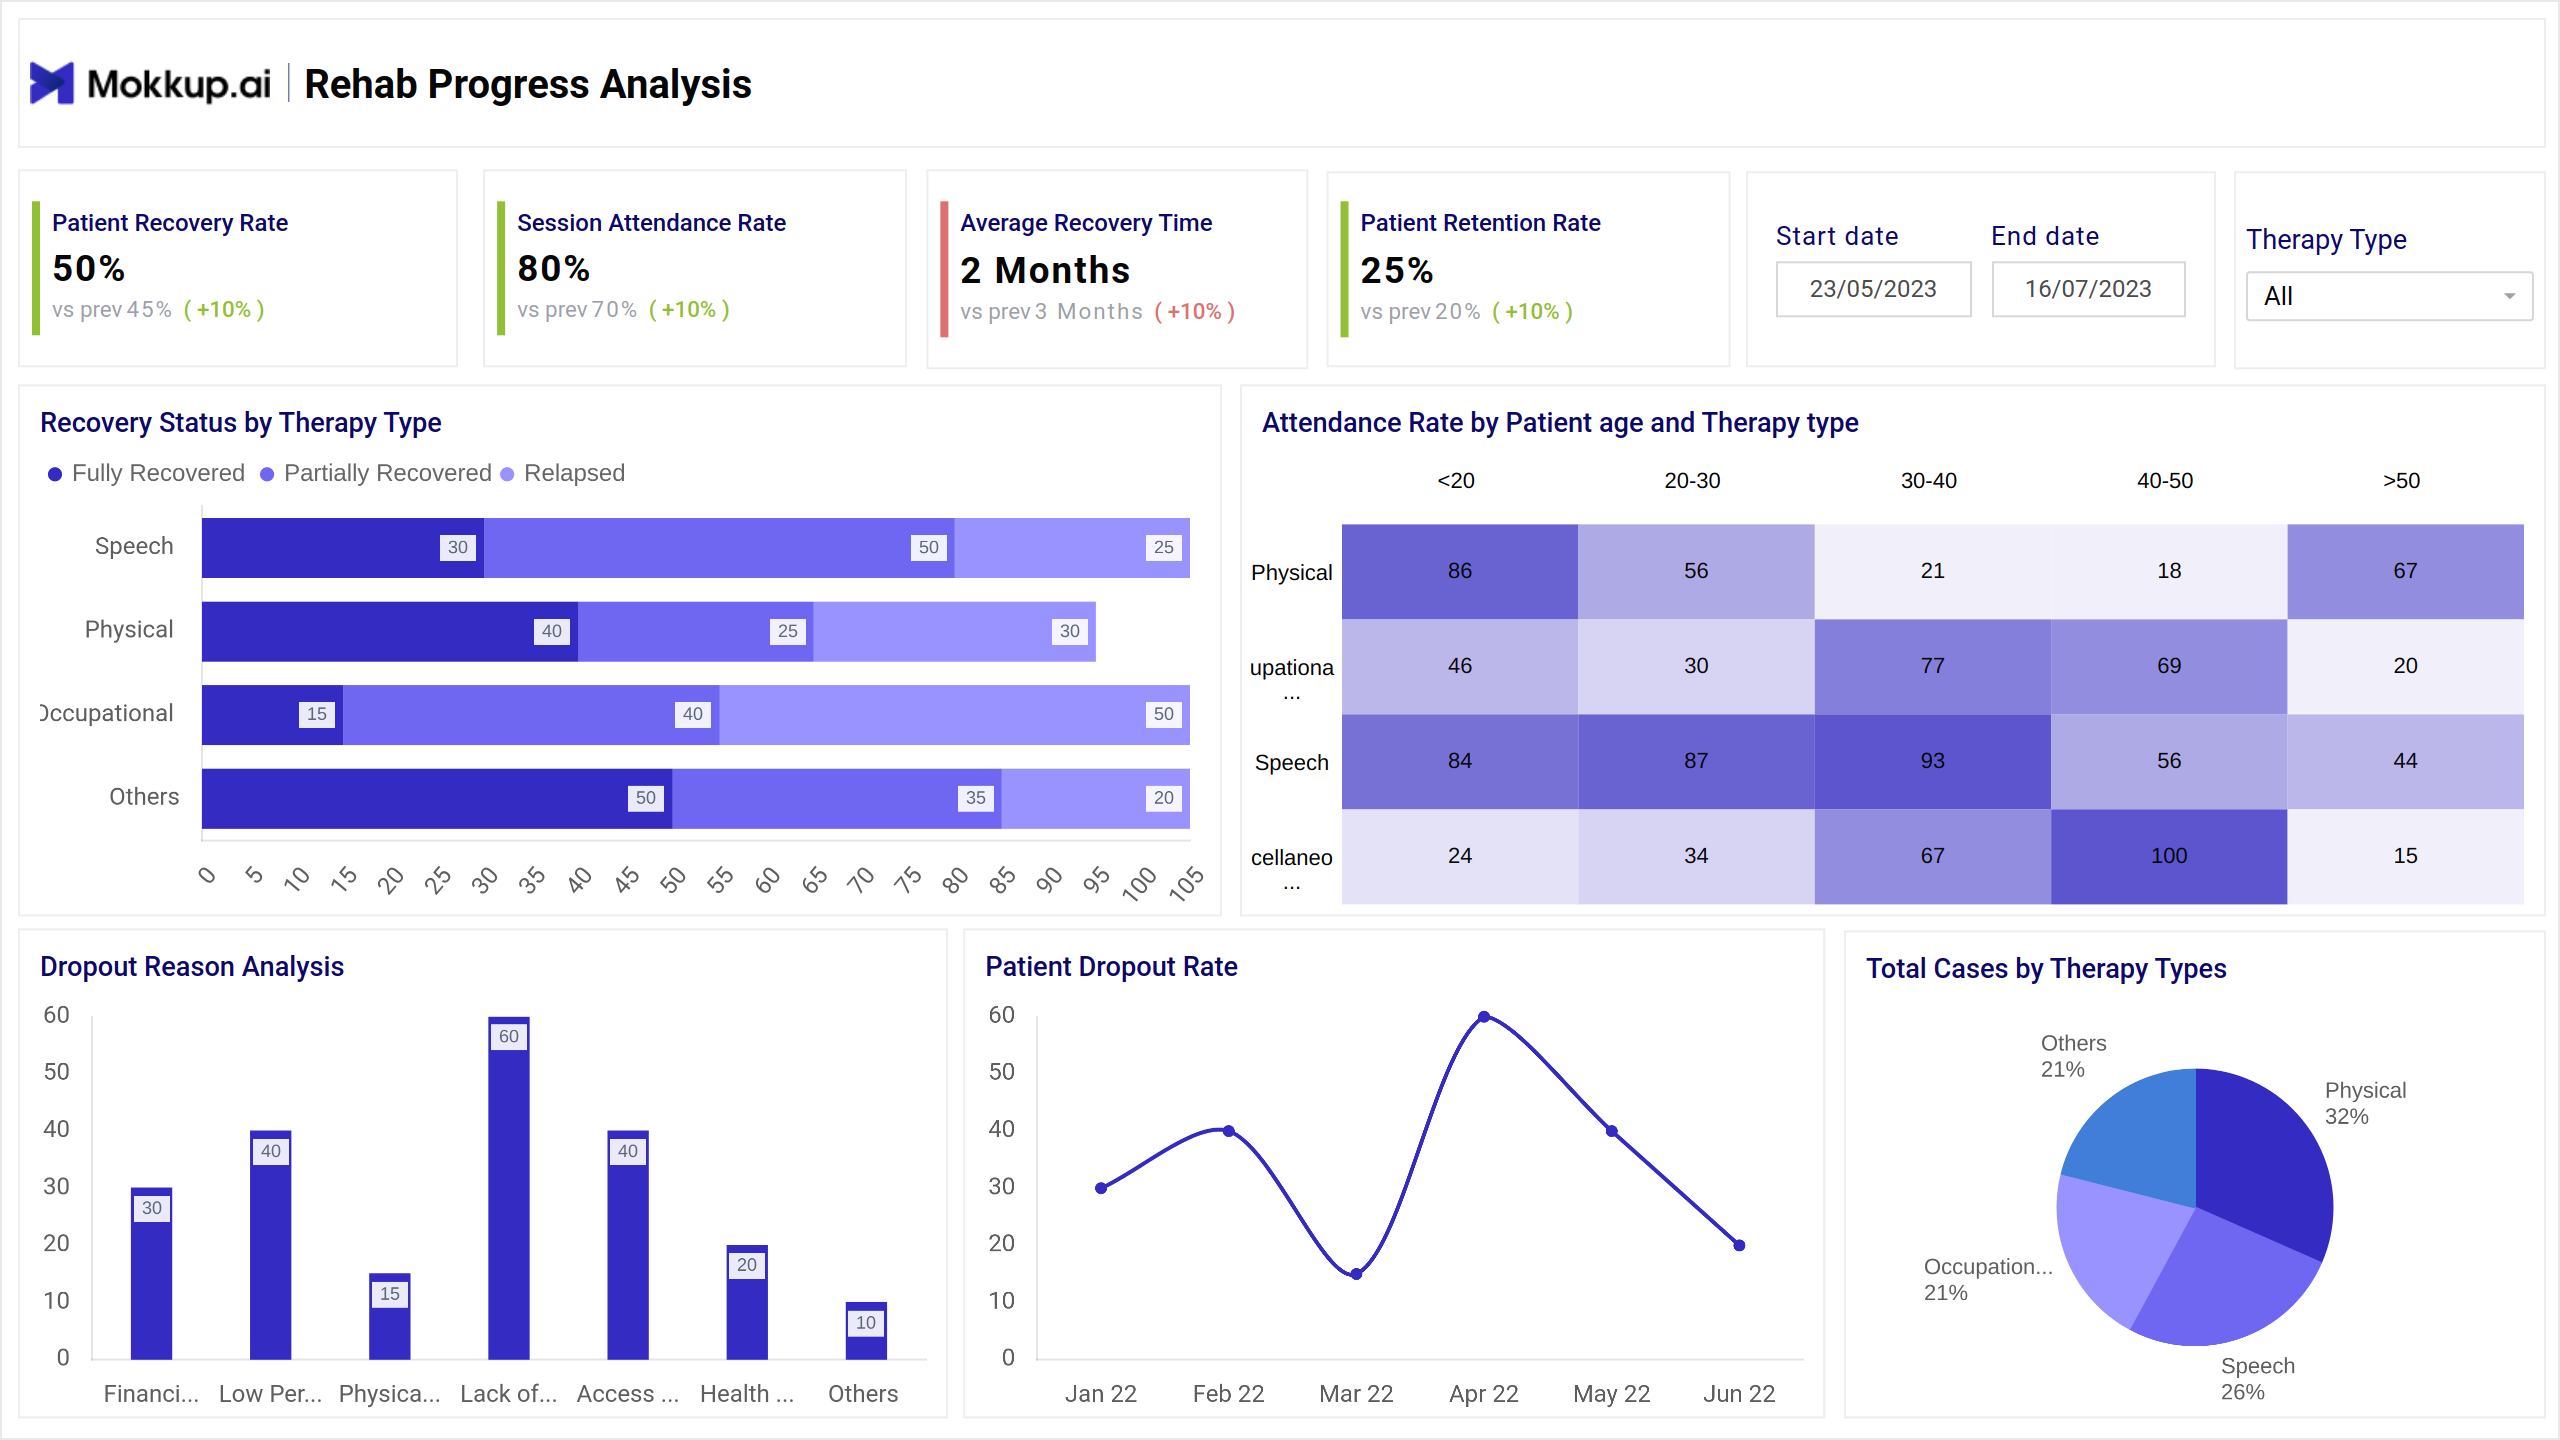
This Physical rehab progress tracking dashboard provides a clear, real-time snapshot of a patient's rehabilitation journey. Typically, the dashboard features intuitive navigation filters like therapy type, allowing users to zero in on relevant cases quickly. Users can track trends, flag anomalies, and use the dashboard during consultations to explain recovery milestones to patients and families.
How to Analyze Data in Recovery Dashboards
Analyzing data in this dashboard requires users to track the major KPIs for post-treatment recovery analytics to examine outcomes. This is similar to the Cancer Care Progress Monitor, which can track patient retention and dropout rates, in which providers can identify engagement gaps and improve care continuity. Dropout reason analysis further uncovers barriers, such as financial constraints or dissatisfaction, helping refine patient support strategies. Additionally, viewing total cases by therapy types offers insight into demand patterns and resource allocation.
How to Create a Recovery Progress Dashboard
To create this dashboard, you need to just select the ready-to-use Mokkup.ai recovery dashboard template, add in your data, and export it however you like. Here’s how to do it:
1. Create or Log in to Your Mokkup Account
Start by signing up on Mokkup.ai using your email. If you already have an account, just log in, and you’ll be good to go.
2. Choose and Customize Your Dashboard Template
Find the Recovery Progress Dashboard in the Templates section. Use the drag-and-drop editor to adjust KPIs, edit filters, or add elements based on your data.
3. Export to Your BI Tool
Once your dashboard wireframe is ready, use the BI Tool Export feature to send it directly to Power BI or Tableau for further analysis and enhancements. You can also download the dashboard as a PDF, PNG, or JPEG, embed it on a platform, or invite your team to collaborate.
Note: This is a Pro template. You’ll need a Pro subscription on Mokkup to use and customize this dashboard wireframe. Upgrade anytime to unlock full access.
Benefits of Recovery Dashboards
The therapy outcome dashboard provides real-time visibility into the recovery process, which indeed streamlines the work for the rehabilitation department. Some of the crucial benefits are as follows:
- It provides an upper hand on the rehab data so patients can make tangible improvements.
- It can provide injury recovery statistics, essential for making data-driven decisions instead of relying on subjective feedback.
- When tracked precisely, this dashboard template can help recognize stagnant progress for proactive intervention.
- It can allow doctors to schedule their rehabilitation initiatives and focus on the patients who require extra care.
KPIs to Track in Recovery Progress Dashboards
This dashboard wireframe includes essential health recovery KPIs such as:
- Patient Recovery Rate: The percentage of patients who have made improvements in health over time.
- Session Attendance Rate: It evaluates the percentage of people who attended the therapy sessions or events.
- Average Recovery Time: This KPI in recovery progress analytics measures the average duration it takes patients to return to functional independence.
- Patient Retention Rate: This metric determines the percentage of people who would continue to take therapy sessions over a given period.
- Recovery Status by Therapy Type: It refers to knowing the recovery status of patients based on several therapy types to contribute to improvements over time.
Frequently Asked Questions
1. What kind of data is displayed on the dashboard?
The dashboard typically includes patient recovery rate, session attendance rate, average recovery time, patient retention and dropout rates, and the number of cases by therapy type.
2. How can this dashboard help reduce patient dropouts?
The dashboard highlights trends and reasons behind dropouts, allowing care teams to proactively address issues like dissatisfaction, scheduling conflicts, or lack of progress.