
Yes, we can add data from both in-store sales and digital optical retail channels.
What is an Optical Sales & Revenue Dashboard?
An Optical Sales & Revenue Dashboard is a digital reporting tool designed for eye hospitals, optical clinics, and retail eyewear outlets to track financial and sales performance. It consolidates sales, profit margins, customer conversion rates, and category-wise revenue into a single interface. By using this optical sales tracking dashboard template, healthcare institutions can monitor product performance, reduce return rates, and optimize revenue streams. It also acts as an optical revenue monitoring tool by linking optical sales directly with hospital revenue, giving leadership better visibility into profitability.
How to Create an Optical Sales & Revenue Dashboard
You don’t need to build your report from scratch—just start with a ready-to-use Optical Sales & Revenue Dashboard template from Mokkup. Add in your data and export it however you like. Here’s how to do it:
1. Create or Log in to Your Mokkup Account
Start by signing up on Mokkup.ai using your email. If you already have an account, just log in, and you’ll be good to go.
2. Choose and Customize Your Dashboard Template
Find the Optical Sales & Revenue Dashboard template in the Templates section. Use the drag-and-drop editor to adjust KPIs, edit filters, or add elements based on your data.
3. Export to Your BI Tool
Once your dashboard wireframe is ready, use the BI Tool Export feature to send it directly to Power BI or Tableau for further analysis and enhancements. You can also download the dashboard as a PDF, PNG, or JPEG, embed it on a platform, or invite your team to collaborate.
Note: This is a Pro template. You’ll need a Pro subscription on Mokkup to use and customize this dashboard wireframe. Upgrade anytime to unlock full access.
Optical Sales & Revenue Dashboard Example
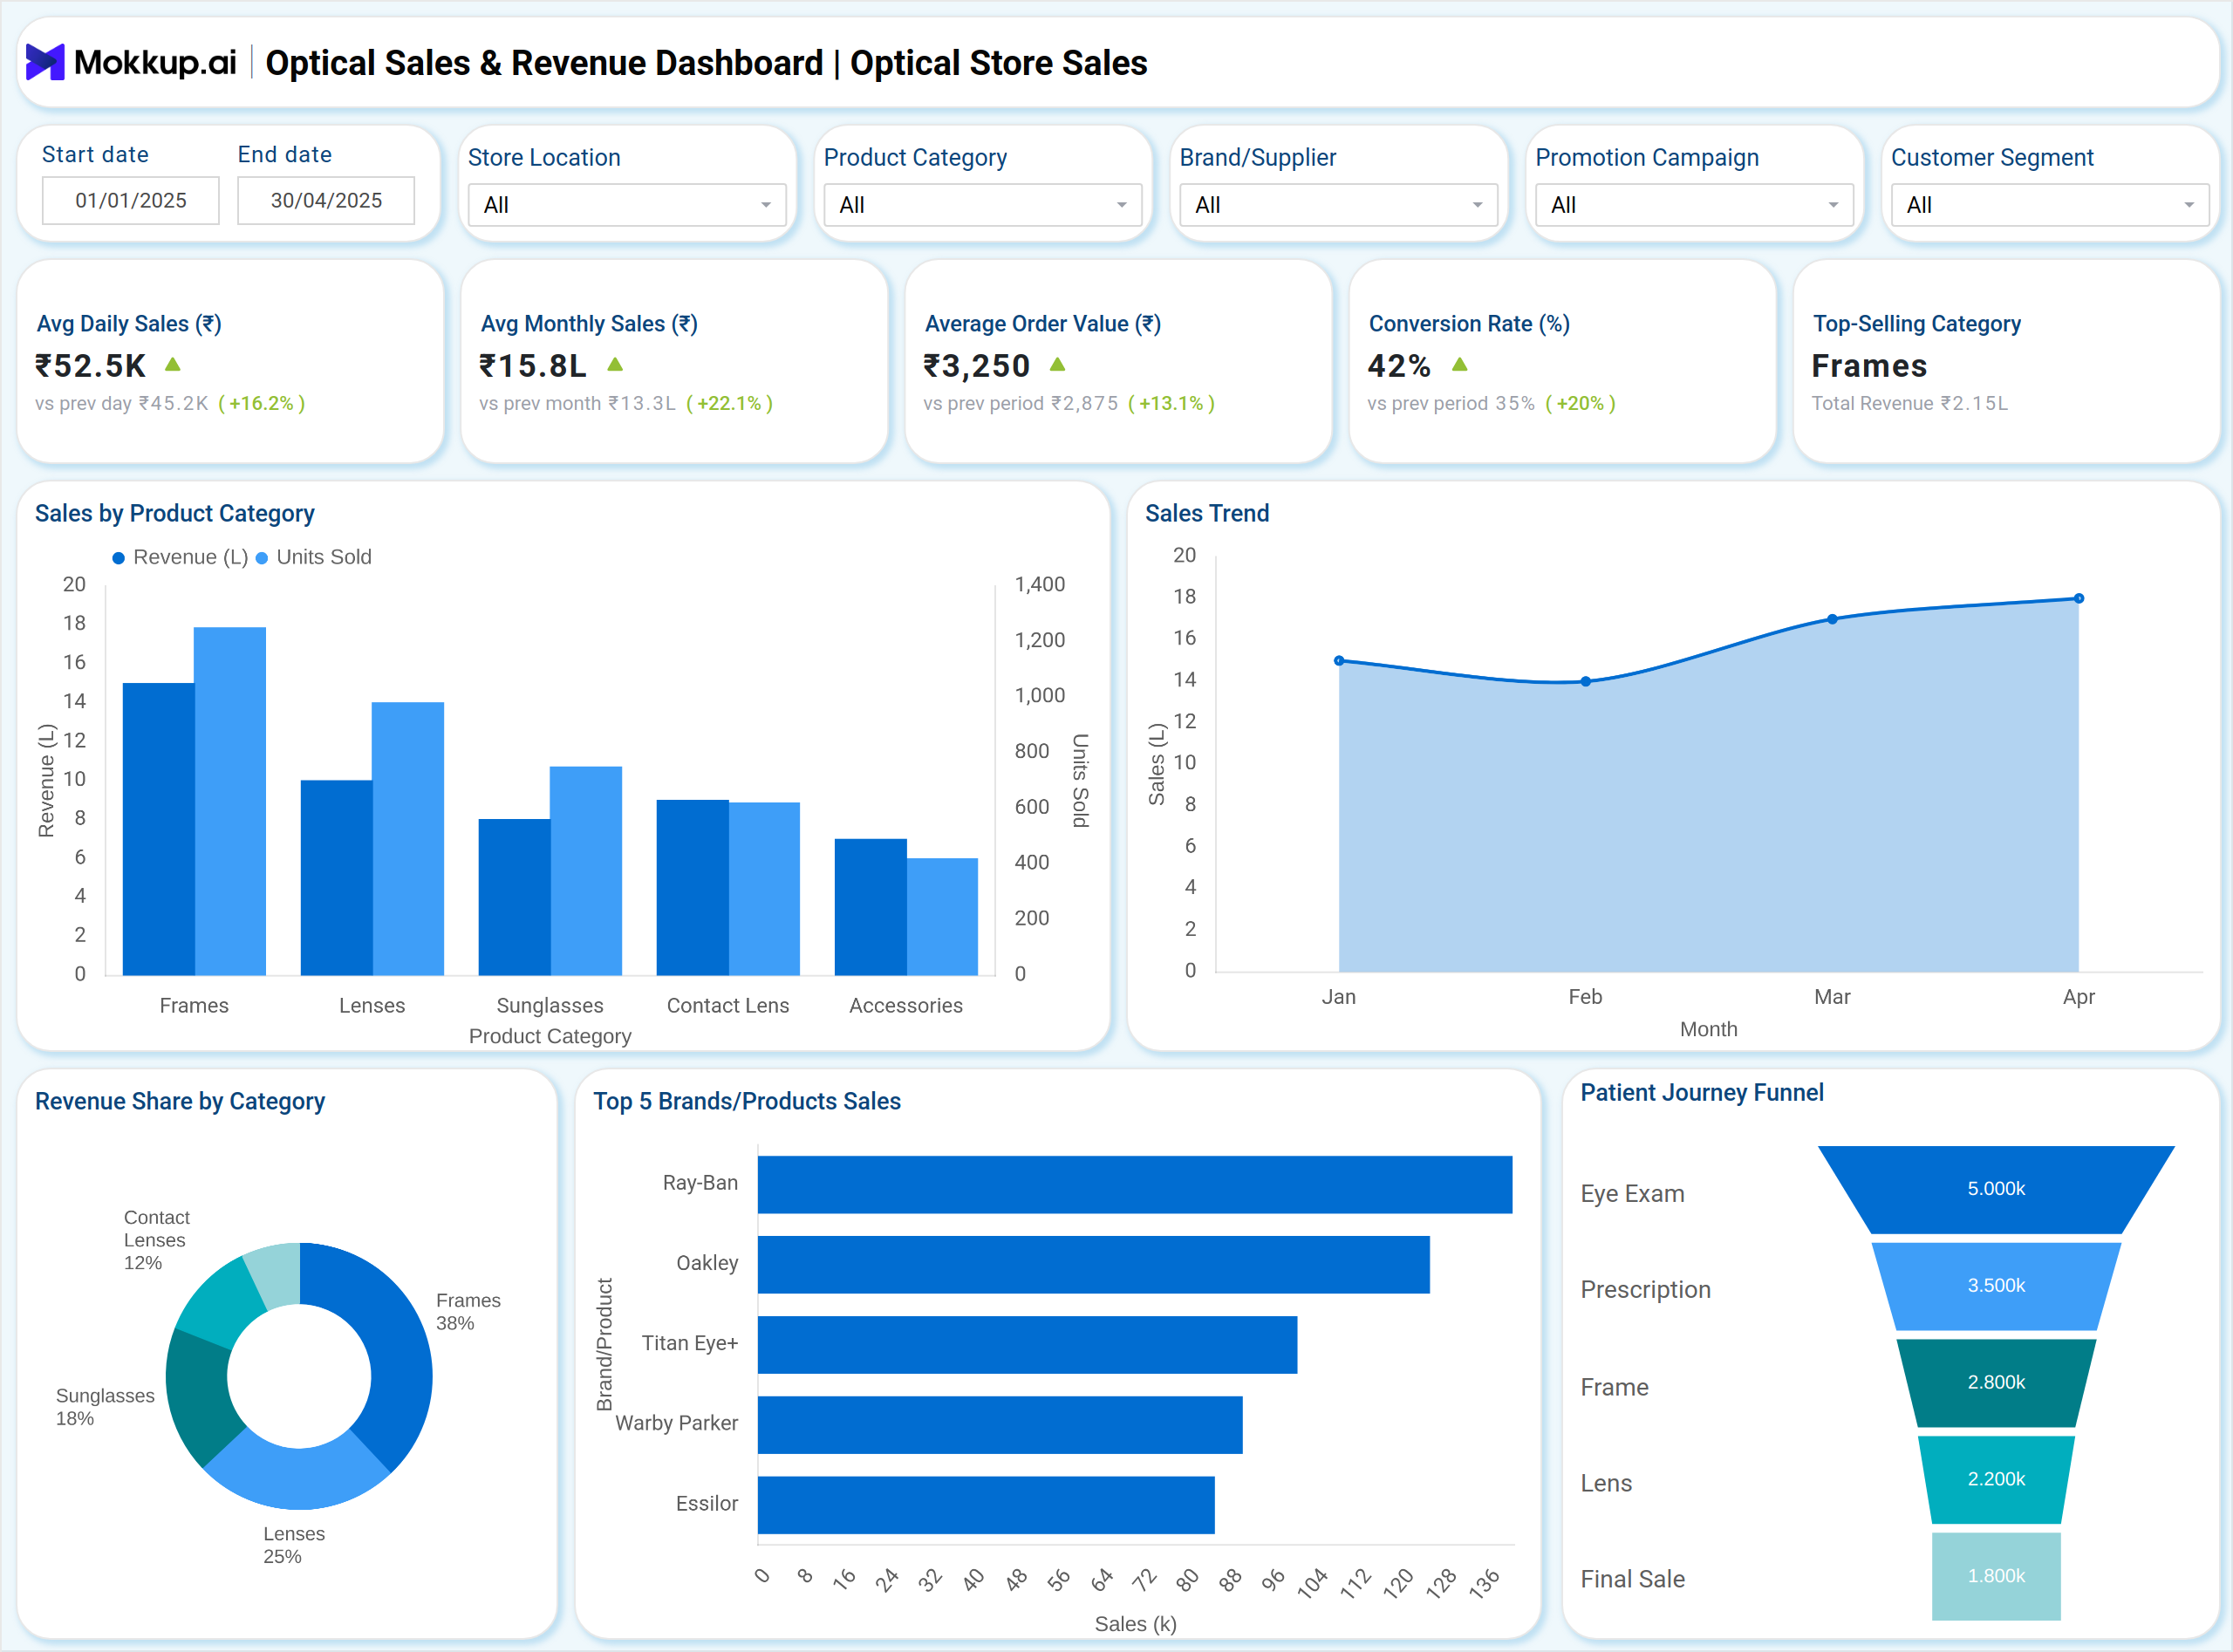
You can create your own dashboard by combining two main views that cover both sales and profitability. The Optical Store Sales Dashboard tracks retail performance with KPIs such as daily sales, monthly sales, average order value, and conversion rate from eye exams to purchases. It includes visual insights like sales by category, revenue share by product type, and top-selling eyewear brands. The Finance & Profitability Dashboard highlights financial health with KPIs like gross profit margin, COGS %, operating profit, and return/refund trends. Supporting charts show profit margin distribution, outlet-wise contribution, cost vs. revenue by category, and optical revenue share of hospital income. Together, these dashboards act as an optical sales tracking dashboard and eyewear sales performance tool for hospitals and clinics.
How to Analyze Data in Optical Sales & Revenue Dashboards
Analyzing optical sales data helps hospitals and retailers identify growth opportunities, improve sales performance, and maintain profitability across categories:
- Track Daily & Monthly Sales: Identify sales growth trends across time.
- Measure Category Performance: Compare sales of frames, lenses, sunglasses, contact lenses, and accessories.
- Monitor Conversion Funnel: Follow patient flow from eye exam to prescription and final eyewear purchase.
- Compare Cost vs. Revenue: Understand profitability per product line.
- Evaluate Profit Margins: Analyze gross margin by category and outlet contribution.
- Track Returns/Refunds: Detect product quality or service issues from higher return rates.
- Monitor Hospital Contribution: Assess how optical sales add to overall hospital revenue.
Benefits of Optical Sales & Revenue Dashboards
An optical sales dashboard helps healthcare and retail teams gain visibility into sales trends, optimize pricing strategies, and enhance decision-making through real-time insights:
- Real-Time Revenue Monitoring: Provides continuous tracking of optical revenue across outlets and categories.
- Accurate Sales Forecasting: Helps improve sales predictions for eyewear products based on historical data and trends.
- Reduced Operational Inefficiencies: Identifies return/refund patterns to minimize losses and streamline processes.
- Data-Driven Decision-Making: Enhances decision-making with clear cost vs. revenue analysis.
- Improved Financial Oversight: Supports hospital administrators with detailed eye hospital revenue analytics.
- Enhanced Retail Performance: Strengthens store operations by acting as an optical clinic sales reporting system.
- Optimized Marketing Strategies: Provides insights into customer conversion rates to refine campaigns and sales efforts.
KPIs to Track in Optical Sales & Revenue Dashboards
Tracking these KPIs helps hospitals and optical retailers measure performance, profitability, and conversion effectiveness:
- Total Optical Revenue (₹): Overall sales value generated.
- Gross Profit Margin (%): Profitability across all categories.
- COGS % of Sales: Cost of goods sold relative to revenue.
- Operating Profit (%): Net profitability after expenses.
- Average Order Value (₹): Sales per transaction.
- Conversion Rate (%): Percentage of patients converting from exam to purchase.
Frequently Asked Questions
Q1. Who uses an Optical Sales & Revenue Dashboard?
Eye hospital administrators, optical retail managers, and financial controllers use it to track sales, profitability, and patient conversions.
Q2. How does this dashboard help hospitals?
It connects optical retail sales with overall hospital revenue, providing better financial planning and profitability analysis.
Q3. Can this dashboard track brand-wise performance?
Yes, it highlights top-performing brands like Ray-Ban, Oakley, and Titan Eye+, supporting retail strategy.
Q4. Does it support both online and offline sales?
Q5. How does it benefit patients?
By improving sales tracking and efficiency, patients get faster service, better product availability, and improved buying experience.