What is an Oncology Digital Care & Research Dashboard?
The Digital Care Delivery & Patient Engagement Dashboard is a centralized platform for monitoring telehealth adoption, patient engagement, virtual care efficiency, AI & research digitization monitoring, and Healthcare IT & cybersecurity analytics across oncology centers. It enables IT directors, digital health managers, and oncology program heads to track digital transformation, optimize workflows, and enhance patient care by combining clinical, operational, and IT data for real-time insights and proactive management.
How to Create an Oncology Digital Care & Research Dashboard
You don’t need to build your report from scratch-just start with a ready-to-use dashboard template from Mokkup. Add your data and export it as needed. Here’s how to do it:
1. Create or Log in to Your Mokkup Account
Start by signing up on Mokkup.ai using your email. If you already have an account, simply log in, and you’ll be all set.
2. Choose and Customize Your Dashboard Template
Find the Oncology Digital Care & Research Dashboard template in the Templates section. Use the drag-and-drop editor to adjust KPIs, edit filters, or add elements based on your data.
3. Export to Your BI Tool
Once your dashboard wireframe is ready, use the BI Tool Export feature to send it directly to Power BI or Tableau for further analysis and enhancements. You can also download the dashboard as a PDF, PNG, or JPEG, embed it on a platform, or invite your team to collaborate.
Note: This is a Pro template. You’ll need a Pro subscription on Mokkup to use and customize this dashboard wireframe. Upgrade anytime to unlock full access.
Oncology Digital Care & Research Dashboard Example
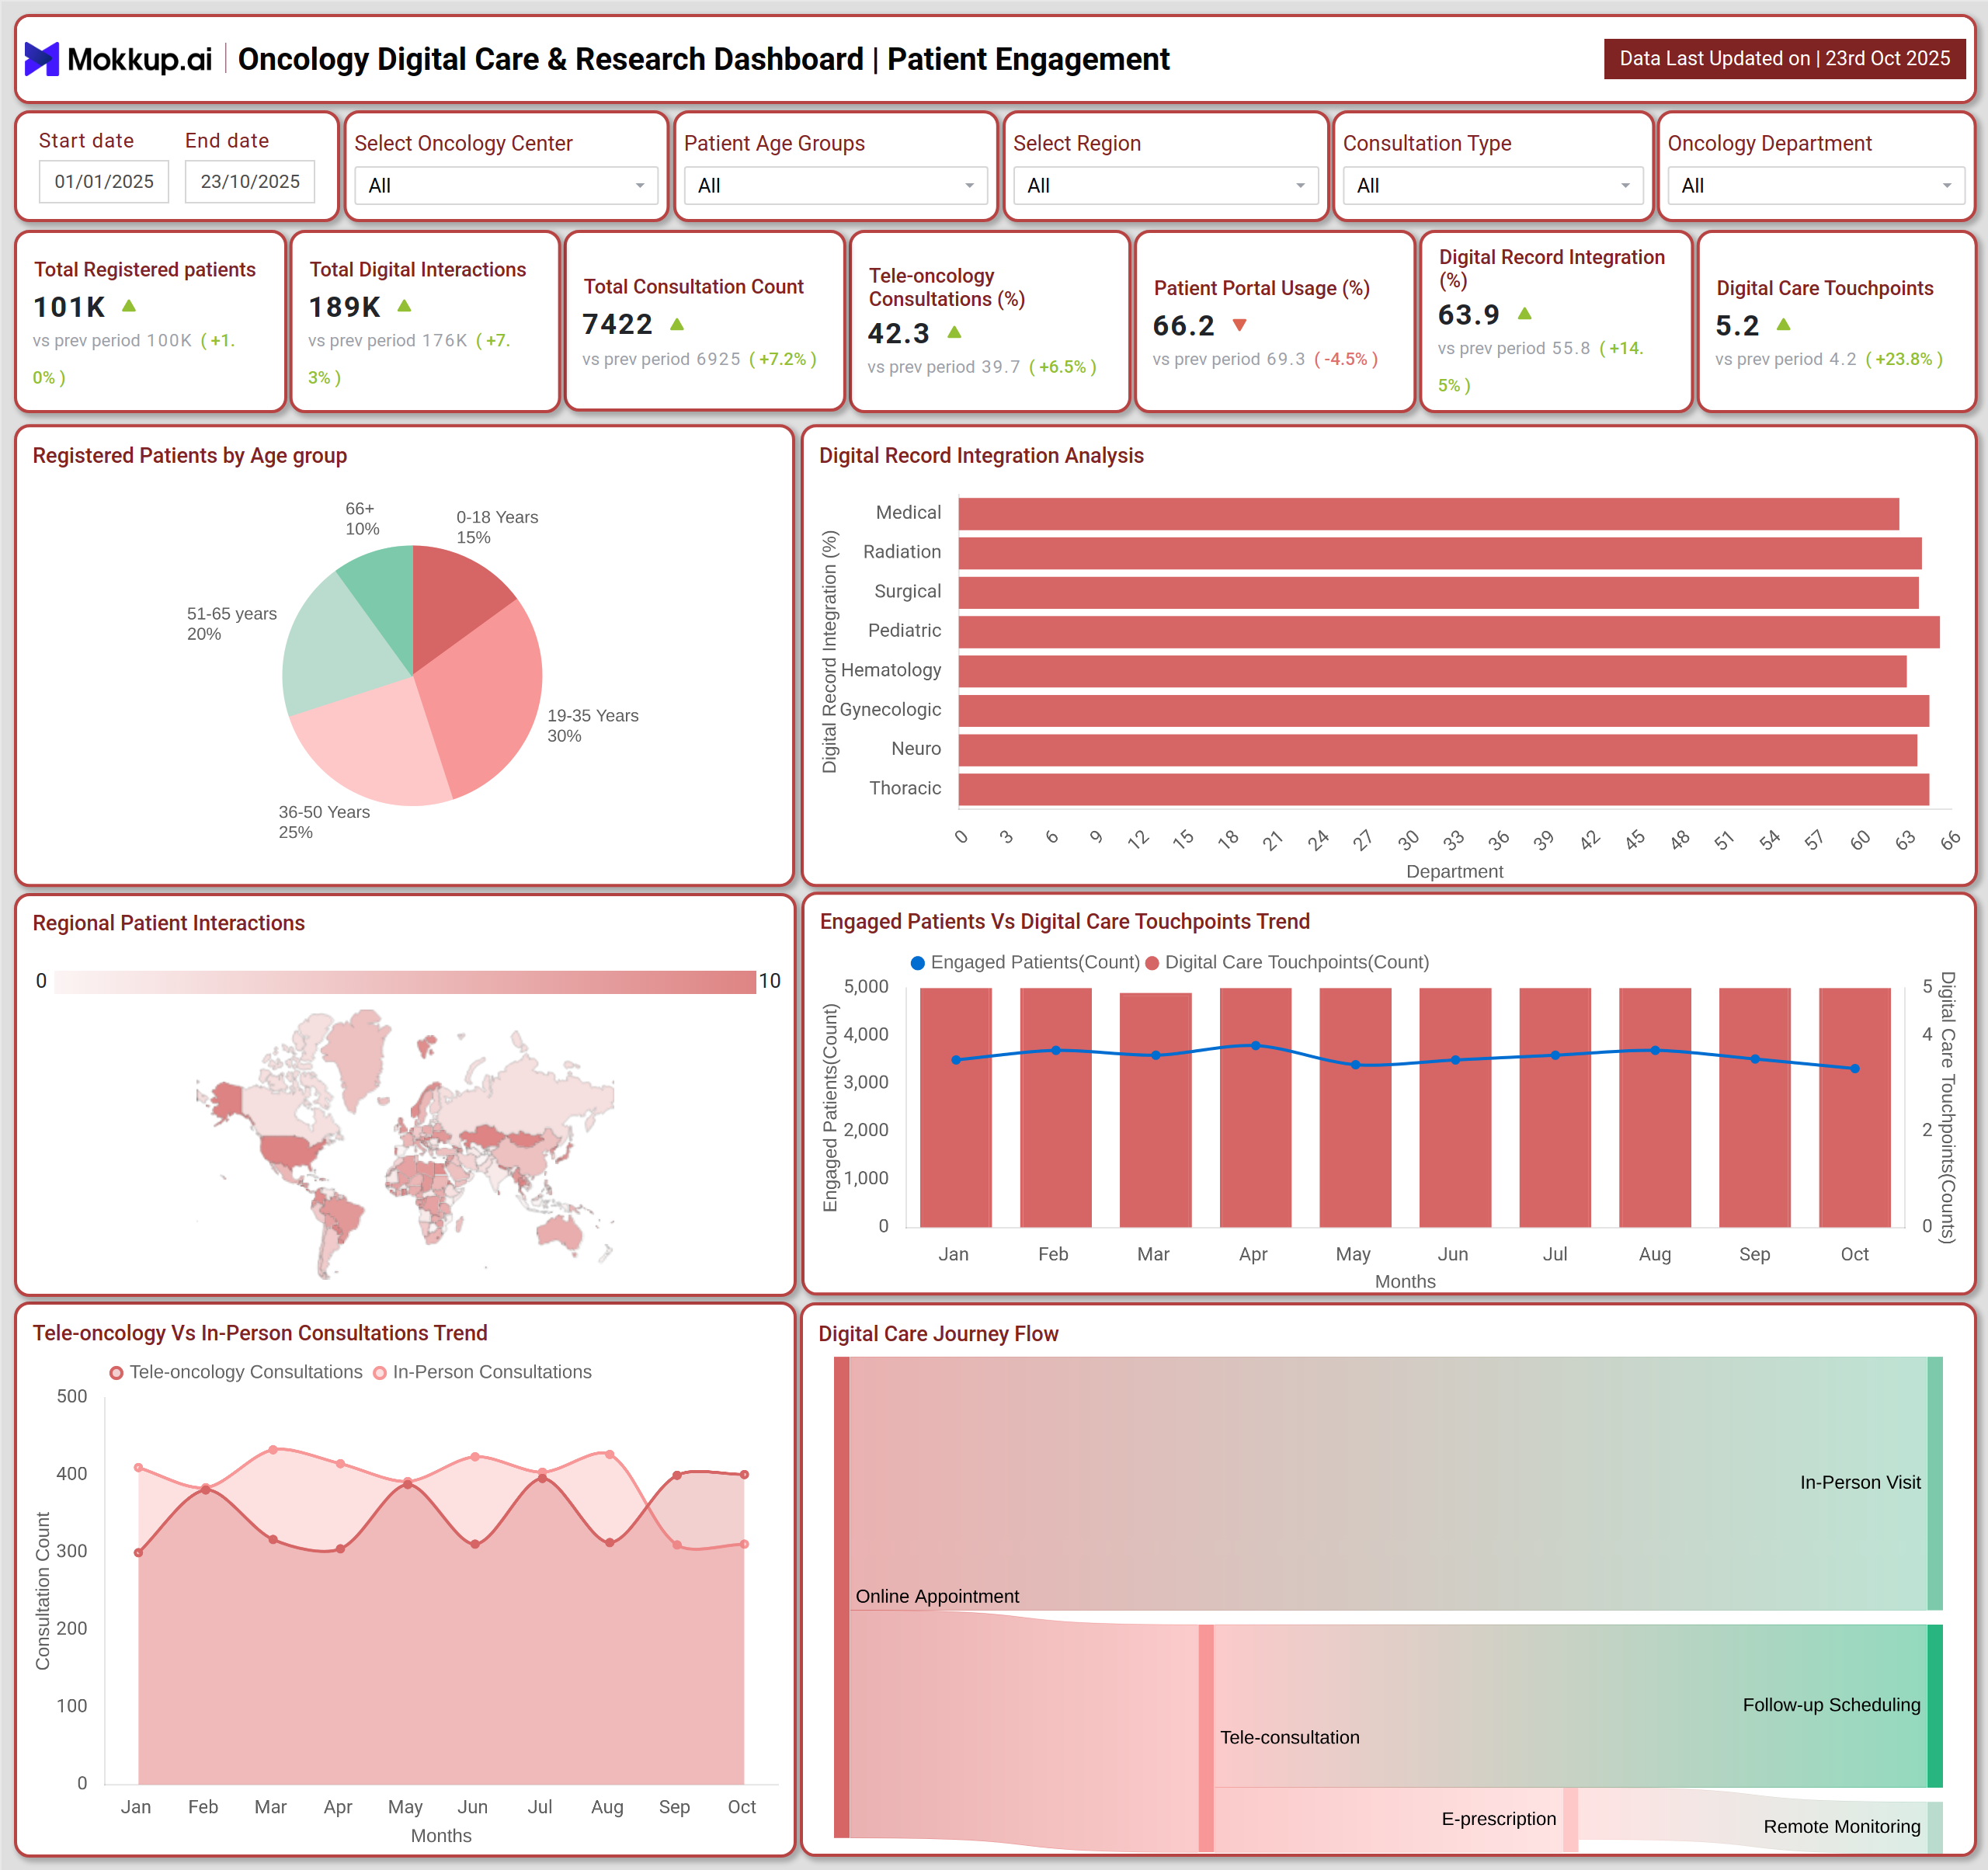
The patient engagement screen tracks tele-oncology consultations, patient portal usage, digital record integration, session times, and the number of digital care touchpoints. It highlights patient engagement trends and identifies gaps in the adoption of virtual care. By providing these insights, this Digital care delivery dashboard helps optimize digital care workflows, improve patient experience, and strengthen Telehealth adoption analytics across oncology centers. Also, another screen monitors AI/ML adoption, research data digitization, system uptime, and cybersecurity incidents. It identifies IT risk areas, tracks AI-enabled research productivity, and ensures compliance with digital security protocols. These insights guide IT and digital health leaders in informed decision-making, enhance AI adoption, improve research efficiency, and facilitate proactive cybersecurity management.
How to Analyse Data in an Oncology Digital Care & Research Dashboard
Here is how you can analyze data from this dashboard:
- Start with KPIs: Tele-oncology consultations %, patient portal usage %, digital record integration %, average session time, number of digital care touchpoints, etc. These metrics provide a comprehensive view of Patient engagement & virtual care tracking, as well as IT efficiency.
- Assess Digital Engagement Efficiency: Compare telehealth adoption, portal engagement, and digital record integration across centers, departments, and age groups to optimize virtual care delivery.
- Track AI & Research Trends: Monitor AI adoption across oncology departments, research data digitization progress, and the correlation between AI usage and research productivity to identify opportunities for AI & research digitization monitoring and improvement.
- Analyze Cybersecurity & IT Insights: Utilize area charts, bar charts, gauges, treemaps, and combo charts to identify high-risk security events, unresolved incidents, and patterns of system downtime.
- Detect Patterns & Anomalies: Apply filters by time, center, department, AI model, research project, security event type, or severity level to detect recurring issues, underutilized AI tools, or security vulnerabilities.
Benefits of an Oncology Digital Care & Research Dashboard
Here are benefits of using this dashboard:
- Real-time insights on patient engagement and digital care adoption -Provides instant visibility into how patients interact with digital care services.
- Optimizes telehealth utilization, patient portal engagement, and virtual care workflows -Improves efficiency and effectiveness of virtual care delivery.
- Tracks AI/ML adoption, research digitization, and system uptime for IT efficiency -Monitors technology adoption and system performance for more innovative IT management.
- Monitors cybersecurity events and ensures proactive incident resolution -Identifies risks and addresses security issues before they escalate.
- Supports IT and digital health transformation in oncology centers -Guides leaders in implementing effective digital initiatives.
- Enables optimal resource allocation and transparency across centers -Ensures efficient use of resources and clear visibility across multiple facilities.
KPIs to Track in an Oncology Digital Care & Research Dashboard
- Tele-oncology Consultations (%) -Shows adoption trends and seasonal variations of telehealth consultations.
- Patient Portal Usage (%) -Measures engagement across age groups, centers, and regions.
- Digital Record Integration (%) -Tracks digitization progress of clinical records and imaging.
- Number of Digital Care Touchpoints -Total digital interactions per patient journey.
- Cybersecurity Events Logged -Counts detected phishing, malware, and access breach incidents.
- Resolved vs Pending Security Incidents -Measures the efficiency of IT teams in managing incidents.
- Research Data Digitization (%) -Tracks progress in converting clinical and research data to digital formats.
Frequently Asked Questions
1. How does monitoring telehealth and patient portal usage improve digital care delivery?
By tracking adoption trends, Patient engagement & virtual care tracking, and digital record integration, IT teams can optimize virtual care pathways and enhance the overall patient experience.
2. Why is AI adoption monitoring important for oncology centers?
Monitoring AI & research digitization monitoring helps identify departments leveraging clinical AI effectively, correlating with research data digitization, and enabling evidence-based decision-making.
3. How does cybersecurity monitoring support IT efficiency and patient safety?
Tracking security events, resolution rates, and severity levels allows IT teams to proactively manage risks, ensuring safe, reliable, and compliant digital care delivery.