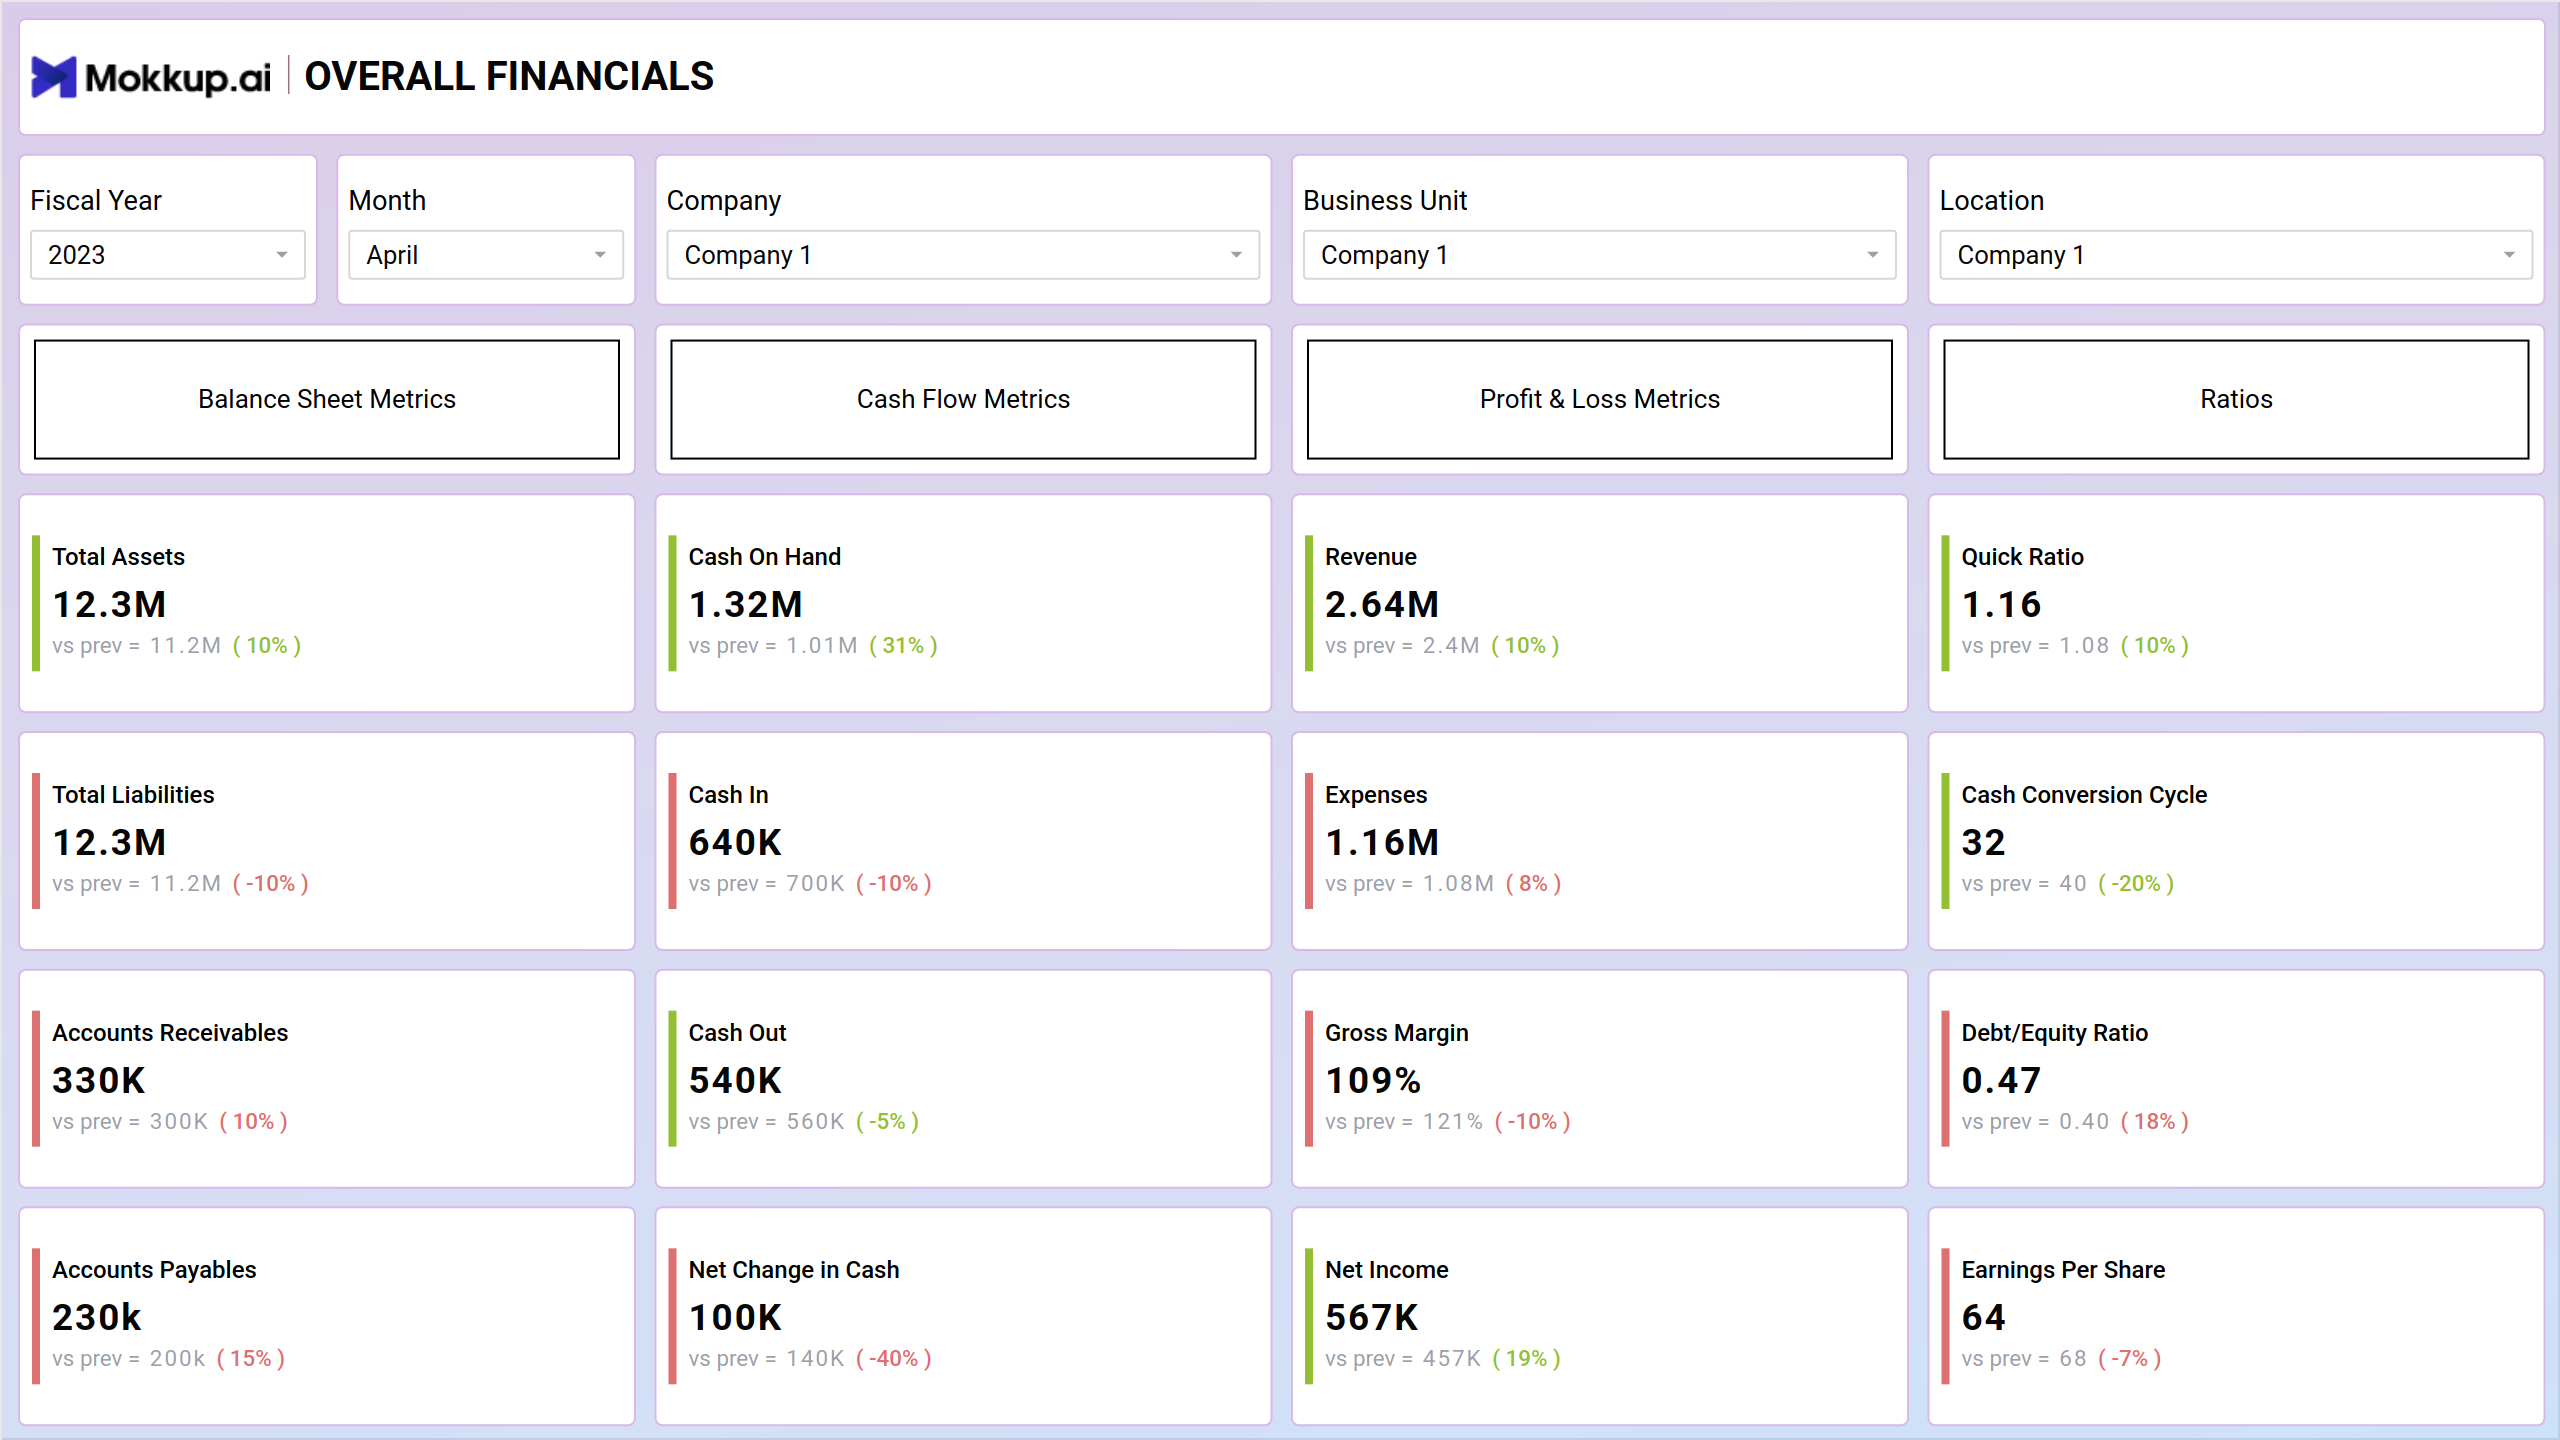
The financial review screen shows an organization's financial health in the big picture. Dashboards can be analytical or descriptive. In this case, our design focuses on giving a descriptive picture of key financial measures like assets, liabilities, income, costs, and profits.
Screen 1: Overall Finances
This dashboard wireframe can be changed in many ways and has three pages, but you can add more pages if your company needs them.
Key Terms to consider:
- Balance Sheet Metrics - Key financial indicators reflecting the company's assets, liabilities, and equity at a specific point in time.
- Cash Flow Metrics - Performance indicators related to the movement of cash in and out of the business, crucial for assessing liquidity and financial health.
- Profit & Loss Metrics - Measures and ratios detailing the company's revenue, expenses, and overall profitability over a defined period.
- Ratios - Comparative figures and percentages used to analyze the relationship between different financial elements, aiding in performance evaluation.
- Total assets - The aggregate value of a company's assets, encompassing both tangible and intangible resources.
- Cash on hand - The amount of readily available cash or cash equivalents that a company holds at a given moment.
- Quick ratio (short-term assets vs. liabilities) - A liquidity ratio measuring a company's ability to cover short-term liabilities using its most liquid assets.
- Gross margin - The percentage difference between revenue and the cost of goods sold, providing insights into the profitability of a company's core operations.
- Earnings per share (EPS) - A key financial metric indicating the portion of a company's profit allocated to each outstanding share of its common stock, providing insight into its profitability on a per-share basis.
Screen 2: By Location
This section examines financial results according to business unit location. It helps to identify areas that are operating well and those that need attention, enabling more focused decision-making.
Key Terms to consider:
- Business Unit - A distinct operational segment or division within a company, often responsible for specific products, services, or geographic regions.
- Net Income - The final profit or loss of a business unit after deducting all expenses, taxes, and indicating its overall financial performance.
Screen 3: Trend Comparison
This dashboard provides a comprehensive overview of key metrics over time, facilitating informed decision-making and strategic planning in a dynamic financial landscape.
Key Terms to consider:
- Revenue (top line) - The total income generated by a business before deducting any expenses, representing the starting point of the profit and loss statement.
- Liabilities - The financial obligations or debts that a company owes to external parties, encompassing items such as loans, accounts payable, and accrued expenses.
Dashboard Template Insights
The financial overview dashboard offers a comprehensive view of key metrics, including assets, liabilities, income, costs, and profits. From customizable wireframes to location-specific insights and trend comparisons, it serves as a dynamic tool for informed decision-making and strategic planning in a dynamic financial landscape.
Conclusion
This financial overview dashboard provides a thorough understanding of the financial environment of an organization. This adaptable tool empowers organizations to make wise financial choices and maintain a strong financial position, whether you require a quick glimpse of important data or a thorough study of unit performance by location.