
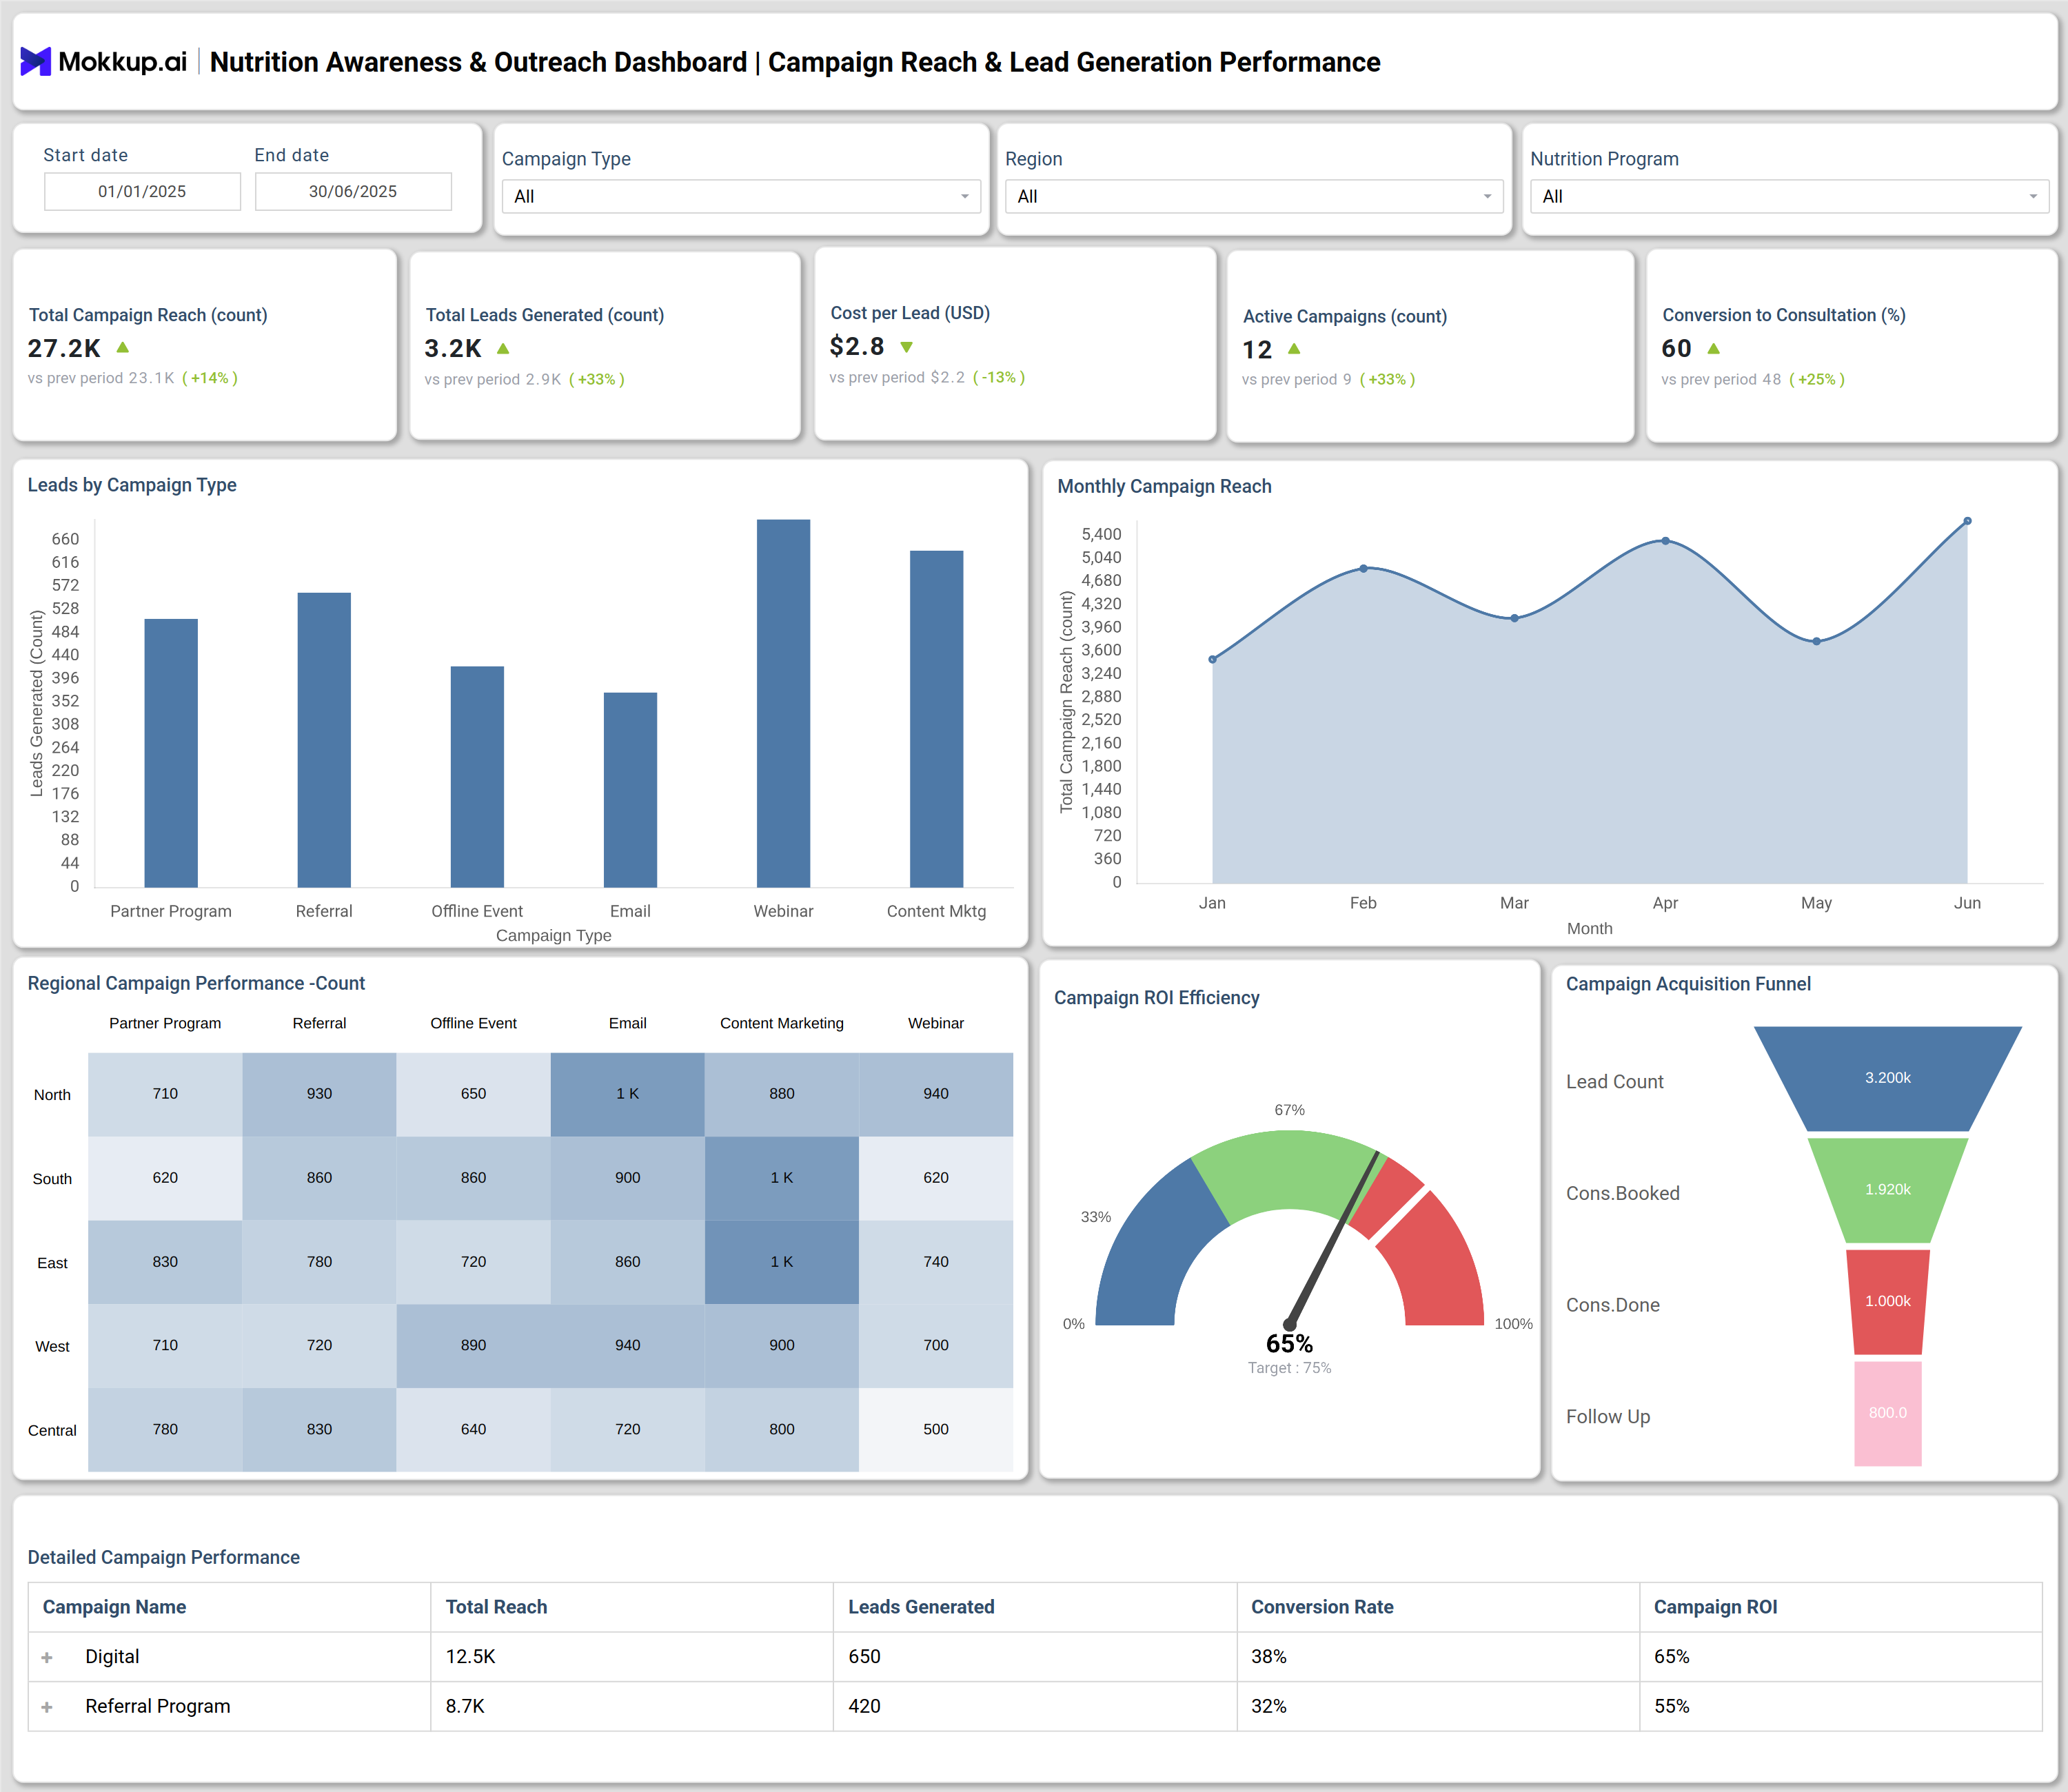
Key performance indicators (KPIs) help track campaign effectiveness, patient engagement, and the overall impact of nutrition outreach programs on community health outcomes:
What is a Nutrition Awareness & Outreach Dashboard?
A Nutrition Awareness & Outreach Dashboard is a centralized analytics template designed for hospitals and healthcare institutions to measure, report, and improve the effectiveness of their public health nutrition programs. This Nutrition education dashboard consolidates essential metrics related to community nutrition initiatives, campaign performance, and patient engagement. It enables healthcare organizations to make data-driven decisions by visualizing nutrition performance program reach, lead generation, patient conversion, and follow-up compliance.
How to Create a Nutrition Awareness & Outreach Dashboard
You don’t need to build your report from scratch—just start with a ready-to-use dashboard template from Mokkup. Add in your data and export it however you like. Here’s how to do it:
1. Create or Log in to Your Mokkup Account
Start by signing up on Mokkup.ai using your email. If you already have an account, just log in, and you’ll be good to go.
2. Choose and Customize Your Dashboard Template
Find the Nutrition Awareness & Outreach Dashboard template in the Templates section. Use the drag-and-drop editor to adjust KPIs, edit filters, or add elements based on your data.
3. Export to Your BI Tool
Once your dashboard wireframe is ready, use the BI Tool Export feature to send it directly to Power BI or Tableau for further analysis and enhancements. You can also download the dashboard as a PDF, PNG, or JPEG, embed it on a platform, or invite your team to collaborate.
Note: This is a Pro template. You’ll need a Pro subscription on Mokkup to use and customize this dashboard wireframe. Upgrade anytime to unlock full access.
Nutrition Awareness & Outreach Dashboard Example
A practical Nutrition Awareness & Outreach Dashboard includes campaign analytics and patient conversion outcomes in a visually structured format. For example, hospital teams can filter campaign metrics—such as total reach, leads generated, cost per lead, active programs, and conversion rates—by date, program type, and region. It visually tracks leads generated through different outreach channels (partner programs, webinars, content marketing), monthly campaign reach, and regional campaign performance. Additionally, patient conversion and retention modules monitor consultation counts, compliance rates, consultation revenue, referrals, and patient satisfaction scores. These components make it simple to analyze both operational efficiency and real-world health impact from nutrition outreach initiatives.
How to Analyze Data in Nutrition Awareness & Outreach Dashboard
Here's how to best analyze a Nutrition Awareness & Outreach dashboard:
- Review Campaign Types and Monthly Reach: Identify which outreach formats and time periods generate the strongest awareness and engagement.
- Compare Regional Campaign Performance: Pinpoint regions with strong traction and areas that need focused outreach.
- Track Conversion Rates and ROI Efficiency: See which nutrition programs drive participation and deliver the best return.
- Monitor Patient Retention and Compliance: Track how well patients follow nutrition plans and which dietitians support better adherence.
- Visualize Cumulative Growth: Assess long-term participation growth to understand true impact beyond month-to-month spikes.
- Assess Patient Referral Trends: Review how patients move across nutrition programs to improve continuity and follow-up pathways.
Benefits of Nutrition Awareness & Outreach Dashboard
A Nutrition awareness dashboards empower with below benefits:
- Centralized Program Insights: Provides a single view of nutrition campaigns, outreach progress, and patient engagement trends.
- Faster Impact Measurement: Highlights high-performing education initiatives and flags areas where awareness or participation is weak.
- Targeted Decision-Making: Helps teams adjust messaging, channels, and strategy based on real-time performance data.
- Better Conversion & Satisfaction Tracking: Shows how awareness converts to participation, patient satisfaction, and referral movement.
- Transparent Outcome Monitoring: Makes program impact and dietary behavior improvements easy to track and report.
- Improved Team Alignment: Keeps nutrition, public health, and community outreach teams aligned with shared metrics and goals.
KPIs to Track in Nutrition Awareness & Outreach Dashboard
- Total Campaign Reach (count): Measures how many individuals were reached by nutrition campaigns.
- Total Leads Generated (count): Tracks new potential patients identified by outreach activities.
- Cost per Lead (USD): Calculates expenses associated with generating each lead.
- Active Campaigns (count): Counts ongoing nutrition education or outreach programs.
- Conversion to Consultation (%): Shows percentage of leads converting to consultations.
- Campaign ROI Efficiency (%): Evaluates return on investment for outreach campaigns.
- Monthly Campaign Reach: Charts campaign impact over different months.
Frequently Asked Questions
1. Who uses a Nutrition Awareness & Outreach Dashboard?
Nutrition teams, dietitians, program managers, and hospital administrators rely on these dashboards for tracking public health nutrition data and program outcomes.
2. What insights does the dashboard provide for improvement?
The dashboard reveals which outreach channels and nutrition interventions generate the most leads and conversions, helping teams refine strategies and enhance community health impact.
3. Is the dashboard customizable for different hospital settings?
Yes, dashboards can be tailored to reflect unique nutrition outreach programs, regions, and patient demographics, supporting multiple operational goals.