
What is a Nuclear Power Plant Workforce Competency Dashboard?
A Nuclear Power Plant Workforce Competency Dashboard is a structured monitoring system that helps HR leaders, plant directors, and Chief Nuclear Officers evaluate the capability, qualifications, and readiness of the nuclear workforce. It centralizes insights on employee competency levels, qualification coverage, critical-role fulfillment, training progress, and experience distribution across units. This dashboard supports regulatory expectations from NRC and INPO by tracking workforce capability against required standards. It serves as an evidence-based tool for operations, maintenance, radiation protection, and engineering teams, ensuring that only qualified and competent personnel are assigned to critical job functions.
With increasing skill shortages and growing regulatory scrutiny, the need for a reliable workforce qualification tracking system for nuclear plants is higher than ever. This type of dashboard allows teams to maintain safe staffing levels, manage certification cycles, and identify emerging skill gaps. It also enables the consistent review of nuclear operations competency assessment metrics, helping plants maintain operational continuity while ensuring safety and compliance. The dashboard functions as an HR dashboard for nuclear workforce capability management, centralizing qualifications, training status, and role readiness.
How to Create a Nuclear Power Plant Workforce Competency Dashboard
You don’t need to build your report from scratch—just start with a ready-to-use dashboard template from Mokkup. Add in your data and export it however you like. Here’s how to do it:
1. Create or Log in to Your Mokkup Account
Start by signing up on Mokkup.ai using your email. If you already have an account, just log in, and you’ll be good to go.
2. Choose and Customize Your Dashboard Template
Find the Nuclear Power Plant Workforce Competency Dashboard template in the Templates section. Use the drag-and-drop editor to adjust KPIs, edit filters, or add elements based on your data.
3. Export to Your BI Tool
Once your dashboard wireframe is ready, use the BI Tool Export feature to send it directly to Power BI or Tableau for further analysis and enhancements. You can also download the dashboard as a PDF, PNG, or JPEG, embed it on a platform, or invite your team to collaborate.
Note: This is a Pro template. You’ll need a Pro subscription on Mokkup to use and customize this dashboard wireframe. Upgrade anytime to unlock full access.
Nuclear Power Plant Workforce Competency Dashboard Example
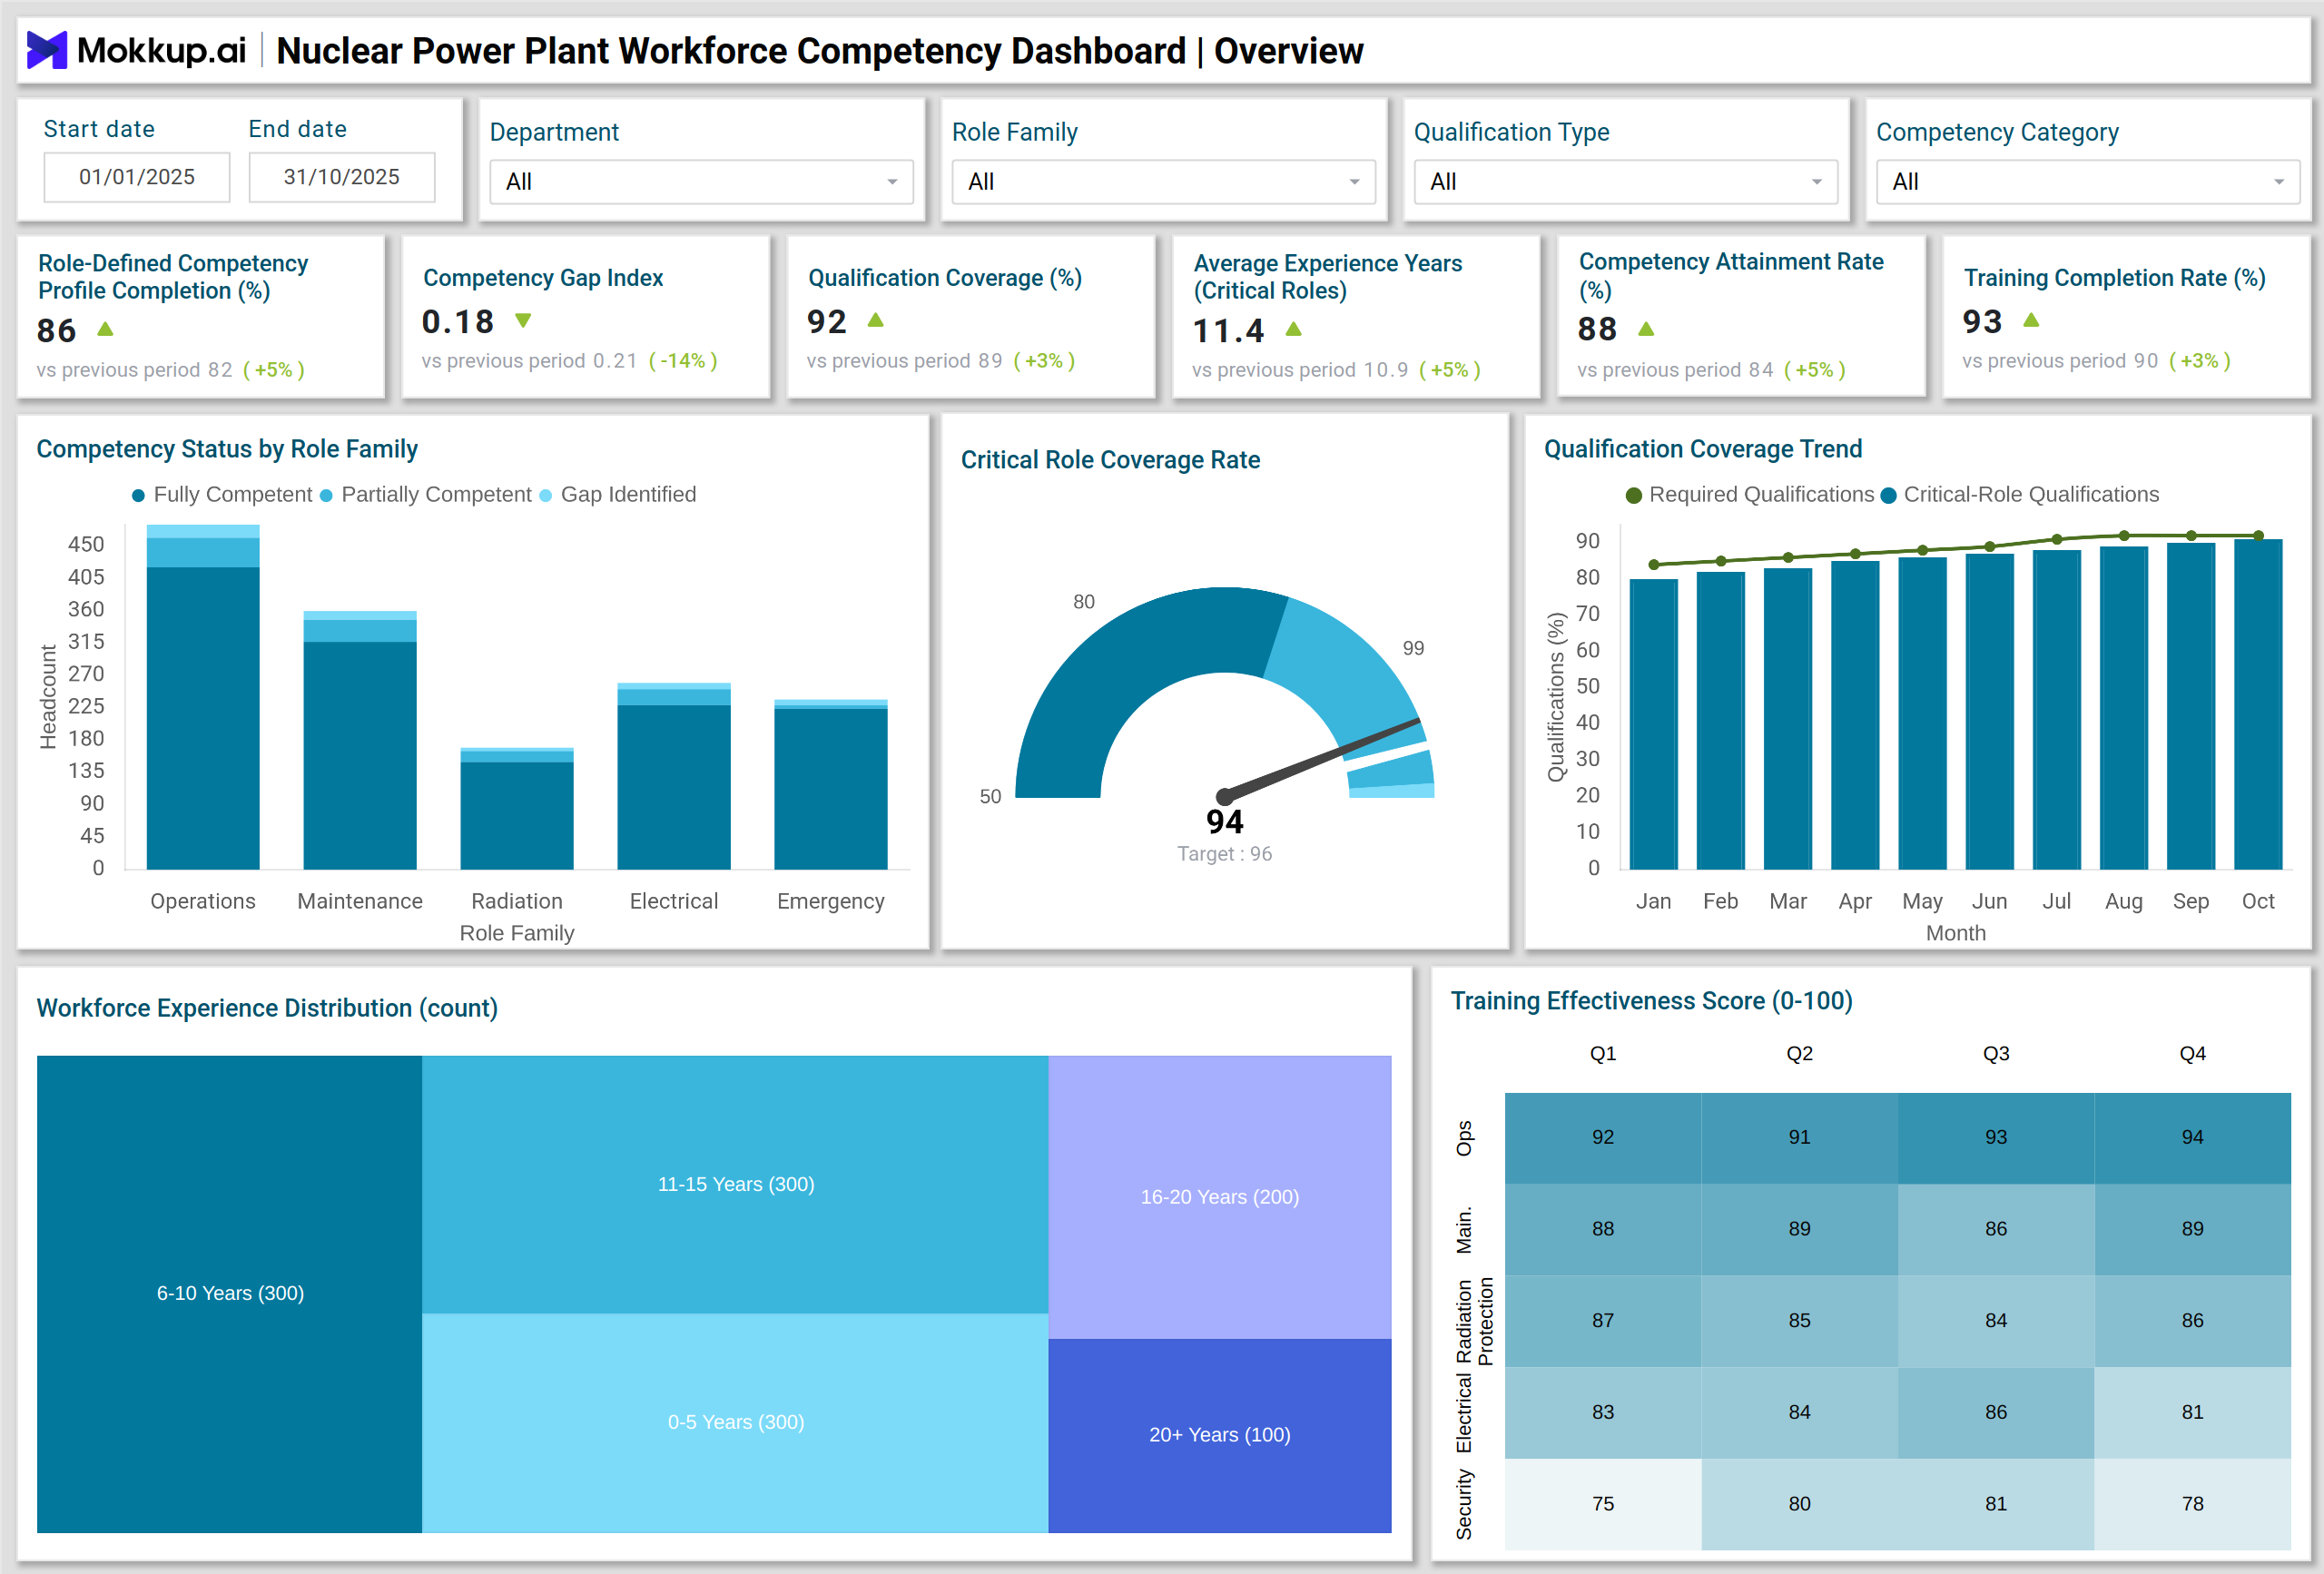
A Nuclear Power Plant Workforce Competency Dashboard typically includes visual summaries that cover role-based competency status, qualification adherence, staffing risk areas, and upcoming workforce needs. For example, HR teams can view a Stacked Column Chart showing competency status by role family, allowing them to compare fully competent, partially competent, and at-risk roles.
The Qualification Coverage Trend displayed through a multi-series Line Chart helps leaders examine how compliance levels shift across months. A Treemap visual can show how experience years are distributed across departments, providing context for succession planning.
A Gauge Chart focusing on critical role coverage gives leadership an immediate view of operational readiness. Heatmaps can display training effectiveness over time, supporting decisions regarding training redesign or reinforcement.
Hiring teams can analyze the Funnel Chart, which tracks the hiring pipeline for nuclear-qualified roles, ensuring that the plant maintains a sufficient number of candidates for highly specialized positions. The dashboard example also includes workforce-related safety metrics such as Overtime Hours and Fatigue Events, presented through Combo Charts and Column Charts. These visuals create a unified view for nuclear HR teams, supporting competency and qualification monitoring for nuclear facilities while strengthening capability planning.
How to Analyze Data in Nuclear Power Plant Workforce Competency Dashboards
Here is how you can analyze data from this dashboard:
- Identify competency gaps by reviewing the Competency Gap Index across departments and role families.
- Track qualification coverage percent to determine whether safety-critical positions meet NRC and INPO requirements.
- Analyze experience distribution to identify areas that may experience succession risks or expertise shortages.
- Review training completion and effectiveness to adjust learning programs for technical and regulatory skills.
- Monitor hiring funnel metrics to identify delays in sourcing, screening, or onboarding nuclear-qualified talent.
- Evaluate overtime and fatigue patterns to prevent operational risk and avoid staffing-related safety events.
- Track turnover reasons to improve retention strategies for high-impact technical roles.
- Compare role-defined competency profiles with organizational competency frameworks.
Benefits of Nuclear Power Plant Workforce Competency Dashboards
- Enhances visibility into nuclear operations competency assessment metrics across job families.
- Improves workforce planning by identifying skill shortages and future capability requirements.
- Strengthens compliance by tracking qualification coverage for regulated positions.
- Supports a structured workforce qualification tracking system for nuclear plants.
- Reduces staffing risk by identifying critical-role vacancies and monitoring hiring progress.
- Enhances training effectiveness through targeted improvements to competency programs.
- Helps maintain operational safety by monitoring fatigue events and overtime levels.
- Supports strategic HR decisions for recruitment, retention, and succession planning.
- Enables nuclear plant skill gap analysis dashboard insights to guide capability-building efforts.
KPIs to Track in Nuclear Power Plant Workforce Competency Dashboards
- Role-Defined Competency Profile Completion Percent – Measures how many employees meet the required competency profile for their assigned roles.
- Competency Gap Index – Identifies the difference between required and current competency levels across the workforce.
- Qualification Coverage Percent – Tracks the share of personnel who hold active qualifications for regulated nuclear roles.
- Average Experience Years for Critical Roles – Shows the depth of experience available in safety-critical functions.
- Competency Attainment Rate Percent – Indicates how quickly employees progress toward full competency status.
- Training Completion Rate Percent – Measures completion levels for mandatory technical and regulatory training programs.
- Time to Hire for Qualified Roles Days – Tracks the hiring duration for roles that require nuclear-specific certifications.
Frequently Asked Questions
1. Who uses a Nuclear Power Plant Workforce Competency Dashboard?
HR leaders, workforce planners, training teams, and Chief Nuclear Officers use the dashboard to track capability, qualifications, and staffing risks.
2. Why is workforce competency critical in nuclear operations?
Nuclear facilities rely on highly skilled and certified personnel. Competency gaps or unqualified staffing can impact plant safety, regulatory compliance, and operational continuity.
3. Can the dashboard track hiring performance for specialized roles?
Yes. The Funnel Chart for nuclear-qualified roles helps teams identify delays in hiring, offer acceptance issues, and vacancy risks for critical roles.
4. What insights can HR teams gain from experience distribution visuals?
Teams can identify if specific departments rely heavily on senior staff, face succession risks, or lack adequate mid-level experience.