
What is a Nuclear Power Plant Unit Development Progress Dashboard?
A Nuclear Power Plant Unit Development Progress Dashboard is a digital system that tracks every stage of nuclear unit construction, equipment delivery, regulatory clearance, and commissioning performance. It consolidates technical, financial, and scheduling data into a single interface, allowing project teams to monitor nuclear facility infrastructure development at scale. The dashboard improves visibility across engineering disciplines, contractors, and project phases by using structured KPIs and automated analytics. This helps utilities reduce project risk, manage delays, and ensure precise oversight in a complex nuclear project lifecycle. With nuclear power plants operating under strict regulatory and safety requirements, a dedicated progress monitoring system is essential for accurate reporting, early risk identification, and transparent project governance.
How to Create a Nuclear Power Plant Unit Development Progress Dashboard
You don’t need to build your report from scratch, just start with a ready-to-use dashboard template from Mokkup. Add in your data and export it however you like. Here’s how to do it:
1. Create or Log in to Your Mokkup Account
Start by signing up on Mokkup.ai using your email. If you already have an account, just log in, and you’ll be good to go.
2. Choose and Customize Your Dashboard Template
Find the Nuclear Power Plant Unit Development Progress Dashboard template in the Templates section. Use the drag-and-drop editor to adjust KPIs, edit filters, or add elements based on your data.
3. Export to Your BI Tool
Once your dashboard wireframe is ready, use the BI Tool Export feature to send it directly to Power BI or Tableau for further analysis and enhancements. You can also download the dashboard as a PDF, PNG, or JPEG, embed it on a platform, or invite your team to collaborate.
Note: This is a Pro template. You’ll need a Pro subscription on Mokkup to use and customize this dashboard wireframe. Upgrade anytime to unlock full access.
Nuclear Power Plant Unit Development Progress Dashboard Example
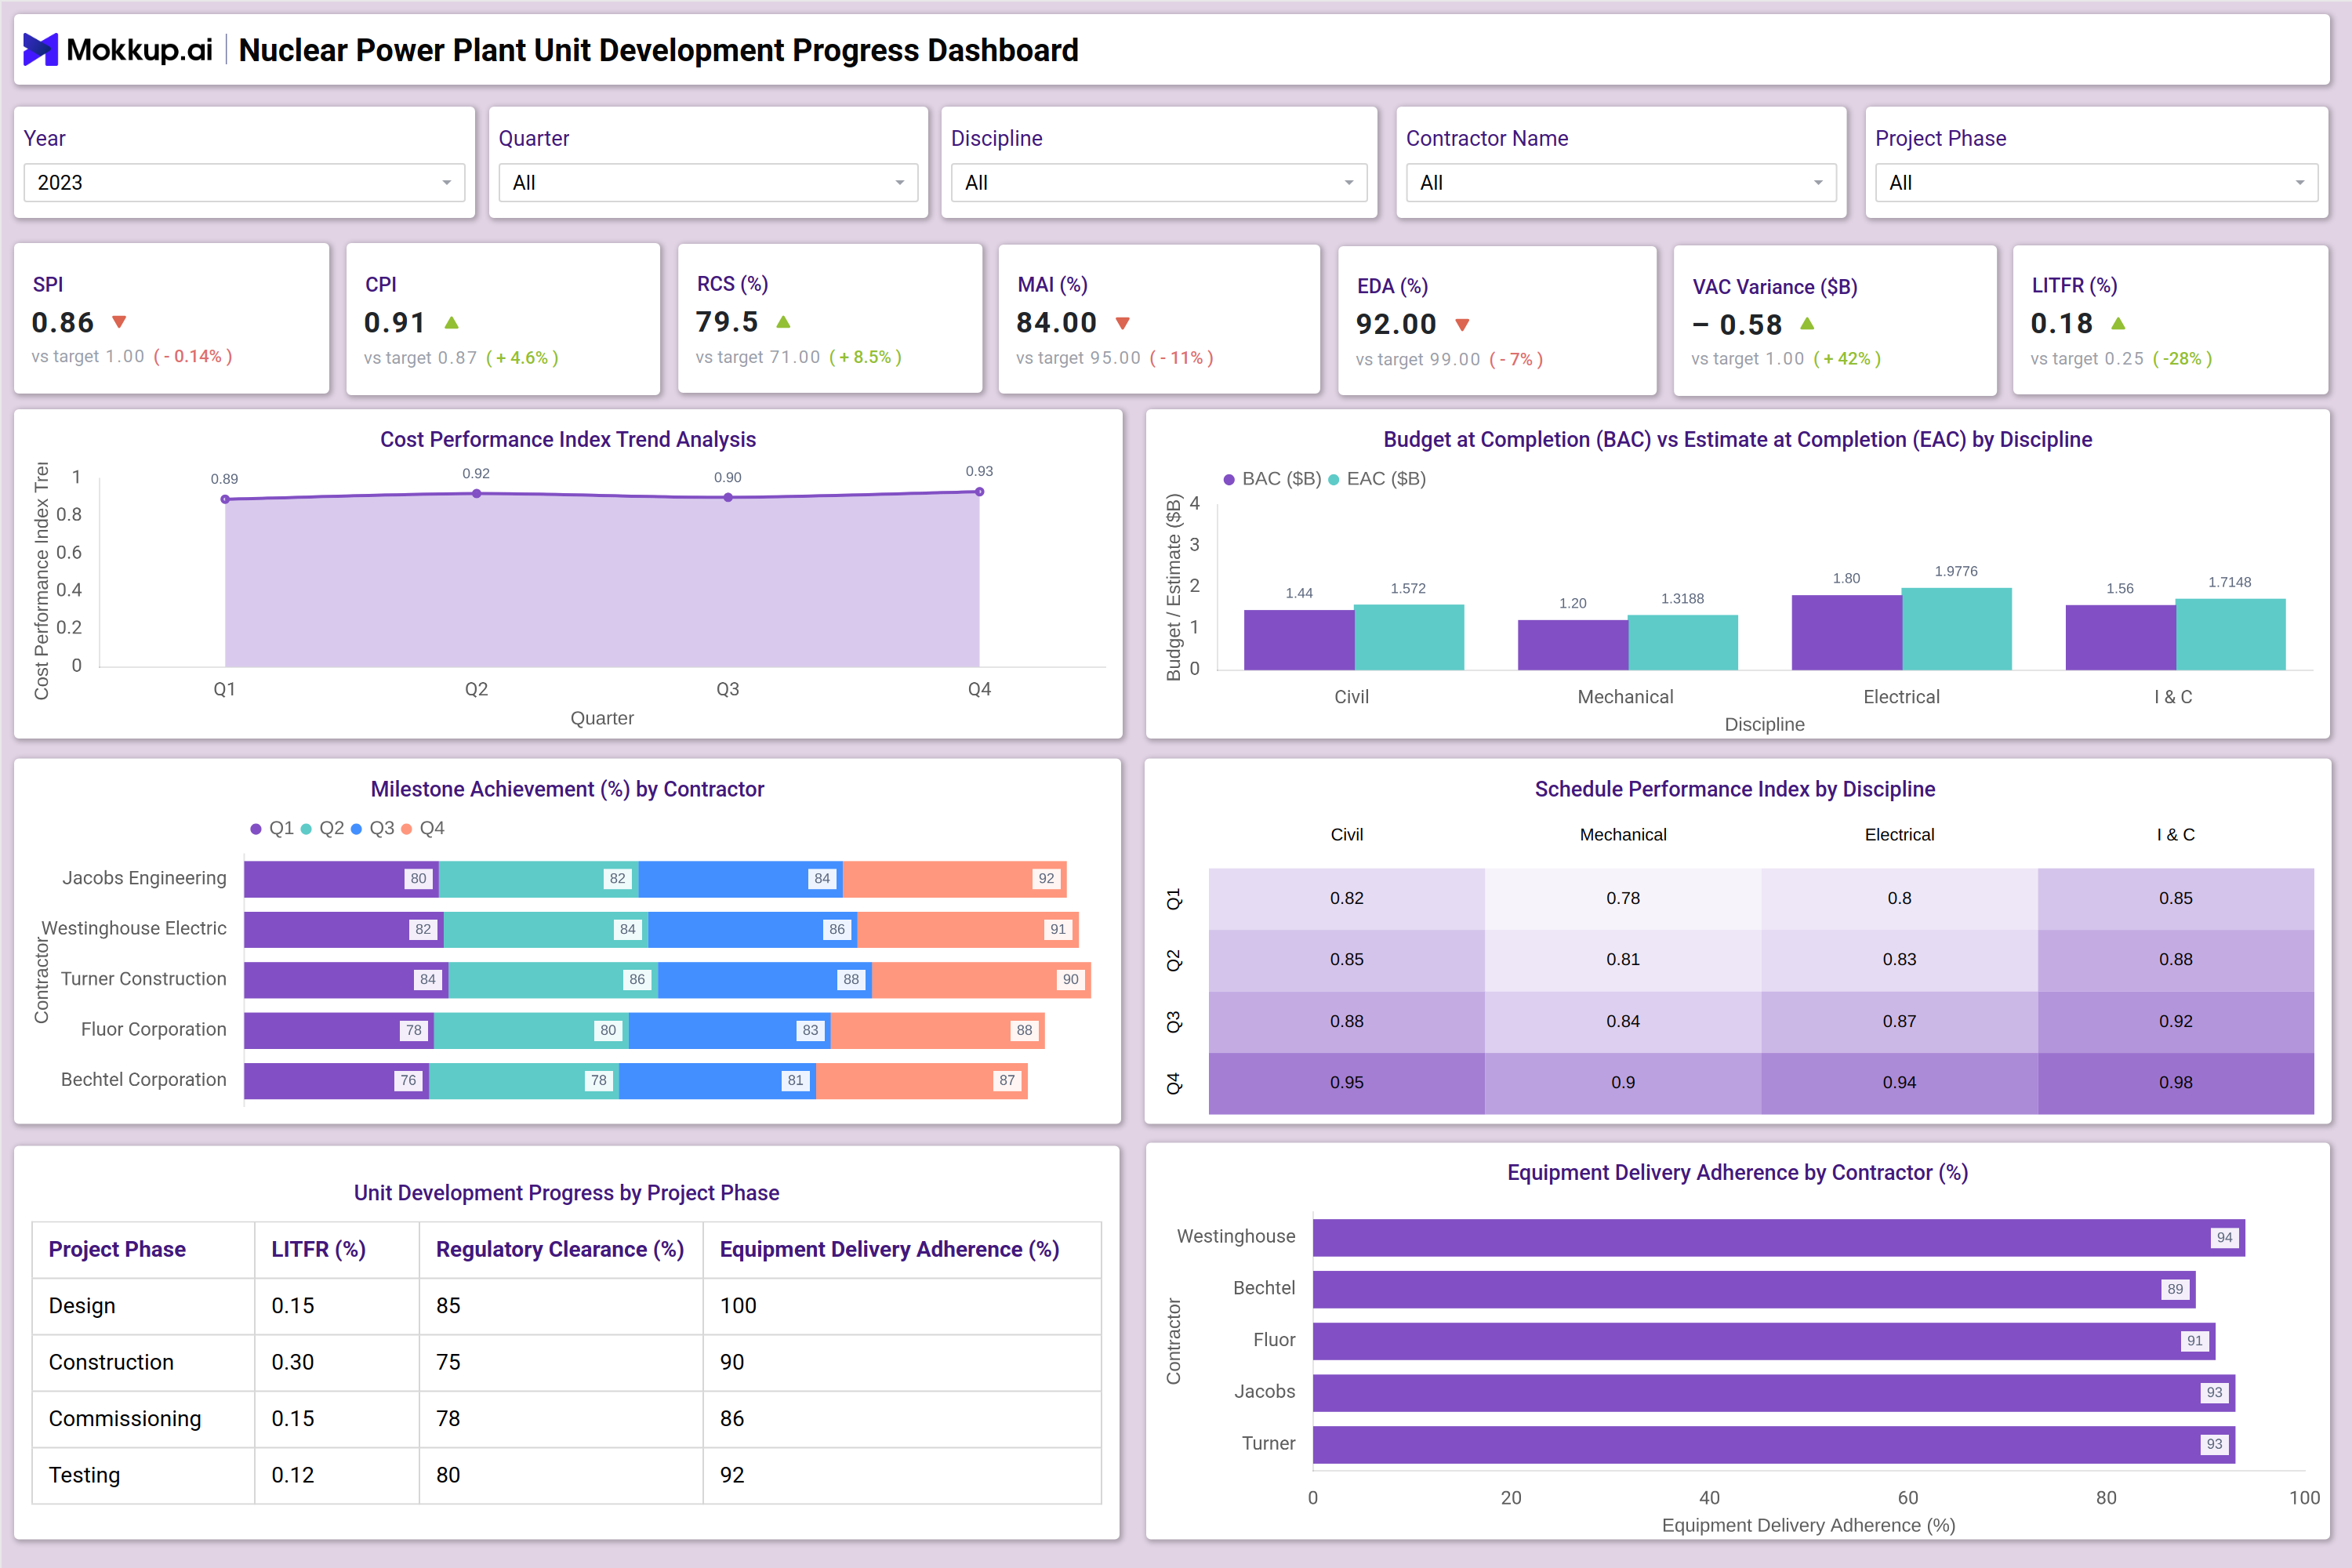
A Nuclear Power Plant Unit Development Progress Dashboard provides a centralized view of construction status, performance indicators, and operational readiness metrics for each phase of project progress. The dashboard integrates data from civil, mechanical, electrical, and instrumentation teams while tracking both cost and schedule performance. It also measures milestone achievement by contractor, unit readiness indicators, and safety performance metrics such as LITFR (Lost Time Injury Frequency Rate). This type of dashboard is crucial for nuclear plant operators and EPC contractors, as it replaces siloed spreadsheets with a unified reporting tool. Analytics improve control over construction progress, equipment delivery adherence, and commissioning efficiency. By providing accurate Earned Value Management (EVM) insights, including CPI, SPI, EAC, and VAC, the dashboard facilitates informed decision-making based on measurable project performance. For a nuclear project environment where deviations can impact regulatory compliance and operational targets, this dashboard becomes a core element of project governance.
How to Analyze Data in a Nuclear Power Plant Unit Development Progress Dashboard
The Nuclear plant construction progress monitoring system will analyze data in the following ways:
- Provides unified monitoring of construction, commissioning, testing, and regulatory clearance progress.
- Tracks Earned Value Management metrics such as SPI, CPI, and VAC for performance visibility.
- Visualizes milestone achievement across contractors and engineering disciplines.
- Includes cost variance and schedule variance analysis.
- Displays equipment delivery adherence for key suppliers and engineering partners.
- Offers year-wise and quarter-wise filtering for trend analysis.
- Supports multi-discipline reporting: civil, mechanical, electrical, and instrumentation & control.
- Highlights safety performance metrics, including LITFR across project phases.
- Offers variance-based alerts to identify performance gaps early.
- Enables transparent reporting of the nuclear project lifecycle for all stakeholders.
Benefits of a Nuclear Power Plant Unit Development Progress Dashboard
The following are the benefits of using this nuclear project lifecycle monitoring and reporting tool:
- Centralized project visibility: Eliminates fragmented reporting and provides a single source of truth for nuclear project stakeholders.
- Improved schedule control: Helps detect delays early by monitoring SPI trends and milestone progress.
- Accurate cost management: Tracks CPI, EAC, and forecast variances to reduce budget overruns.
- Contractor performance evaluation: Provides detailed insights into contractor execution efficiency and milestone achievement.
- Regulatory readiness tracking: Ensures compliance through structured monitoring of regulatory clearance progress.
- Enhanced risk mitigation: Early identification of performance gaps reduces safety and compliance risks.
- Data-driven decision-making: Analytics enable executives and engineers to make more accurate and timely decisions.
- Higher equipment reliability: Ensures equipment delivery adherence is tracked to maintain construction continuity.
- Better reporting efficiency: Automates progress reports and reduces manual data preparation.
- Supports nuclear safety standards: Aligns project execution with mandatory safety and operational requirements.
KPIs to Track in a Nuclear Power Plant Unit Development Progress Dashboard
The advanced dashboard for Nuclear power unit construction tracking includes KPIs like:
- SPI (Schedule Performance Index): Measures the project's adherence to planned schedules in terms of efficiency.
- CPI (Cost Performance Index): Evaluates cost efficiency in relation to approved budgets.
- RCS (Regulatory Compliance Status): Evaluates resource compliance percentage for engineering and construction teams.
- MAI (Milestone Achievement Index): Tracks milestone achievement percentages across all project phases.
- EDA (Equipment Delivery Adherence): Measures the adherence to equipment delivery for each contractor or vendor.
- VAC (Variance at Completion): Displays the projected cost variance compared to the baseline plans.
- LITFR (Lost Time Injury Frequency Rate): Tracks safety performance by monitoring lost-time injury frequency.
Frequently Asked Questions
1. Why is a development progress dashboard necessary for nuclear power plant projects?
Nuclear projects involve strict safety, schedule, and regulatory requirements. A dashboard centralizes progress tracking, improves compliance monitoring, and reduces the risk of delays or cost overruns.
2. Is this dashboard suitable for multi-unit nuclear power projects?
Absolutely. It can scale across multiple units, disciplines, and contractors while maintaining structured reporting.
3. Which teams benefit the most from this dashboard?
Engineering teams, EPC contractors, project managers, regulatory compliance teams, and executive leadership.