
What is a Nuclear Power Plant Reactor & Generation Performance Dashboard?
A Nuclear Power Plant Reactor & Generation Performance Dashboard is a centralized monitoring system that brings together all critical reactor, thermal, and electrical generation metrics in one interface. It supports nuclear reactor performance monitoring by visualizing thermal output, efficiency levels, coolant temperature differentials, pressure stability, and control rod movement. The dashboard also integrates nuclear power generation analytics to track turbine efficiency, capacity factors, grid contribution, heat rate, and electrical output trends. With real-time visibility into reactor operations and power generation conditions, operators can detect performance deviations early, ensure stable thermal behavior, and maintain regulatory-compliant safety margins. This type of nuclear reactor operational dashboard improves accuracy in decision-making for plant managers, engineers, and operations teams responsible for high-reliability energy production.
How to Create a Nuclear Power Plant Reactor & Generation Performance Dashboard
You don’t need to build your report from scratch—just start with a ready-to-use dashboard template from Mokkup. Add in your data and export it however you like. Here’s how to do it:
1. Create or Log in to Your Mokkup Account
Start by signing up on Mokkup.ai using your email. If you already have an account, just log in, and you’ll be good to go.
2. Choose and Customize Your Dashboard Template
Find the Nuclear Power Plant Reactor & Generation Performance Dashboard template in the Templates section. Use the drag-and-drop editor to adjust KPIs, edit filters, or add elements based on your data.
3. Export to Your BI Tool
Once your dashboard wireframe is ready, use the BI Tool Export feature to send it directly to Power BI or Tableau for further analysis and enhancements. You can also download the dashboard as a PDF, PNG, or JPEG, embed it on a platform, or invite your team to collaborate.
Note: This is a Pro template. You’ll need a Pro subscription on Mokkup to use and customize this dashboard wireframe. Upgrade anytime to unlock full access.
Nuclear Power Plant Reactor & Generation Performance Dashboard Example
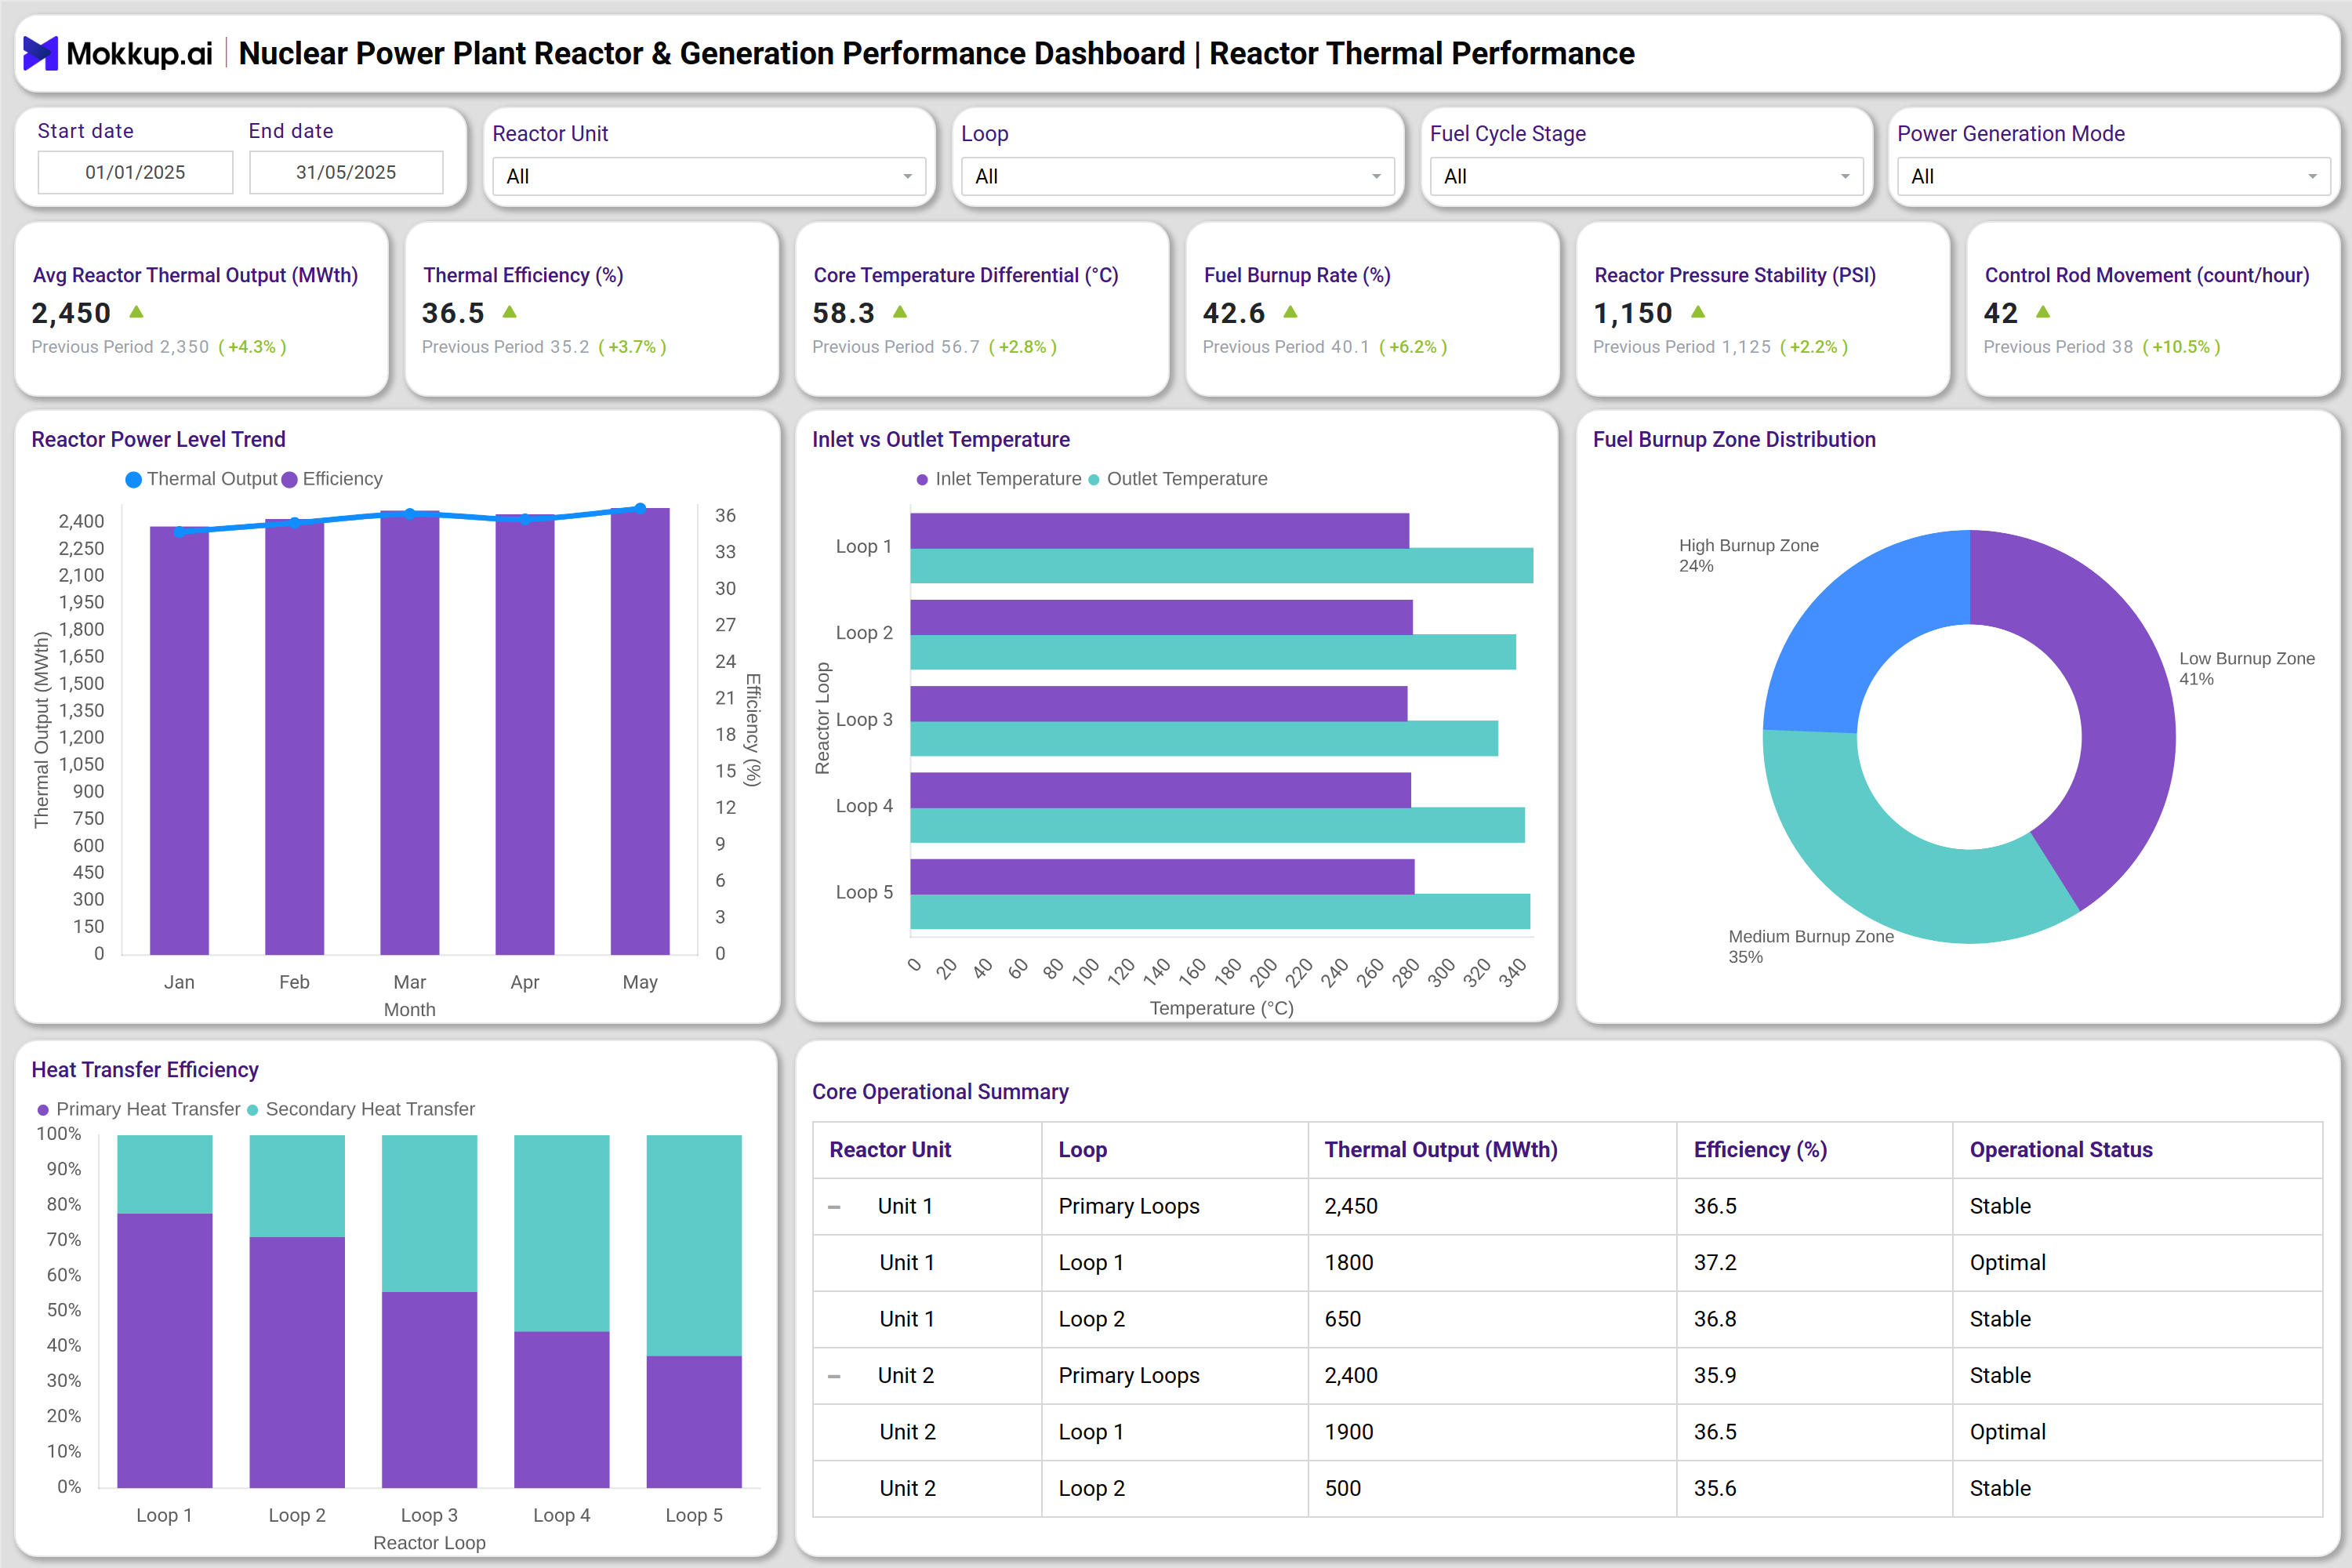
A typical dashboard includes multiple layers of operational insights from both the reactor and turbine-generator systems. For example, the Reactor Thermal Performance dashboard displays metrics such as average reactor thermal output, thermal efficiency, core temperature differential, fuel burnup rate, pressure stability, and control rod movement. It also presents inlet versus outlet temperature comparisons across cooling loops and heat transfer efficiency across primary and secondary sides.
The Turbine–Generator Performance & Electrical Output dashboard complements this by tracking average electrical output, turbine efficiency by stage, net capacity factor, grid availability, forced outage rate, and grid contribution mix. Detailed metrics, such as heat rate, auxiliary power consumption, and output by turbine stage, allow engineers to conduct reactor energy output tracking and reactor temperature deviation analysis with precision. Together, the dashboards provide a unified view of reactor-to-grid performance, helping nuclear facilities optimize energy generation while maintaining safety and regulatory compliance.
How to Analyze Data in a Nuclear Power Plant Reactor & Generation Performance Dashboard
Here’s how to break down the key performance signals in a reactor-generation dashboard:
- Track Reactor Thermal Output: Review monthly heat-generation trends to confirm consistent reactor performance.
- Compare Thermal Efficiency Across Units: Spot units operating below baseline efficiency and identify where energy losses occur.
- Monitor Core Temperature Differential: Check whether heat-transfer values stay within safe and expected thresholds.
- Analyze Fuel Burnup Distribution: Evaluate how uniformly the core is consuming fuel to assess fuel-cycle efficiency.
- Review Inlet vs Outlet Coolant Temperatures: Measure cooling-loop performance through coolant heat-absorption patterns.
- Monitor Reactor Pressure Stability: Use pressure trends to understand system balance and internal reactivity behavior.
- Check Control Rod Movement Rates: Identify unusual adjustments that may indicate shifts in load or reactivity.
Benefits of a Nuclear Power Plant Reactor & Generation Performance Dashboard
Here’s what this kind of dashboard helps plant teams accomplish:
- Centralizes All Reactor and Generation Metrics: Gives operators a single view of core performance, thermal output, and electrical generation.
- Improves Operational Decision-Making: Delivers real-time analytics that support faster, more informed reactor and turbine adjustments.
- Detects Temperature and Pressure Deviations Early: Continuous monitoring highlights shifts before they affect stability or safety.
- Enhances Energy Output Tracking: Makes it easier to optimize plant-wide thermal and electrical performance.
- Strengthens Regulatory Compliance: Provides detailed operational visibility that aligns with reporting and audit requirements.
- Improves Equipment Reliability: Surfaces abnormal performance trends in both reactor and turbine systems.
- Reduces Forced Outages: Supports proactive assessments that lower the likelihood of unplanned shutdowns.
KPIs to Track in a Nuclear Power Plant Reactor & Generation Performance Dashboard
- Avg Reactor Thermal Output (MWth): Measures the reactor’s Average heat generation performance.
- Thermal Efficiency (%): Indicates how effectively thermal energy is converted into usable output.
- Core Temperature Differential (°C): Tracks temperature changes across the reactor core for heat transfer monitoring.
- Fuel Burnup Rate (%): Measures the rate at which nuclear fuel is consumed and depleted.
- Reactor Pressure Stability (PSI): Shows pressure consistency inside the reactor vessel.
- Turbine Efficiency (%): Measures mechanical-to-electrical conversion efficiency.
- Heat Rate (BTU/kWh): Evaluates thermal efficiency of power conversion.
Frequently Asked Questions
1. What is a Nuclear Power Plant Reactor and Generation Performance Dashboard used for?
It’s a centralized system that tracks key reactor metrics like thermal output, efficiency, coolant temperatures, pressure stability, and fuel burnup. It also monitors power-generation factors such as turbine efficiency, heat rate, capacity factor, and electrical output. The dashboard helps operators detect anomalies early, maintain safety margins, and improve overall plant performance.
2. How does a Nuclear Reactor Performance Dashboard improve safety and reliability?
By providing real-time visibility into temperature deviations, pressure fluctuations, cooling-loop performance, and control-rod activity, the dashboard allows teams to spot risks before they escalate. Continuous monitoring reduces forced outage rates, strengthens regulatory compliance, and supports more accurate operational decision-making.
3. Why is monitoring turbine efficiency and heat rate important in nuclear power plants?
Turbine efficiency and heat rate show how effectively thermal energy is being converted into electrical power. Tracking these KPIs helps identify energy losses, optimize power output, reduce operational costs, and ensure the plant maintains high performance from reactor to grid.