
What is a Neurology Research & Innovation Dashboard?
A Neurology Research & Innovation Dashboard is a centralized tool designed for research leadership and clinical administrators to monitor the performance and progress of neurology-focused research initiatives. It provides visibility into active projects, trial completion rates, patient recruitment, publication outputs, compliance adherence, and funding utilization. Unlike scattered reports, this dashboard wireframe acts as a comprehensive neurology research performance dashboard, helping institutions track research efficiency, scientific output, and financial accountability in one place.
How to Create a Neurology Research & Innovation Dashboard
You don't need to build your report from scratch—just start with a ready-to-use Neurology Research & Innovation Dashboard template from Mokkup. Add in your data and export it however you like. Here’s how to do it:
1. Create or Log in to Your Mokkup Account
Start by signing up on Mokkup.ai using your email. If you already have an account, just log in, and you’ll be good to go.
2. Choose and Customize Your Dashboard Template
Find the Neurology Research & Innovation Dashboard template in the Templates section. Use the drag-and-drop editor to adjust KPIs, edit filters, or add elements based on your data.
3. Export to Your BI Tool
Once your dashboard wireframe is ready, use the BI Tool Export feature to send it directly to Power BI or Tableau for further analysis and enhancements. You can also download the dashboard as a PDF, PNG, or JPEG, embed it on a platform, or invite your team to collaborate.
Note: This is a Pro template. You’ll need a Pro subscription on Mokkup to use and customize this dashboard wireframe. Upgrade anytime to unlock full access.
Neurology Clinics Research Dashboard Example
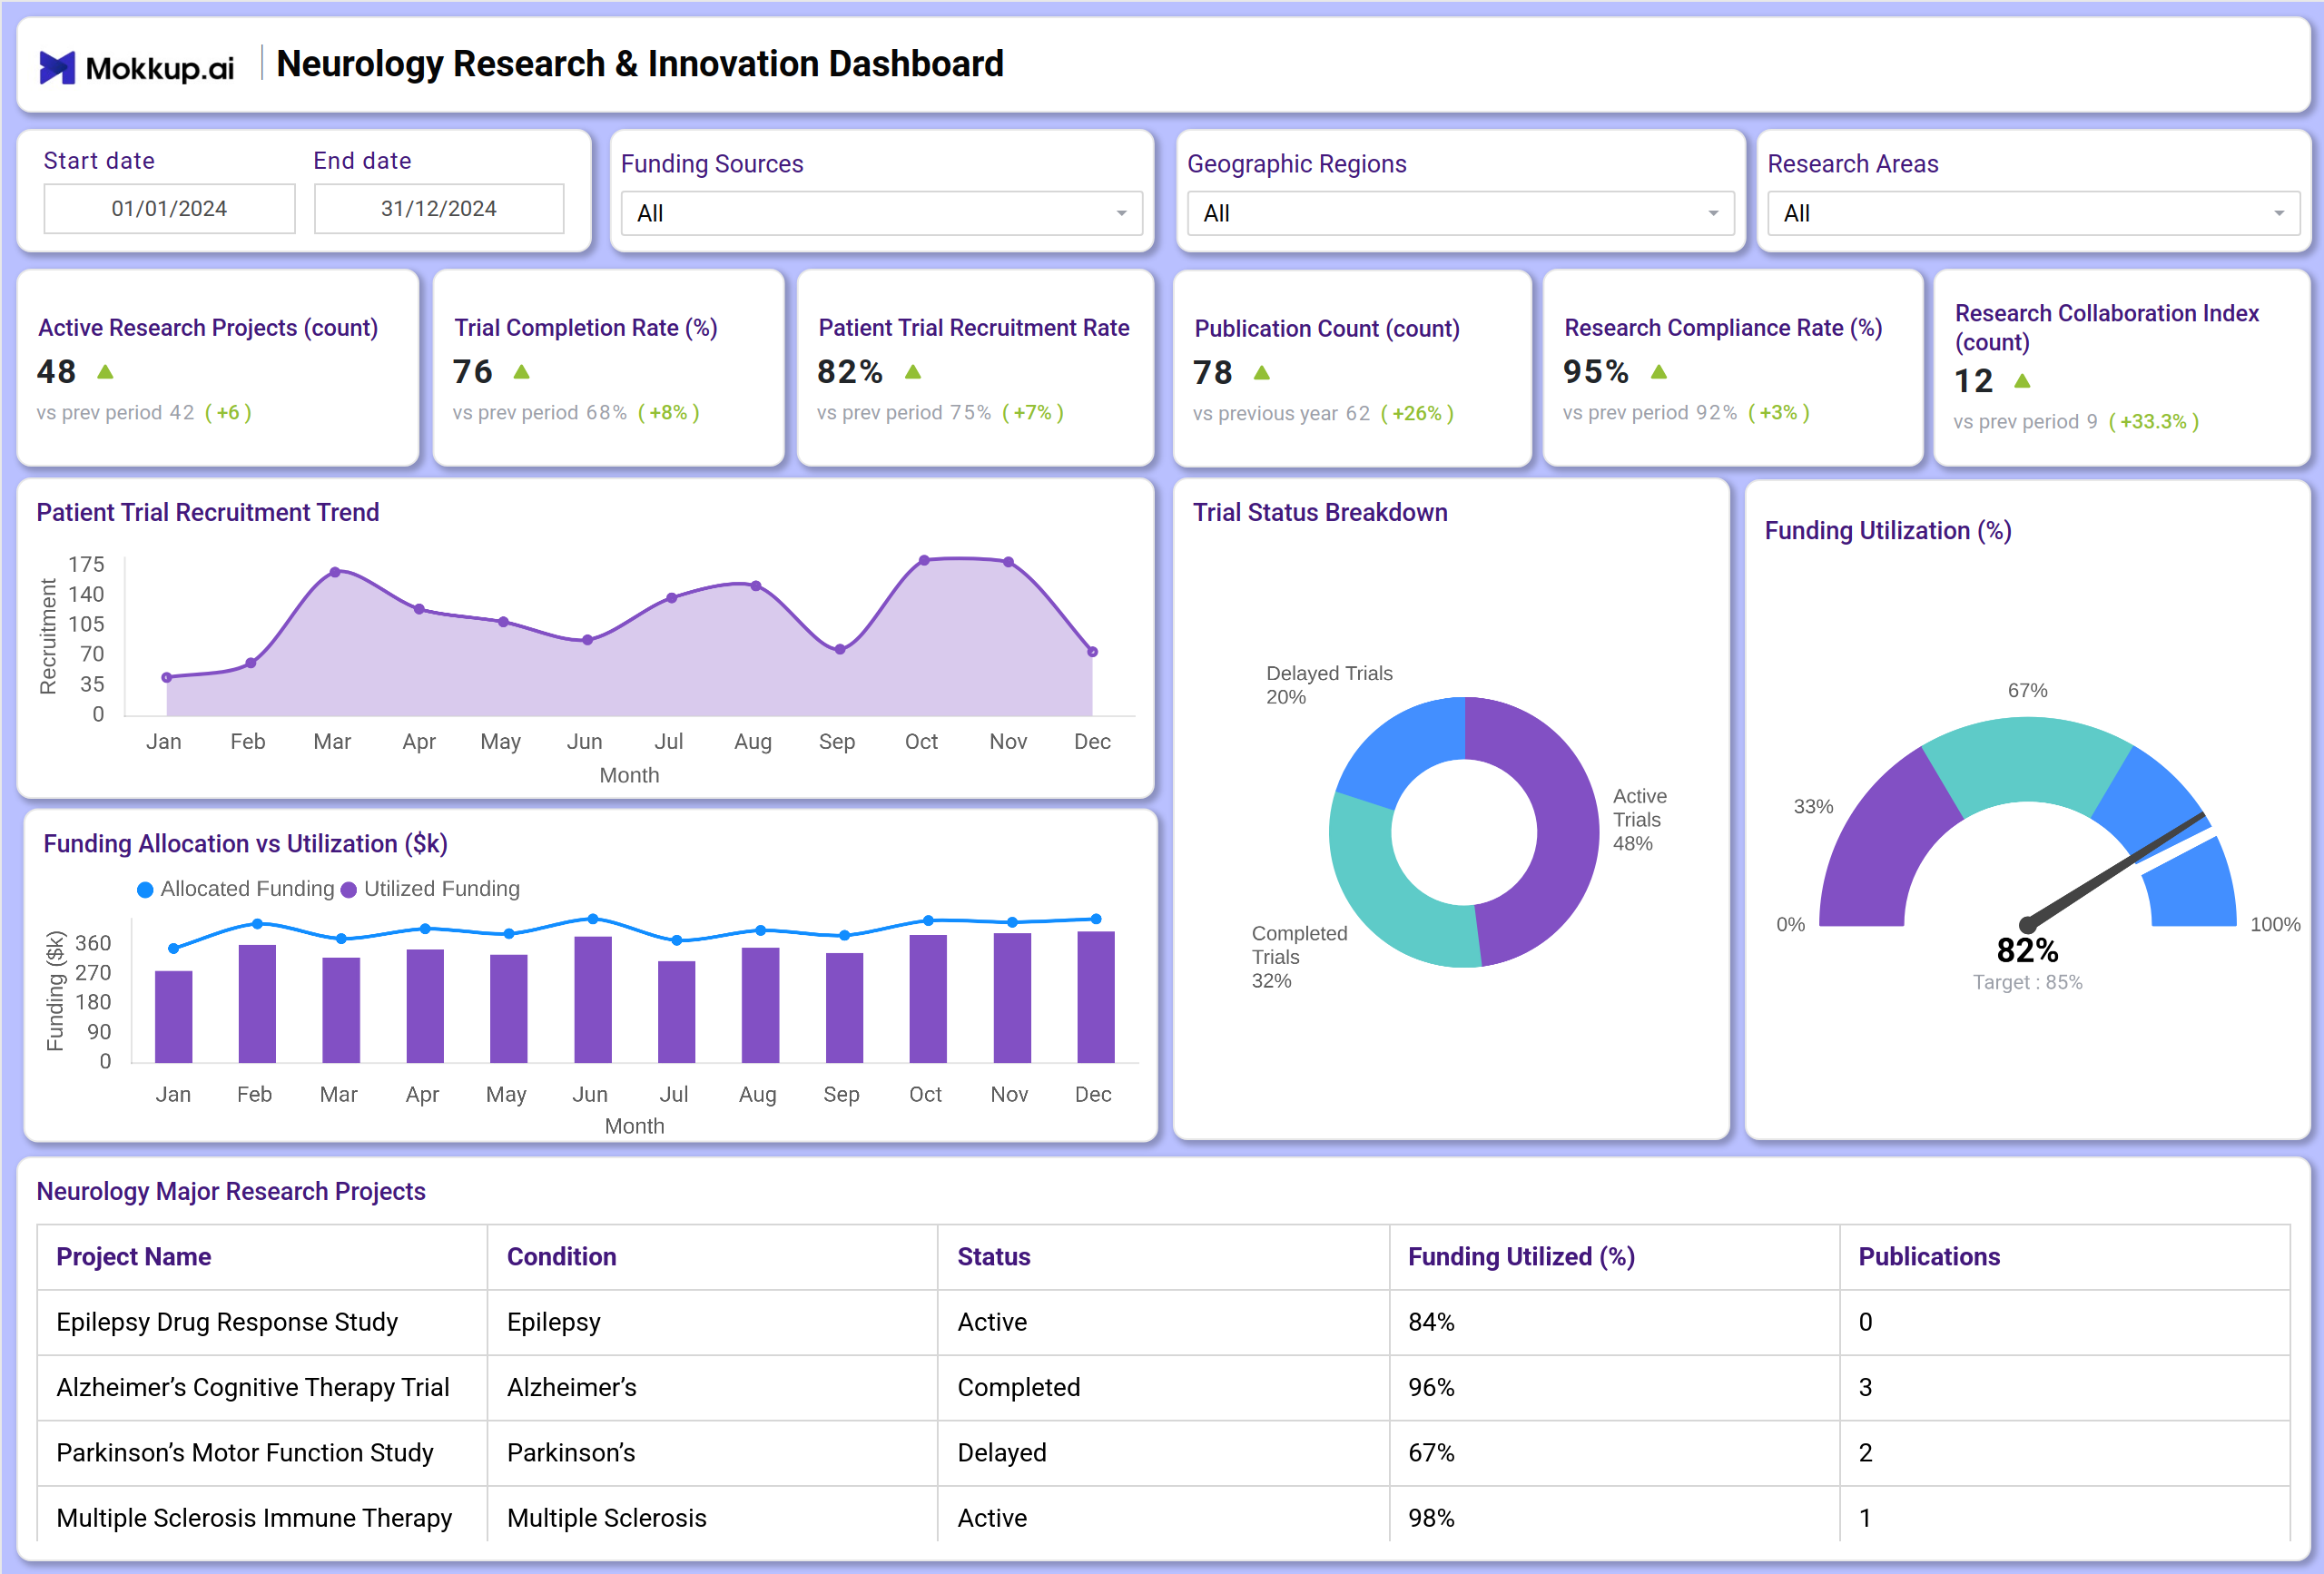
You can create a Neurology Research & Innovation Dashboard with a mix of KPI tiles and visualizations. At the top, KPI cards track key metrics such as active research projects, trial completion rate, patient recruitment, publication count, compliance, and collaboration. Below that, charts show trends in patient recruitment over time, funding allocation versus utilization, and a breakdown of trial statuses. A data table provides a detailed view of major projects, their conditions, status, and outputs. Together, this dashboard wireframe works as a dashboard for tracking neurology research metrics, ensuring leadership gets both scientific and operational visibility.
How to Analyze Data in Neurology Research & Innovation Dashboard
Use the dashboard template to gain actionable insights into neurology research activities and ensure projects are efficient, impactful, and compliant:
- Monitor Project Portfolio: Track the number of active projects and their status (active, delayed, completed) to manage the research pipeline.
- Assess Trial Efficiency: Analyze the trial completion rate and patient recruitment rate to identify bottlenecks and improve study timelines.
- Measure Scientific Impact: Review publication count and trends to gauge the productivity and academic contribution of research efforts.
- Ensure Regulatory Adherence: Keep the research compliance rate high to meet ethical and regulatory standards.
- Track Financial Stewardship: Compare funding allocation vs. utilization to ensure budgets are spent effectively and identify projects with under- or over-utilization.
- Evaluate Collaboration: Use the research collaboration index to understand partnership engagement across different studies.
Benefits of Neurology Research & Innovation Dashboard
This dashboard wireframe provides research leaders with a centralized, actionable view of neurology research, helping improve efficiency, accountability, and strategic planning:
- Centralized Project Visibility: A single source of truth for all neurology research activities and their progress.
- Improved Trial Management: Identifies delays and recruitment challenges early, allowing for proactive interventions.
- Enhanced Funding Accountability: Tracks budget allocation and spending, making it a vital neurology research financial oversight dashboard.
- Output and Impact Tracking: Monitors key outputs like publications and collaborations to demonstrate research value.
- Compliance & Reporting: Simplifies audit preparation and regulatory reporting, serving as an essential neurology research compliance and reporting dashboard.
- Strategic Decision Support: Provides the data needed to make informed decisions about which research areas to fund and expand.
Together, these elements provide leadership with a clear overview of research performance, making it easier to align scientific goals with operational capabilities. That’s why many clinical research leaders call it the best dashboard for neurology research when aiming to scale research quality and output.
KPIs to Track in Neurology Research & Innovation Dashboard
These KPIs help evaluate research productivity, compliance, and resource utilization across all neurology projects:
- Active Research Projects (count): The total number of ongoing research studies, indicating the volume and scale of research activity.
- Trial Completion Rate (%): The percentage of trials finished on schedule, reflecting operational efficiency and planning.
- Patient Trial Recruitment Rate (%): The proportion of the target number of patients successfully enrolled in trials.
- Publication Count (count): The total number of research papers published, measuring academic output and dissemination.
- Research Compliance Rate (%): Adherence to regulatory, ethical, and institutional guidelines across all studies.
- Research Collaboration Index (count): A measure of partnership involvement, often counting internal or external collaborators on projects.
- Funding Utilization (%): The percentage of allocated budget that has been spent, crucial for financial management.
Frequently Asked Questions
Q1. Who should use a Neurology Research & Innovation Dashboard?
Research directors, principal investigators, clinic administrators, and grant managers oversee neurology research strategy and performance.
Q2. Can this dashboard help improve research efficiency?
Yes. By highlighting delays, recruitment issues, and budget variances, leadership can proactively address bottlenecks and optimize processes.
Q3. How does it support grant reporting and compliance?
It consolidates key performance and financial metrics required by funders and regulators, making it an effective neurology research compliance and reporting dashboard.
Q4. Is this dashboard useful for demonstrating research impact?
Absolutely. It tracks tangible outputs like publications and completed trials, which are critical for annual reports, grant renewals, and institutional reputation.