
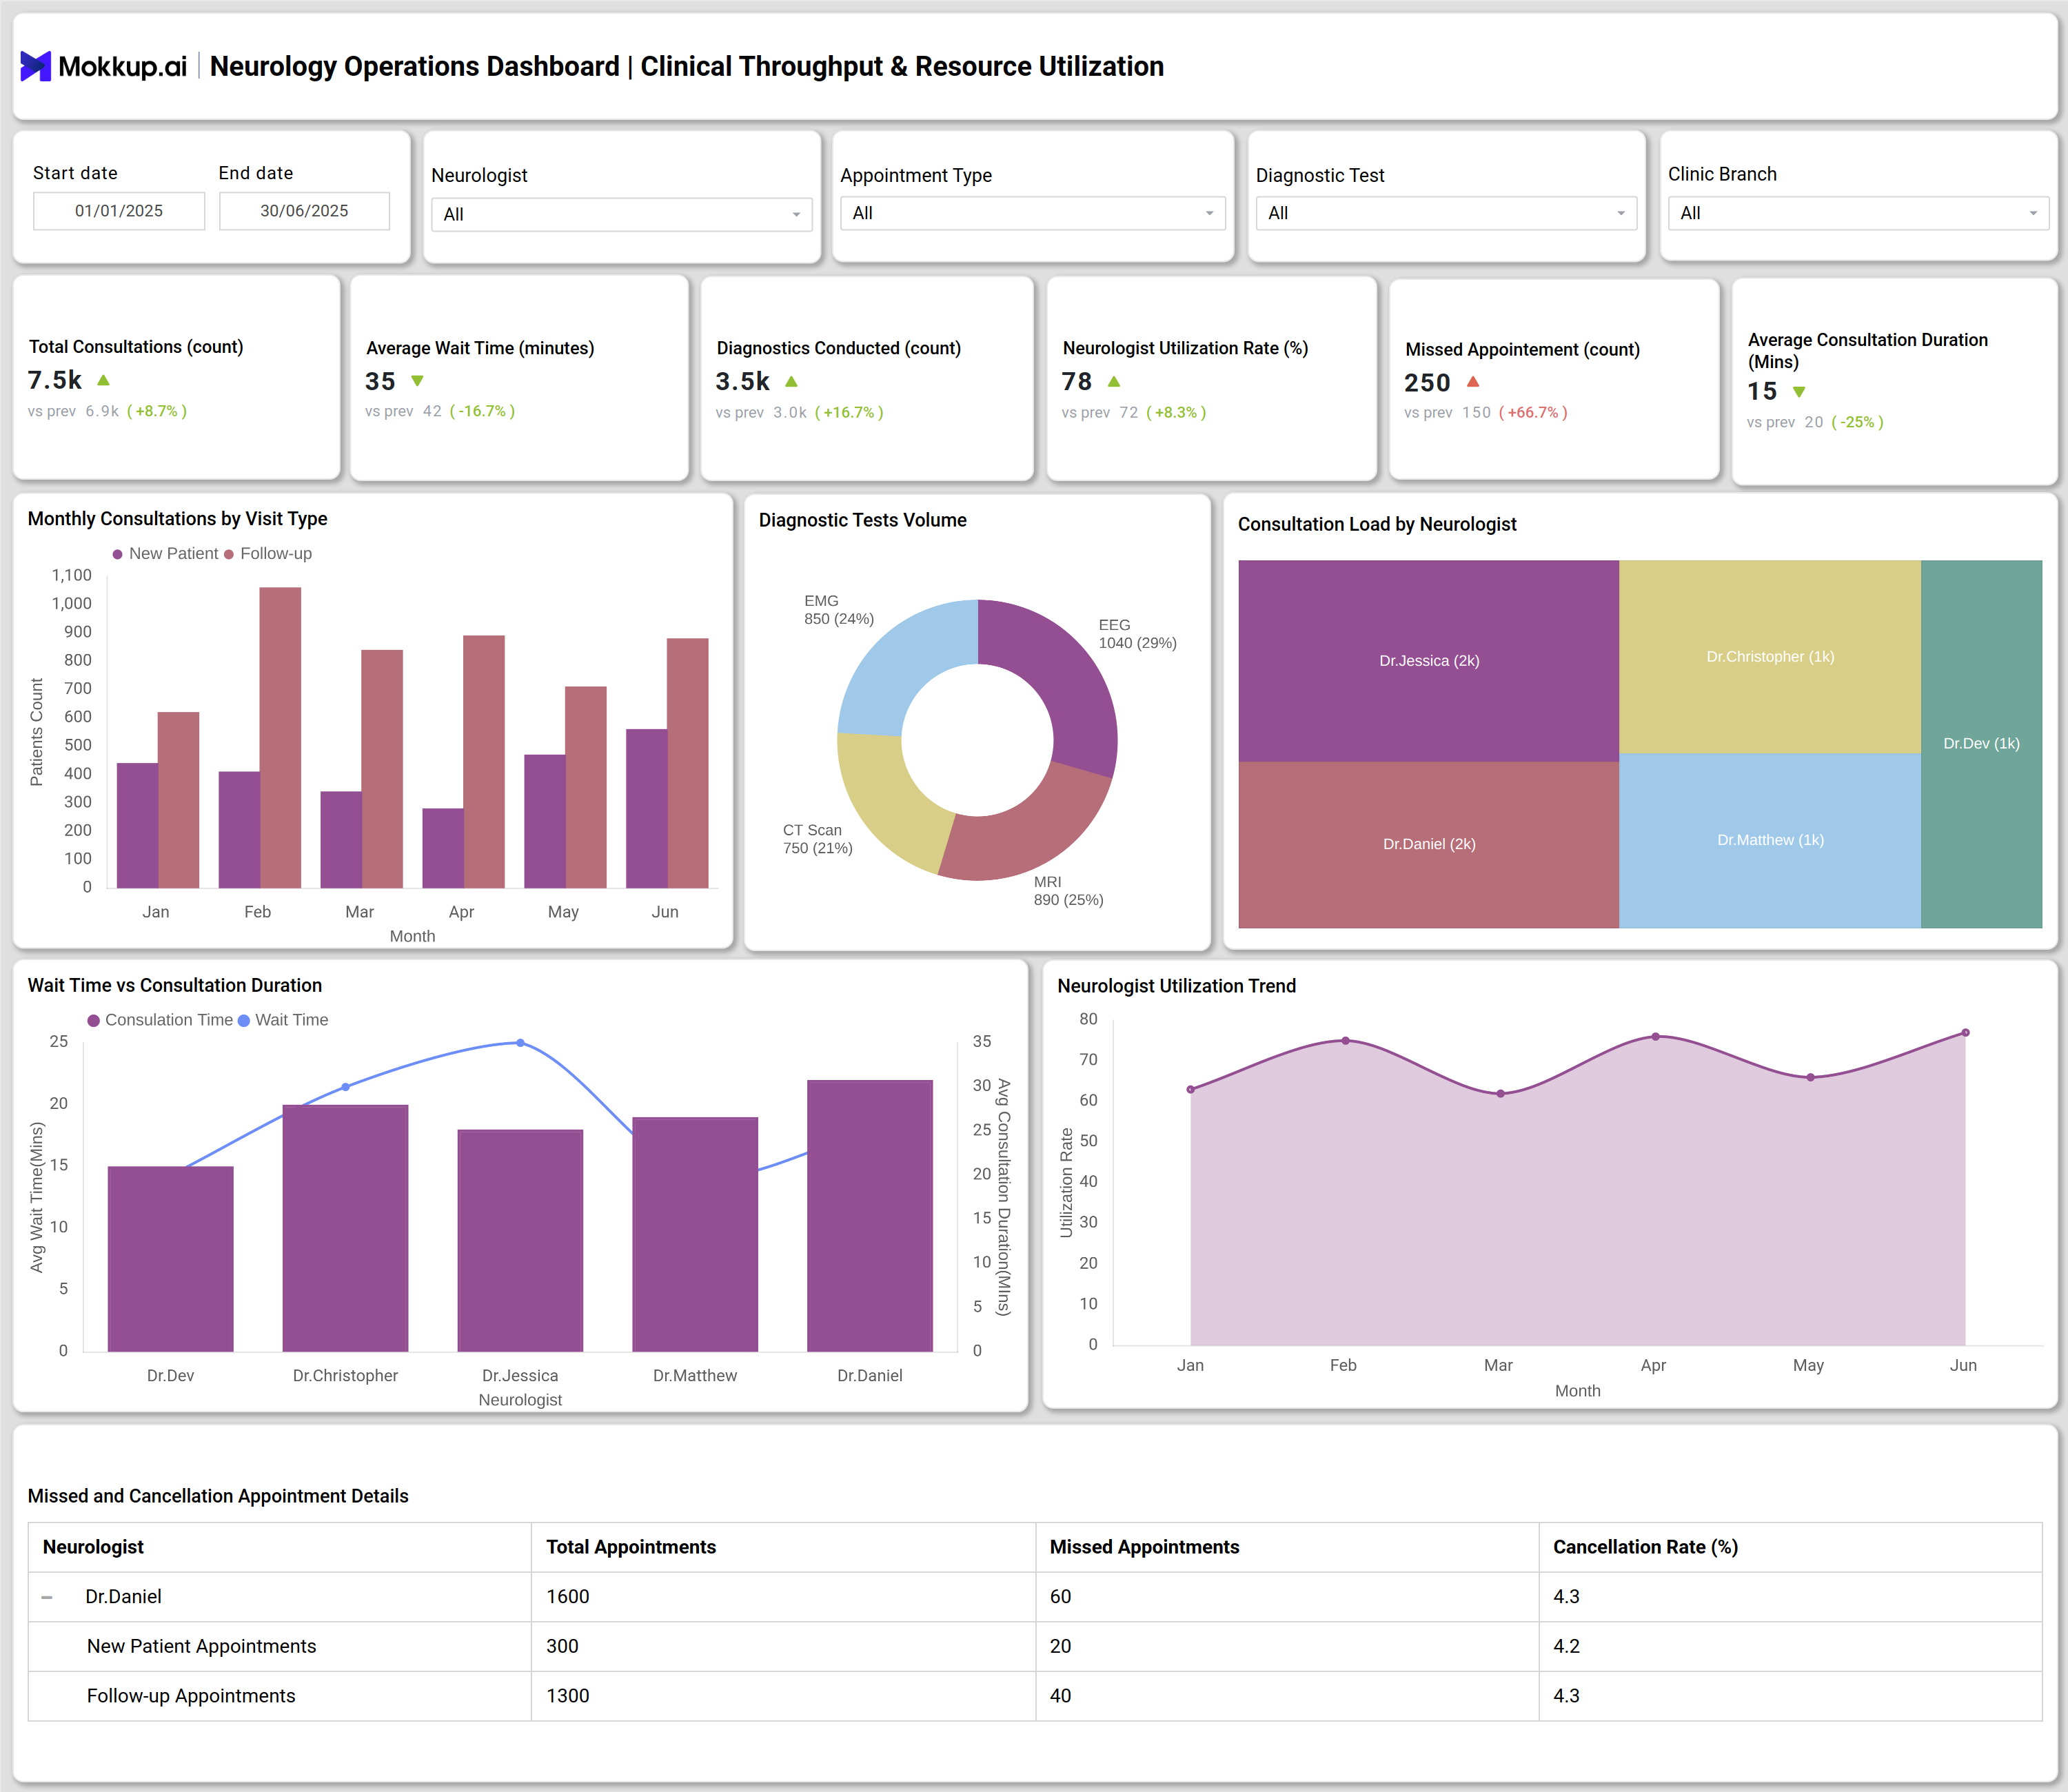
What is a Neurology Operations Dashboard?
A Neurology Operations Dashboard is a centralized platform tailored for neurology clinics, providing a comprehensive overview of clinic performance, patient management, and operational efficiency. These dashboards integrate neurology practice analytics and present key metrics so healthcare professionals can track trends, streamline workflows, and make data-driven decisions. By collecting real-time data across case tracking, patient flows, and treatment outcomes, a Neurology Operations Dashboard offers actionable insights that align with both clinical and administrative goals.
How to Create a Neurology Operations Dashboard
You don’t need to build your report from scratch—just start with a ready-to-use dashboard template from Mokkup. Add in your data and export it however you like. Here’s how to do it:
1. Create or Log in to Your Mokkup Account
Start by signing up on Mokkup.ai using your email. If you already have an account, just log in, and you’ll be good to go.
2. Choose and Customize Your Dashboard Template
Find the Neurology Operations Dashboard template in the Templates section. Use the drag-and-drop editor to adjust KPIs, edit filters, or add elements based on your data.
3. Export to Your BI Tool
Once your dashboard wireframe is ready, use the BI Tool Export feature to send it directly to Power BI or Tableau for further analysis and enhancements. You can also download the dashboard as a PDF, PNG, or JPEG, embed it on a platform, or invite your team to collaborate.
Note: This is a Pro template. You’ll need a Pro subscription on Mokkup to use and customize this dashboard wireframe. Upgrade anytime to unlock full access.
Neurology Operations Dashboard Example
An effective Neurology Operations Dashboard brings together detailed metrics and visualizations relevant to neurology clinics. For example, leading dashboards display total active cases, therapy session distribution, recovery time, compliance rates, and relapse tracking. Clinic administrators and neurologists can monitor average wait times, appointment loads, and diagnostic test volumes, ensuring that all aspects of neurology patient management are transparent. This analytic view supports operational teams in enhancing neurology case tracking systems while improving neurology treatment outcomes through continuous monitoring and adjustments.
How to Analyze Data in Neurology Operations Dashboards
Healthcare providers can leverage the Neurology Operations dashboard template by:
- Examine monthly trends in therapy sessions, follow-up compliance, and relapse rates to identify patterns of performance.
- Compare neurologist utilization rates and appointment wait times across different periods for resource planning.
- Use diagnostic test volumes and case distribution metrics to allocate resources and optimize workflow.
- Track medication adherence and average recovery times to assess the quality of care and patient engagement.
- Monitor KPIs for outliers, sudden changes, or performance drops to trigger targeted interventions.
Benefits of Neurology Operations Dashboards
These are the benefits of using the Neurology Operations Dashboards:
- Improves neurology clinic performance by centralizing all operational and clinical data for quick access.
- Supports evidence-based decision-making with real-time neurology healthcare analytics.
- Reduces manual reporting by automating the collection and visualization of neurology practice analytics.
- Enhances neurology patient management through better scheduling, follow-up, and outcome tracking.
- Optimizes workflows in both clinical and administrative functions for sustained efficiency.
KPIs to Track in Neurology Operations Dashboards
- Total Active Cases: Number of patients currently receiving neurology care.
- Average Recovery Time: Mean recovery period measured in days for completed cases.
- Therapy Sessions Distribution: Breakdown of therapy types and sessions delivered.
- Monthly Follow-Up Compliance Rate: Percentage of patients attending scheduled follow-ups.
- Relapse Cases: Count of patients experiencing a clinical relapse post-discharge.
- Neurologist Utilization Rate: Degree to which neurology staff are booked relative to availability.
Frequently Asked Questions
1. How does a Neurology Operations Dashboard help clinics?
It provides a single view of clinic operations, supports better scheduling, enhances patient management, and allows timely interventions based on real-time data using neurology case tracking systems.
2. What makes these dashboards different from other medical dashboards?
They are designed with neurology-specific workflows, emphasizing metrics like therapy efficiency, relapse tracking, and diagnostic test volumes that matter most to neurology patient management.
3. Who should use a Neurology Operations Dashboard?
Clinic administrators, neurologists, data analysts, and operations managers should use these dashboards for monitoring and improving neurology clinic performance.