
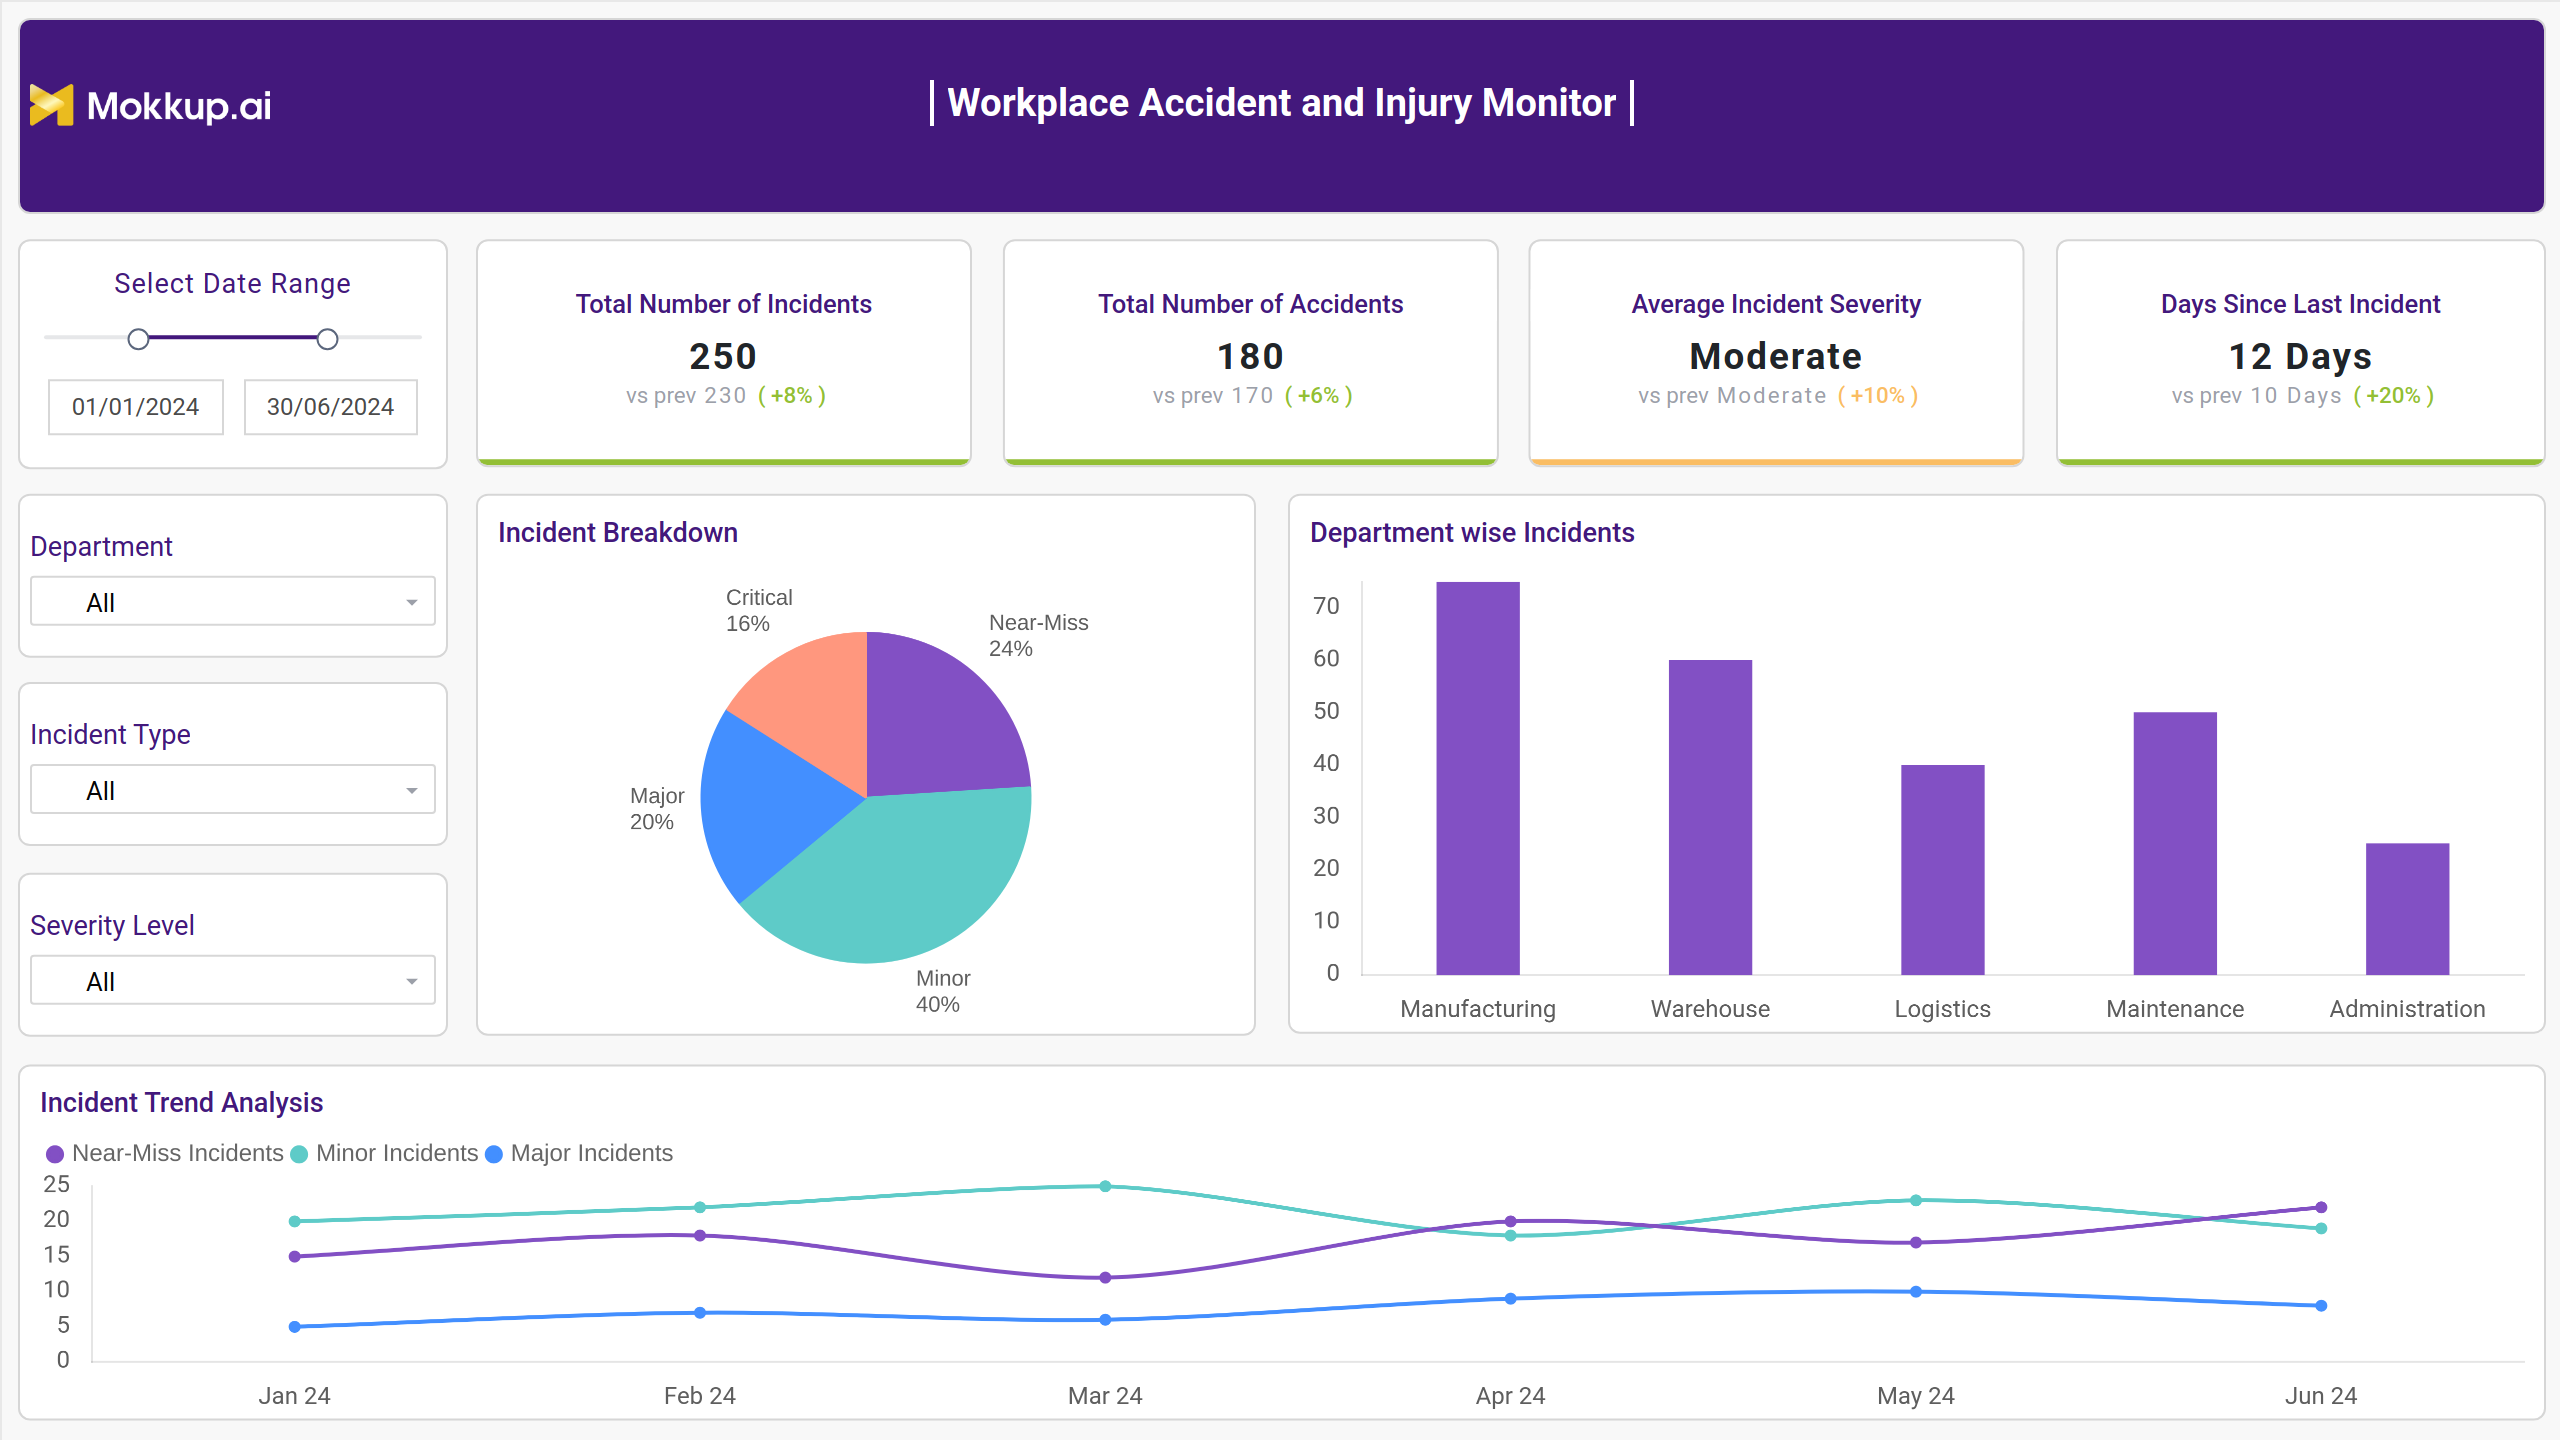
The Workplace Accident and Injury Monitor dashboard helps organizations track and manage workplace incidents. It provides valuable insights into injury trends, accident causes, and safety measures, enabling companies to improve safety protocols, reduce risks, and ensure a safer environment for all employees.
Overview and Trend Analysis
This screen provides an overview of workplace accidents and injuries. It shows the total number of incidents and accidents, the average incident severity, and the days since the last incident. It also includes data on incident breakdown by type and severity, department-wise incidents, and incident trend analysis over time.
Key Terms to Know
- Total Number of Incidents: Displays the total number of workplace incidents.
- Total Number of Accidents: Shows the total number of accidents that have occurred.
- Average Incident Severity: Indicates the average severity level of the reported incidents.
- Days Since Last Incident: Tracks the number of days since the most recent incident occurred.
- Incident Breakdown: Categorizes incidents based on their type (e.g., near miss, minor, major).
- Department-wise Incidents: Shows the number of incidents reported in each department.
- Incident Trend Analysis: Visualizes trends in incident frequency and severity over time.
Detailed Analysis and Incident Reporting
This screen provides an overview of workplace accidents and injuries. It shows the incident reporting rate, average time to resolve incidents, and the number of open and closed incidents. It also includes data on incident location type, resolution rate, incident reporting stages, and a detailed incident table with severity levels and departments.
Key Terms to Know
- Incident Reporting Rate: Shows the percentage of incidents that are reported.
- Average Time to Resolve: Indicates the average time it takes to resolve reported incidents.
- Number of Open Incidents: Displays the current number of unresolved incidents.
- Number of Closed Incidents: Shows the total number of resolved incidents.
- Incident Location Type: Categorizes incidents based on their location within the workplace.
- Resolution Rate: Measures the percentage of incidents that are successfully resolved.
- Incident Reporting: Visualizes the stages of incident reporting (reported, investigated, resolved).
- Severity Distribution: Shows the distribution of incidents across different severity levels.
- Detailed Incident Table: Provides a table with specific details about individual incidents, such as date, type, severity, department, and description.
Dashboard Template Insights
Here are the key insights the dashboard wireframe provides:
- Key metrics like incident rates, severity levels, and root causes empower safety managers to identify high-risk areas and allocate resources effectively.
- By tracking trends and patterns in accidents, organizations can implement preventive measures and reduce the likelihood of future incidents.
- Dashboards that visualize safety performance can help foster a culture of safety awareness and accountability among employees.
- Dashboards can help organizations comply with safety regulations and generate reports for internal and external stakeholders.
Conclusion
This dashboard empowers safety professionals with data-driven insights to identify trends, prioritize interventions, and drive a culture of safety. By visualizing key metrics and incident patterns, organizations can proactively address risks, improve response times, and ultimately reduce workplace accidents and injuries.