
What is a Natural Gas Retail Workforce Productivity & Service Readiness Dashboard?
A Natural Gas Retail Workforce Productivity & Service Readiness Dashboard is a centralized analytics tool designed to monitor, track, and optimize the performance of field teams, customer service agents, and emergency responders in natural gas retail operations. This dashboard consolidates key workforce metrics, including field service hours, emergency response efficiency, training compliance, and first-time fix rates, into a single view. By providing actionable insights, it helps gas utilities improve operational efficiency, reduce downtime, and enhance service reliability.
Unlike traditional reporting methods, this dashboard integrates workforce performance data with service readiness indicators, allowing managers to identify bottlenecks, allocate resources effectively, and ensure compliance with safety and regulatory standards. Whether tracking workforce utilization rates, customer appointment adherence, or emergency dispatch efficiency, this tool enables data-driven decision-making for natural gas retailers.
How to Create a Natural Gas Retail Workforce Productivity & Service Readiness Dashboard
You don't need to build your report from scratch, just start with a ready-to-use dashboard template from Mokkup. Add in your data and export it however you like. Here's how to do it:
1. Create or Log in to Your Mokkup Account
Start by signing up on Mokkup.ai using your email. If you already have an account, just log in, and you'll be good to go.
2. Choose and Customize Your Dashboard Template
Find the Natural Gas Retail Workforce Productivity & Service Readiness Dashboard template in the Templates section. Use the drag and drop editor to adjust KPIs, edit filters, or add elements based on your data.
3. Export to Your BI Tool
Once your dashboard wireframe is ready, use the BI Tool Export feature to send it directly to Power BI or Tableau for further analysis and enhancements. You can also download the dashboard as a PDF, PNG, or JPEG, embed it on a platform, or invite your team to collaborate.
Note: This is a Pro template. You'll need a Pro subscription on Mokkup to use and customize this dashboard wireframe. Upgrade anytime to unlock full access.
Natural Gas Retail Workforce Productivity & Service Readiness Dashboard Example
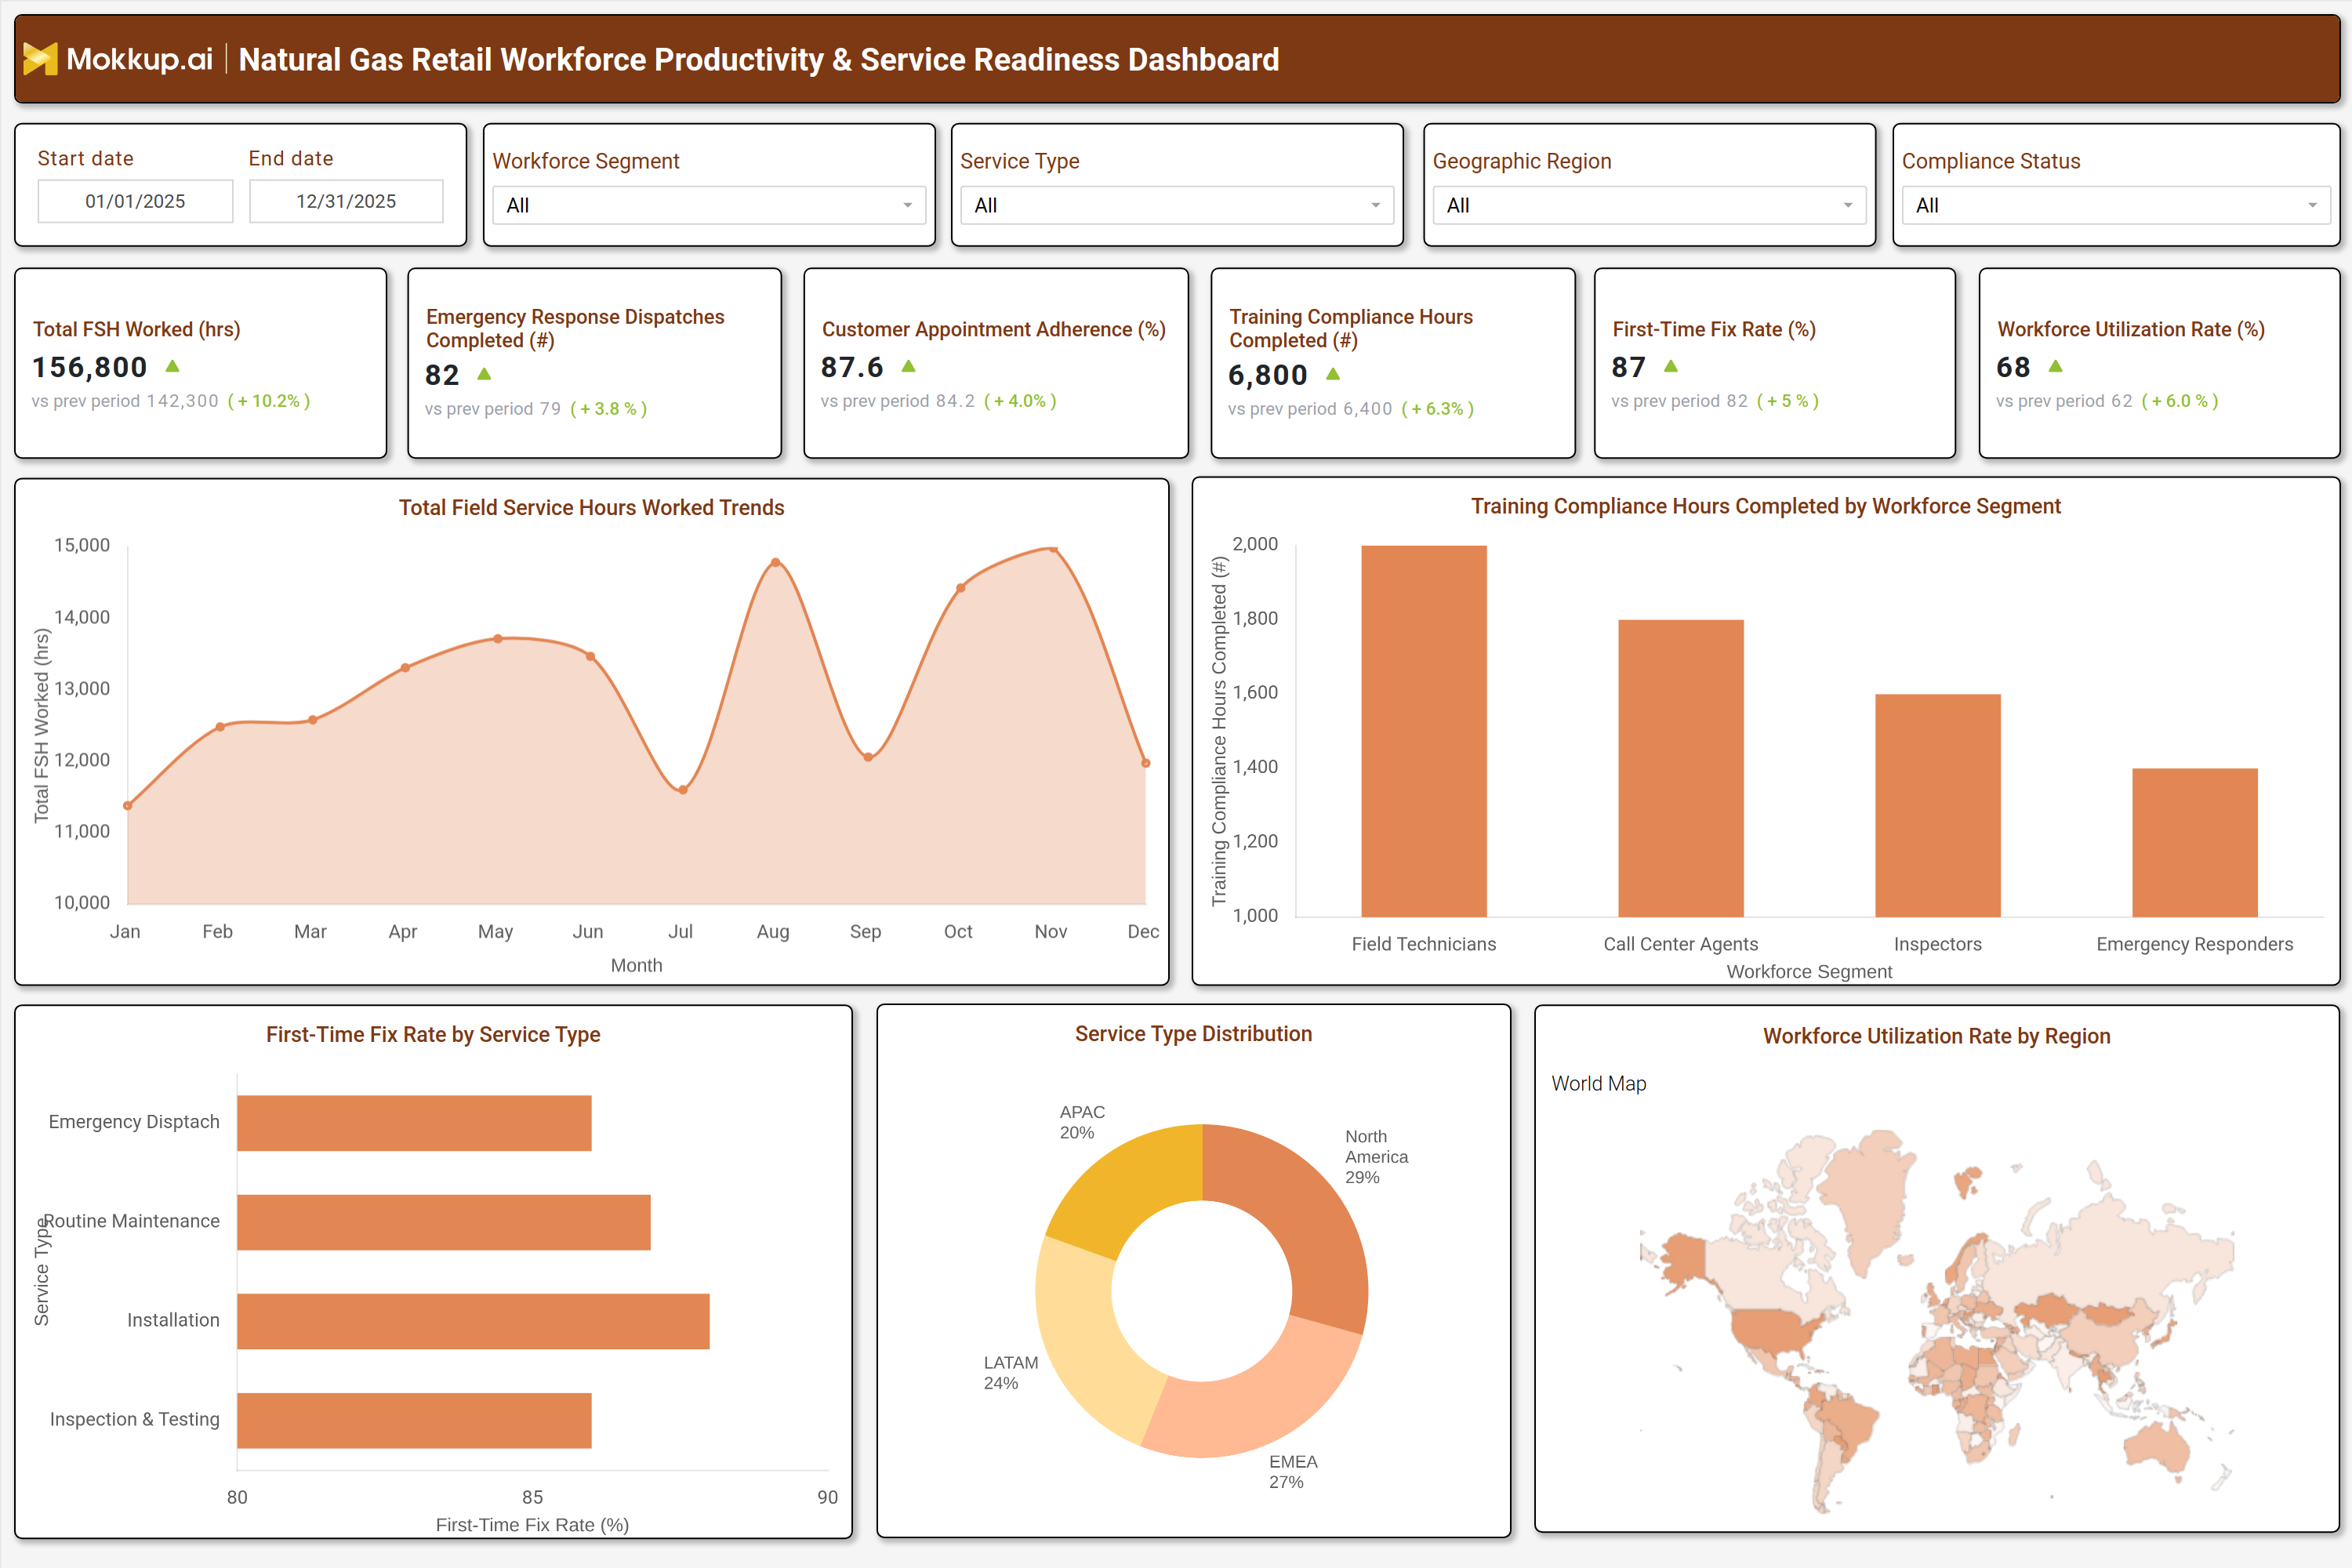
A well-structured Natural Gas Retail Workforce Productivity & Service Readiness Dashboard includes interactive filters for date ranges, workforce segments, service types, and geographic regions. Key performance tiles display critical metrics such as total field service hours worked, emergency response dispatches completed, customer appointment adherence, training compliance hours, first-time fix rates, and workforce utilization rates.
Trend charts compare current performance against previous periods, highlighting improvements or declines in productivity. Workforce segment breakdowns show training compliance across field technicians, call center agents, inspectors, and emergency responders. A geographic heatmap visualizes workforce utilization by region, while bar charts compare first-time fix rates by service type (emergency dispatch, routine maintenance, installation, and inspection). Together, these components provide a comprehensive view of workforce efficiency and service readiness for natural gas retailers.
How to Analyze Data in a Natural Gas Retail Workforce Productivity & Service Readiness Dashboard
Here is how you can analyze data from this dashboard:
- Monitor total field service hours worked to assess workforce capacity and identify peak demand periods.
- Track emergency response dispatches to evaluate response efficiency and resource allocation.
- Review customer appointment adherence to measure service reliability and customer satisfaction.
- Analyze training compliance hours to ensure workforce readiness and regulatory adherence.
- Compare first time fix rates across service types to identify areas for process improvement.
- Evaluate workforce utilization rates by region to optimize staffing and reduce inefficiencies.
- Examine trends in workforce productivity to detect patterns and implement corrective actions.
- Assess compliance status to ensure adherence to safety and operational standards.
Benefits of a Natural Gas Retail Workforce Productivity & Service Readiness Dashboard
The following are the benefits of using this Gas Retail Workforce Dashboard:
- Enhances workforce productivity tracking by monitoring field service hours and task completion rates.
- Improves service readiness through training compliance and emergency response efficiency metrics.
- Optimizes resource allocation by identifying underutilized or overworked workforce segments.
- Reduces operational costs by minimizing overtime and improving first time fix rates.
- Strengthens regulatory compliance with monitoring of training and safety standards.
- Boosts customer satisfaction by ensuring timely service appointments and emergency responses.
- Supports data-driven decision-making for workforce planning and operational improvements.
KPIs to Track in a Natural Gas Retail Workforce Productivity & Service Readiness Dashboard
The following key KPIs can be tracked by using this Field Service Operations Dashboard:
- Total Field Service Hours Worked (hrs): Measures the total hours spent by field teams on service tasks.
- Emergency Response Dispatches Completed (#): Tracks the number of emergency dispatches successfully handled.
- Customer Appointment Adherence (%): Indicates the percentage of scheduled customer appointments completed on time.
- Training Compliance Hours Completed (#): Monitors the number of training hours completed by workforce segments.
- First-Time Fix Rate (%): Measures the percentage of service calls resolved on the first visit.
- Workforce Utilization Rate (%): Evaluates how effectively workforce capacity is being used.
- Compliance Status (% Compliant): Tracks adherence to safety, training, and regulatory requirements.
Frequently Asked Questions
1. What is a Natural Gas Retail Workforce Dashboard used for?
It helps gas retailers monitor field team efficiency, service readiness, and operational performance to improve workforce productivity.
2. What data sources feed into this Service Readiness Dashboard?
Workforce management systems, training records, customer service logs, and emergency dispatch reports.
3. Can this Workforce Productivity Dashboard help reduce operational costs?
Yes, by optimizing workforce utilization, reducing overtime, and improving first time fix rates, it helps lower operational expenses.