
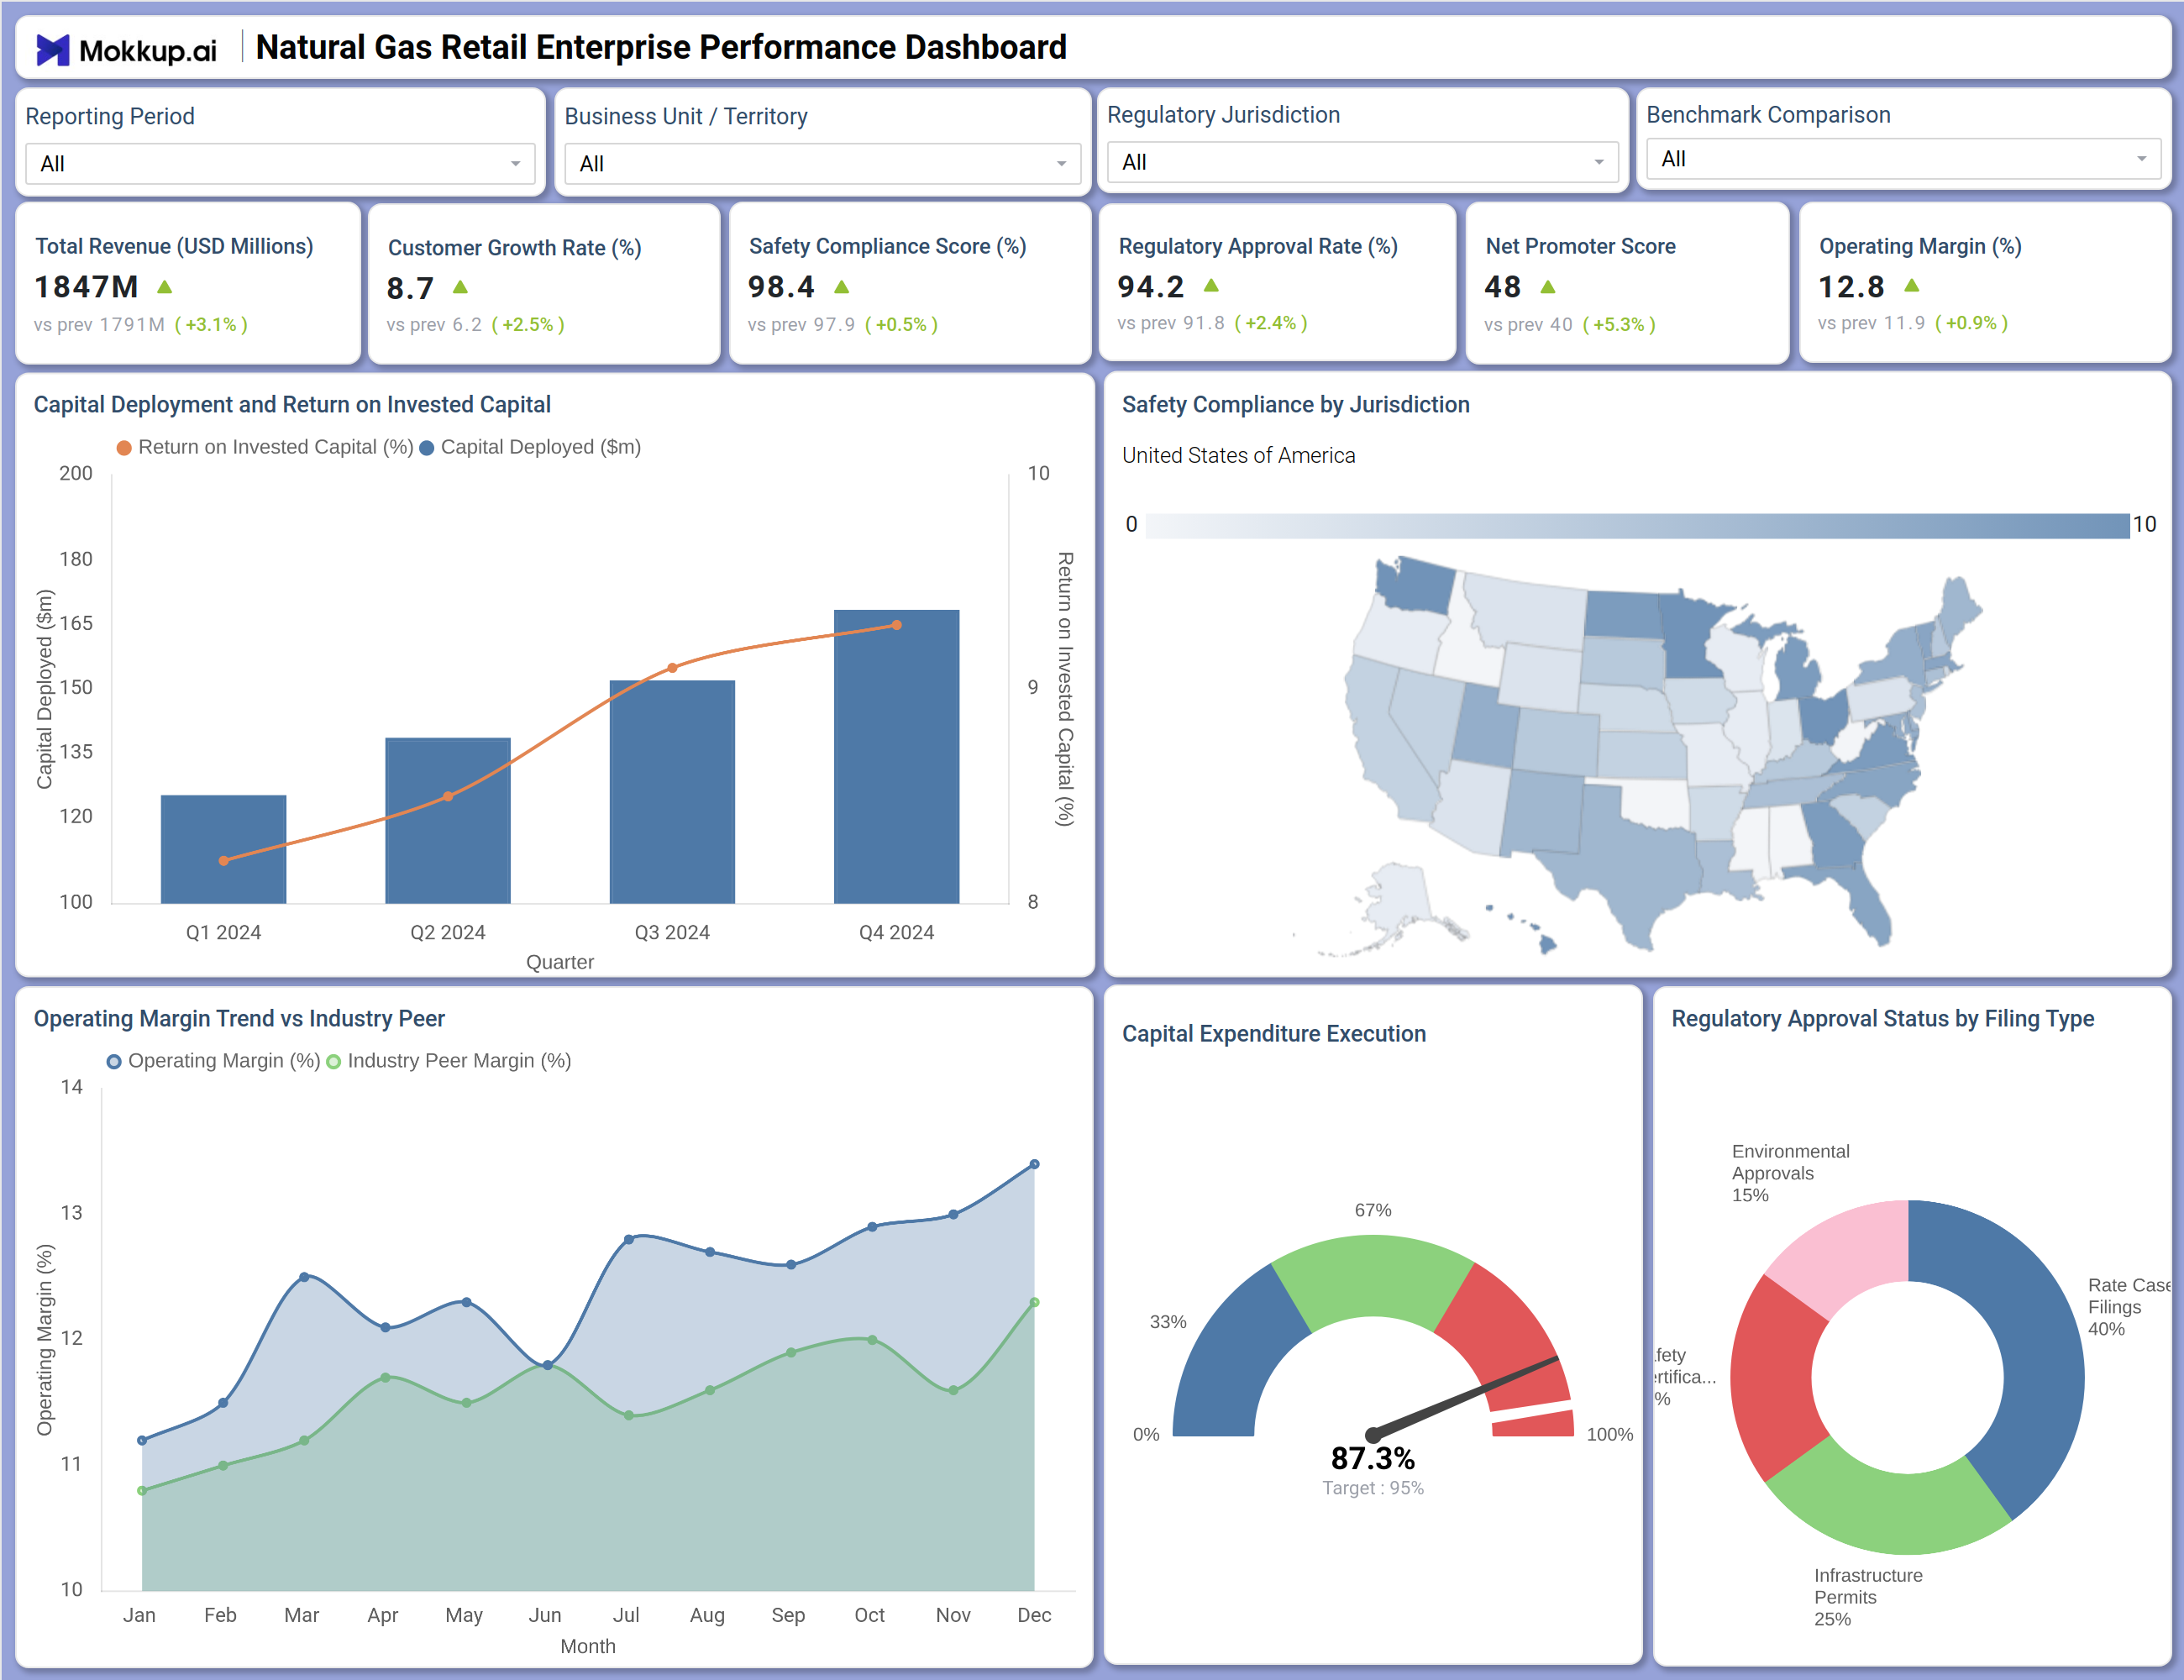
What is a Natural Gas Retail Enterprise Performance Dashboard?
The Natural Gas Retail Enterprise Performance Dashboard is a structured analytics template built for retail natural gas companies that need a single view of financial, operational, and regulatory performance. Enterprise leaders, territory managers, and compliance teams use this natural gas retail enterprise performance dashboard to track total revenue, customer growth, capital execution, and safety compliance across business units and regulatory jurisdictions.
The template brings together metrics that gas retailers depend on from operating margin benchmarking to regulatory approval status into one filterable workspace. Tracking capital deployment and return on invested capital alongside compliance standing gives senior teams the visibility to close performance gaps before they affect financial or regulatory outcomes.
How to Create a Natural Gas Retail Enterprise Performance Dashboard
You don’t need to build your report from scratch—just start with a ready-to-use Natural Gas Retail Enterprise Performance dashboard template from Mokkup. Add in your data and export it however you like. Here’s how to do it:
1. Create or Log in to Your Mokkup Account
Start by signing up on Mokkup.ai using your email. If you already have an account, just log in, and you'll be good to go.
2. Choose and Customize Your Dashboard Template
Find the Natural Gas Retail Enterprise Performance Dashboard template in the Templates section. Use the drag-and-drop editor to adjust KPIs, edit filters, or add elements based on your data.
3. Export to Your BI Tool
Once your dashboard wireframe is ready, use the BI Tool Export feature to send it directly to Power BI or Tableau for further analysis and enhancements. You can also download the dashboard as a PDF, PNG, or JPEG, embed it on a platform, or invite your team to collaborate.
Note: This is a Pro template. You'll need a Pro subscription on Mokkup to use and customize this dashboard wireframe. Upgrade anytime to unlock full access.
Natural Gas Retail Enterprise Performance Dashboard Example
A regional performance director at a gas retail company opens this dashboard at the start of a quarterly review to assess whether the business is growing profitably while meeting regulatory obligations. The KPI row surfaces where the company stands on revenue, customer growth, and the safety compliance score natural gas retail teams are accountable for making it clear which metrics are on track and which require follow-up. The Capital Deployment and Return on Invested Capital combo chart lets the team evaluate whether capital is being deployed at a pace that matches returns quarter over quarter. Teams that also monitor the operating margin trend vs industry peer can quickly determine whether their margin trajectory is keeping pace with the broader market or diverging, a signal that typically triggers pricing or cost structure reviews.
The Safety Compliance by Jurisdiction map helps compliance officers identify which states or territories are underperforming against expected thresholds. The Regulatory Approval Status by Filing Type donut chart surfaces bottlenecks across rate cases, infrastructure permits, safety certifications, and environmental approvals. The Capital Expenditure Execution gauge gives finance teams a direct measure of spend discipline against target, consolidating insights that would otherwise require multiple disconnected reports.
How to Analyze Data in a Natural Gas Retail Enterprise Performance Dashboard
Here is how you can analyze data from this dashboard:
- Compare Time Periods: Use the Reporting Period filter to analyze quarterly or annual performance trends.
- Evaluate Territory Performance: Filter by Business Unit / Territory to assess contributions to revenue and customer growth.
- Check Regulatory Performance: Apply the Regulatory Jurisdiction filter to isolate compliance by state or authority.
- Assess Capital Efficiency: Review the Capital Deployment vs ROIC chart to ensure investments are generating returns.
- Monitor Margin Trends: Track Operating Margin vs Industry Peer to catch early signs of margin pressure.
- Track Capex Execution: Use the execution gauge to identify underspending or overruns against targets.
- Prioritize Regulatory Filings: Analyze the approval status donut chart to focus on pending filings.
- Strengthen Safety Compliance: Use the jurisdiction map to direct resources to underperforming areas.
- Benchmark Against Peers: Apply the Benchmark Comparison filter to evaluate performance against competitors.
Benefits of a Natural Gas Retail Enterprise Performance Dashboard
The following are the benefits of using this dashboard:
- Unified Performance View: Combines financial, compliance, and capital metrics in one dashboard.
- Granular Territory Insights: Enables detailed analysis of revenue and customer growth by region.
- Improved Investment Planning: Tracks capital deployment and returns across reporting periods.
- Streamlined Regulatory Tracking: Monitors approval rates across filing types without manual effort.
- Peer Benchmarking: Compares operating margins against industry standards.
- Faster Reporting: Highlights capital expenditure execution in real time.
- Shared Visibility: Aligns leadership and compliance teams with a single source of truth.
KPIs to Track in a Natural Gas Retail Enterprise Performance Dashboard
The following key KPIs can be tracked by using this dashboard:
- Total Revenue (USD Millions): Measures aggregate revenue across all business units and territories the primary top-line growth indicator in any natural gas retail enterprise performance dashboard.
- Customer Growth Rate (%): Tracks the percentage increase in the customer base compared to the prior period, reflecting demand expansion and market penetration.
- Safety Compliance Score (%): The safety compliance score natural gas retail operations depend on to demonstrate adherence to operational safety standards across all regulatory jurisdictions.
- Regulatory Approval Rate (%): Measures the proportion of regulatory filings that received approval -- critical for managing the regulatory approval rate natural gas operators must sustain to keep projects on schedule.
- Capital Execution Rate (%): Tracks how efficiently approved capital budget is being deployed -- a metric central to every capital expenditure execution natural gas dashboard used for spend accountability.
- Operating Margin (%): Measures net operating profit as a percentage of revenue, benchmarked through the operating margin trend vs industry peer chart to assess competitive profitability.
- Return on Invested Capital (%): Evaluates the return generated relative to capital deployed each quarter, visible through the Capital Deployment and Return on Invested Capital combo chart.
Frequently Asked Questions
Q1. What types of companies benefit most from the Natural Gas Retail Enterprise Performance Dashboard?
This dashboard is built for retail natural gas companies, regulated gas distributors, and utility holding groups. Enterprise directors, regulatory affairs teams, and capital planning managers are the primary users who benefit from its consolidated financial and compliance view.
Q2. Can this dashboard track regulatory filing status by category?
Yes. The Regulatory Approval Status by Filing Type donut chart breaks down filings across rate cases, infrastructure permits, safety certifications, and environmental approvals, giving regulatory teams visibility into which categories have the most pending items.
Q3. Is this dashboard suitable for benchmarking operating performance against competitors?
Yes. The Operating Margin Trend vs Industry Peer chart plots the company's monthly operating margin alongside the industry peer margin, making it straightforward to identify when performance is diverging from market trends.