
What is the Natural Gas Power Plant Upgrade & Modernization Dashboard?
A Natural Gas Power Plant Upgrade & Modernization Dashboard is a structured monitoring platform used to oversee modernization work for Natural Gas-Fired Power Generation assets. It centralizes engineering milestones, CAPEX control, and contractor activity into one reporting view. Utility operators use the turbine upgrade performance monitoring dashboard to compare planned progress against executed work, validate milestone accuracy, and manage outage timelines. This type of reporting framework supports turbine overhaul and modernization performance analytics by showing how upgrade scopes move from inspection to fabrication, installation, commissioning, and handover.
The dashboard also functions as a turbine efficiency improvement monitoring platform by allowing users to analyze component retrofit success, control system tuning, and combustion optimization outcomes. As Natural Gas-Fired Power Generation plants rely on reliable turbine operation for grid supply, modernization dashboards ensure execution quality, safety compliance, and production readiness.
How to Create a Natural Gas Power Plant Upgrade & Modernization Dashboard
You don’t need to build your report from scratch—just start with a ready-to-use dashboard template from Mokkup. Add in your data and export it however you like. Here’s how to do it:
1. Create or Log in to Your Mokkup Account
Start by signing up on Mokkup.ai using your email. If you already have an account, just log in, and you’ll be good to go.
2. Choose and Customize Your Dashboard Template
Find the Natural Gas Power Plant Upgrade & Modernization Dashboard template in the Templates section. Use the drag-and-drop editor to adjust KPIs, edit filters, or add elements based on your data.
3. Export to Your BI Tool
Once your dashboard wireframe is ready, use the BI Tool Export feature to send it directly to Power BI or Tableau for further analysis and enhancements. You can also download the dashboard as a PDF, PNG, or JPEG, embed it on a platform, or invite your team to collaborate.
Note: This is a Pro template. You’ll need a Pro subscription on Mokkup to use and customize this dashboard wireframe. Upgrade anytime to unlock full access.
Natural Gas Power Plant Upgrade & Modernization Dashboard Example
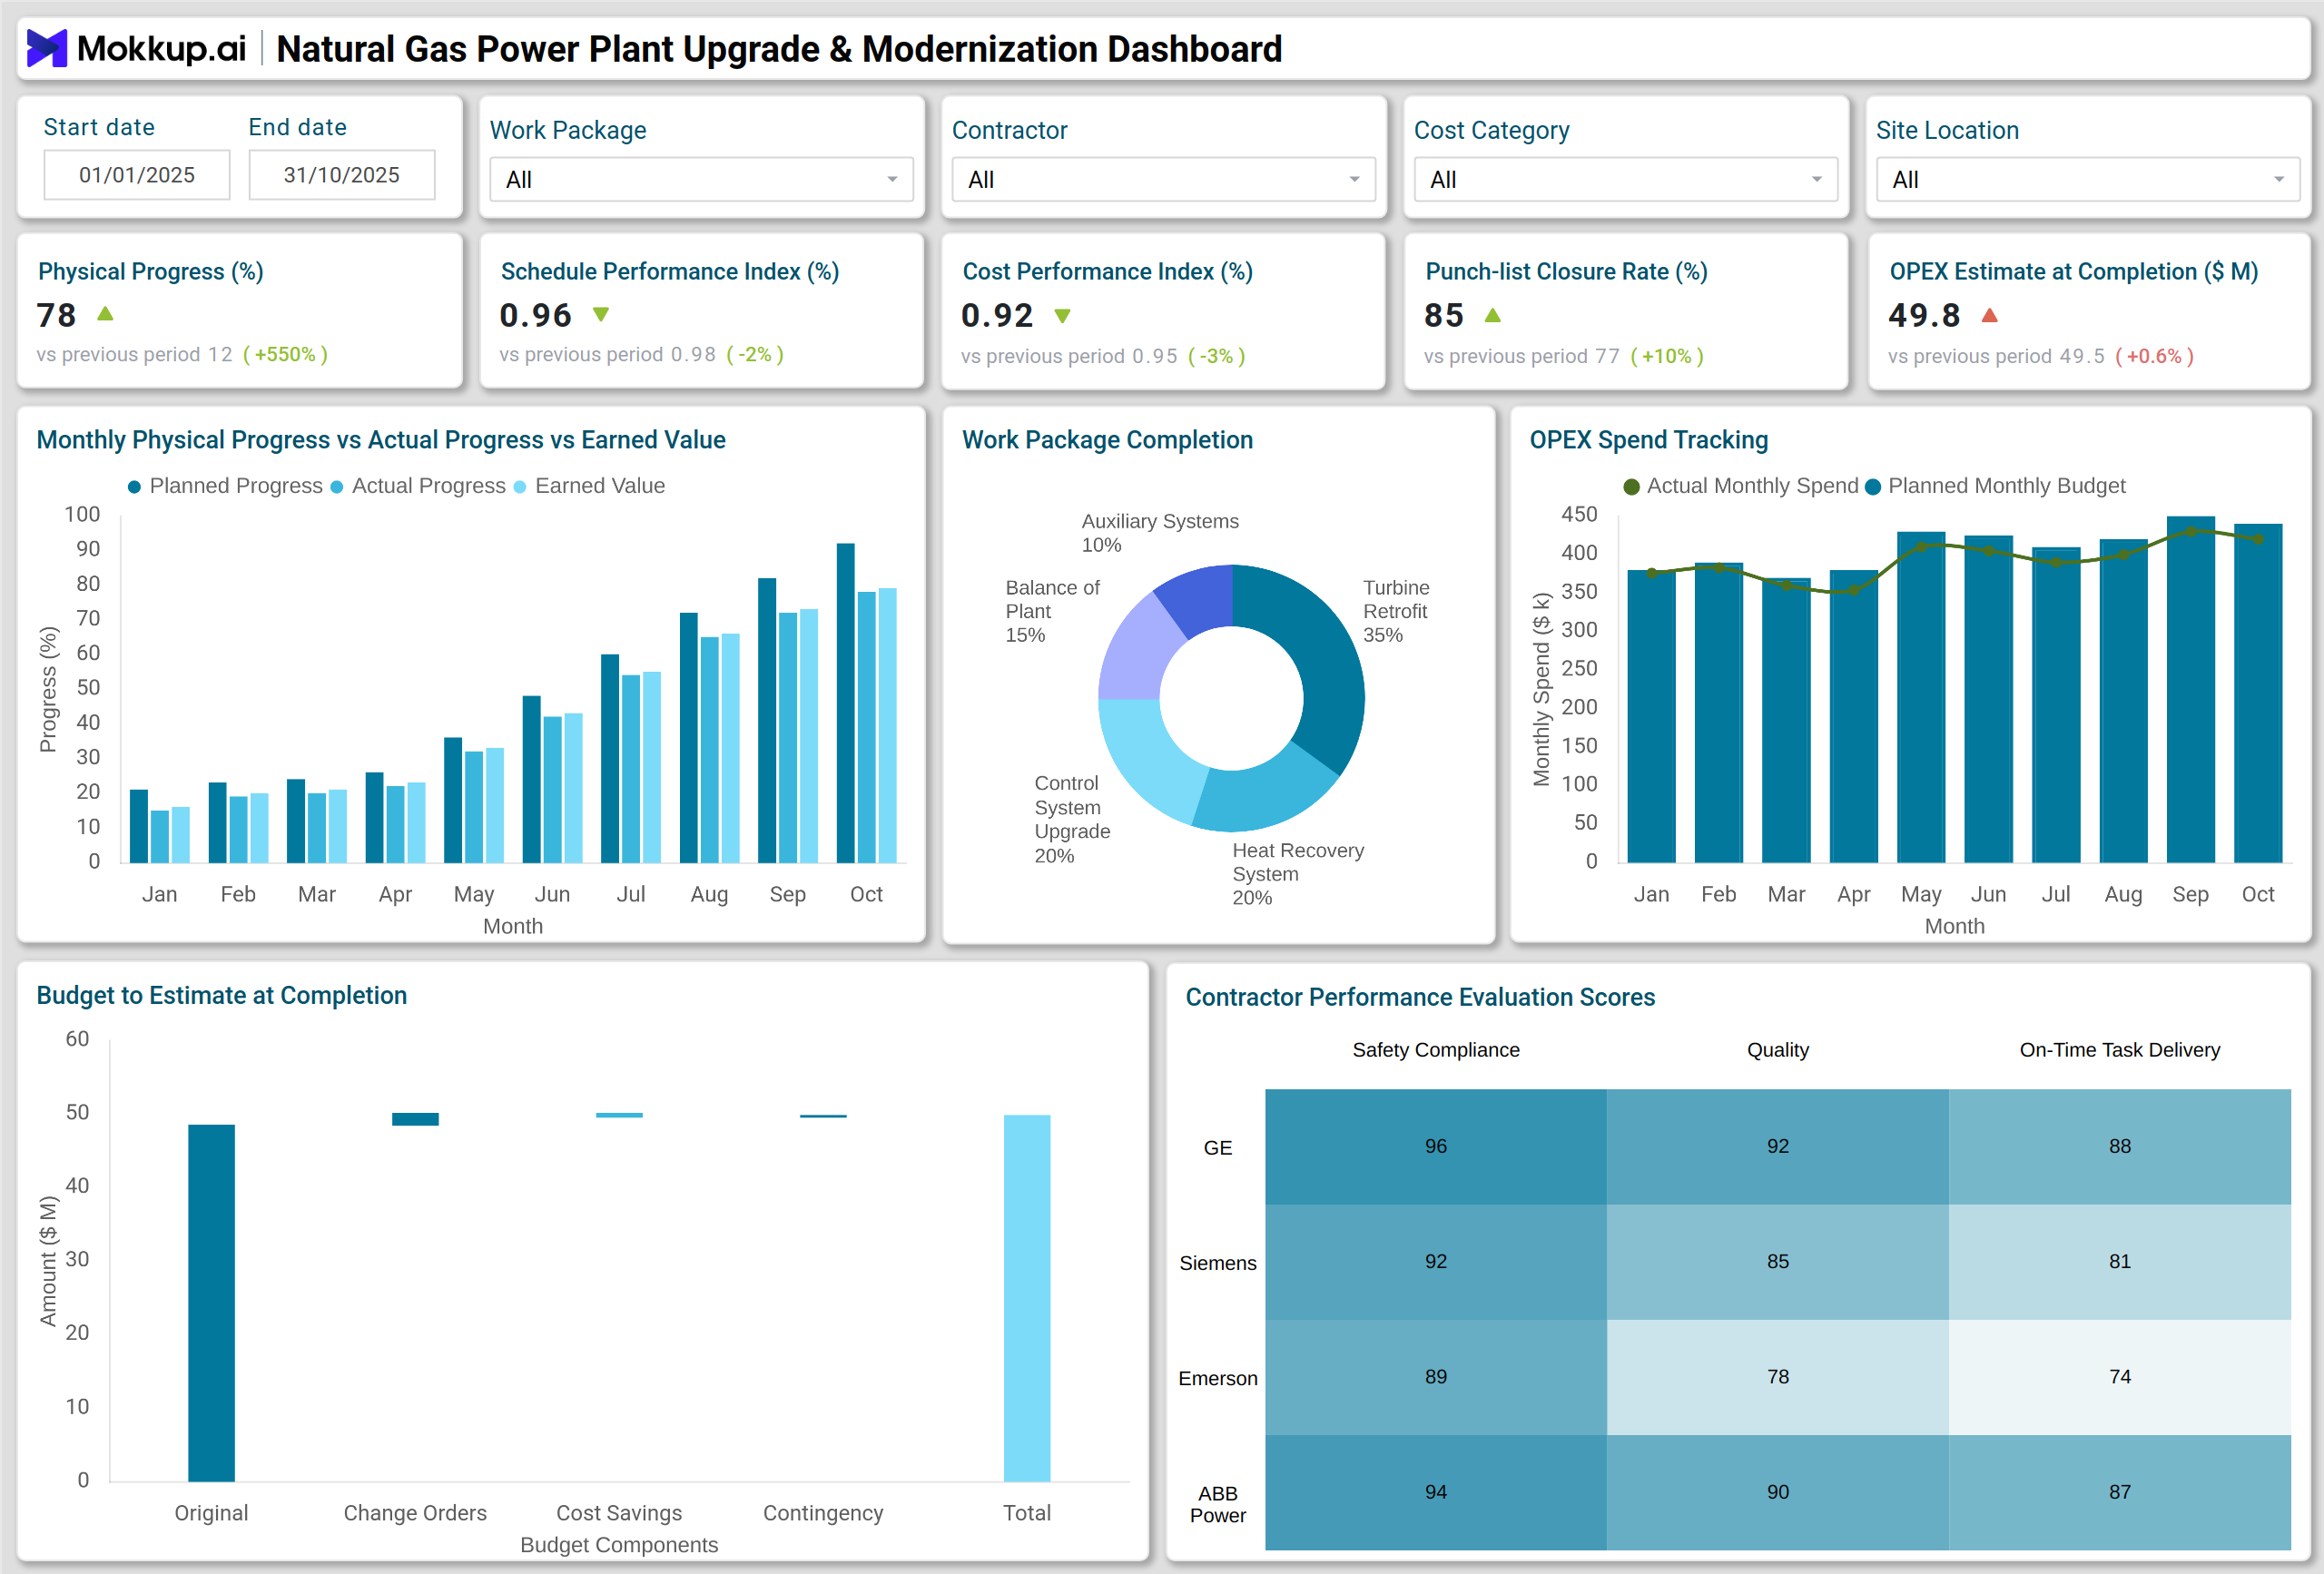
In a live plant environment, this dashboard is built as a complete plant modernization project progress tracking report. It starts with schedule, cost, and completion metrics that quantify modernization execution accuracy. A utility can view Percent Complete Physical Progress, Schedule Performance Index, and Cost Performance Index on a single screen, making it easy to confirm whether upgrade work is advancing as planned.
A Stacked Column Chart displays Monthly Planned Progress vs Actual Physical Progress vs Earned Value. This view supports power plant turbine upgrade KPI dashboard requirements by connecting engineering timelines, procurement delays, and installation performance to earned value outcomes.
A Multiple Line Chart compares Actual CAPEX Spend vs Planned Budget Burn. Finance teams depend on this view to monitor budget exposure during modernization and prevent cost overruns. A Donut Chart shows Work Package Completion Distribution, enabling operators to identify which scopes, such as rotor refurbishment or control retrofits, are nearing completion or experiencing delays.
A Waterfall Chart highlights Original Budget to Estimate at Completion Variance Breakdown. It shows how change orders, material escalation, or value engineering savings affect the financial forecast. A Heatmap displays contractor scoring for safety performance, quality, rework, and on-time delivery. This is a core advantage of natural gas power generation modernization metrics, as contractor reliability directly affects turbine availability and outage duration.
How to Analyze Data in Natural Gas Power Plant Upgrade & Modernization Dashboard
Here’s how teams can analyze data in turbine upgrade and plant modernization dashboards:
- Track Physical Progress: Review percent-complete trends to confirm modernization progress against the master schedule and catch early slippage.
- Evaluate Schedule and Cost Efficiency: Use the Schedule Performance Index and Cost Performance Index to spot deviations from planned time and cost baselines.
- Analyze Earned Value Trends: Compare earned value against actual capital spending to understand how much meaningful work has been accomplished.
- Review Work Package Distribution: Identify disciplines or work fronts that are contributing to delays or bottlenecks during the upgrade.
- Monitor CAPEX Burn: Compare actual spending against planned CAPEX curves to prevent procurement overruns and unplanned cash flow spikes.
- Forecast Cost at Closeout: Use the Estimate at Completion to project final costs and adjust funding or phasing before financial risks escalate.
- Assess Contractor Productivity: Track contractor performance scores to detect productivity gaps that could impact outage duration or modernization timelines.
- Align Upgrade Progress with Performance Goals: Compare modernization progress against targets like heat rate improvement, output gains, or reliability enhancements.
Benefits of Natural Gas Power Plant Upgrade & Modernization Dashboards
This Natural Gas power plant upgrade dashboard offers several benefits:
- Centralized Upgrade Monitoring: Consolidates all turbine upgrade, overhaul, and modernization metrics into a single dashboard for complete visibility.
- Improved Outage Planning: Provides clear progress tracking to support smarter outage scheduling and modernization decision-making.
- Performance-Driven Insights: Enables turbine overhaul and modernization analytics through structured visuals, KPIs, and trend evaluations.
- Stronger Capital Governance: Tracks financial variances and CAPEX performance to keep modernization budgets under control.
- Contractor Accountability: Ranks contractors on safety, rework, quality, and delivery performance to improve execution standards.
- Post-Upgrade Efficiency Tracking: Supports monitoring of heat rate, output, and reliability improvements after modernization activities.
- Enhanced Visibility for Gas Plants: Increases modernization transparency across Natural Gas-fired power generation assets.
KPIs to Track in Natural Gas Power Plant Upgrade & Modernization Dashboards
It tracks the below KPIs:
- Percent Complete Physical Progress – Measures modernization completion against planned scope.
- Schedule Performance Index (SPI) – Shows whether turbine upgrades are ahead or behind schedule.
- Cost Performance Index (CPI) – Compares budgeted spend with earned value.
- Punch-list Closure Rate – Tracks clearance of commissioning tasks before handover.
- Estimate at Completion (EAC) – Forecasts the final cost of modernization work.
Frequently Asked Questions
Q1. How does this dashboard support Natural Gas-Fired Power Generation plants?
It provides natural gas power generation modernization metrics that help utilities control schedule adherence, maintenance quality, and capital exposure during turbine upgrades.
Q2. Is it useful for major and minor turbine upgrades?
Yes. It works for hot-section refurbishment, rotor retrofits, combustion tuning, and full modernization cycles.
Q3. Can it compare contractors?
Yes. Contractor scoring heatmaps reveal gaps in safety, rework, and quality, allowing utilities to rebalance workloads.
Q4. Why is it important for Electric Power Utilities?
Because it builds a power plant turbine upgrade KPI dashboard that supports safe execution, predictable outage duration, and return-to-service readiness.
Q5. Does it monitor performance improvements?
Yes. It functions as a turbine efficiency improvement monitoring platform by tracking post-upgrade output, heat rate, and reliability gains.