
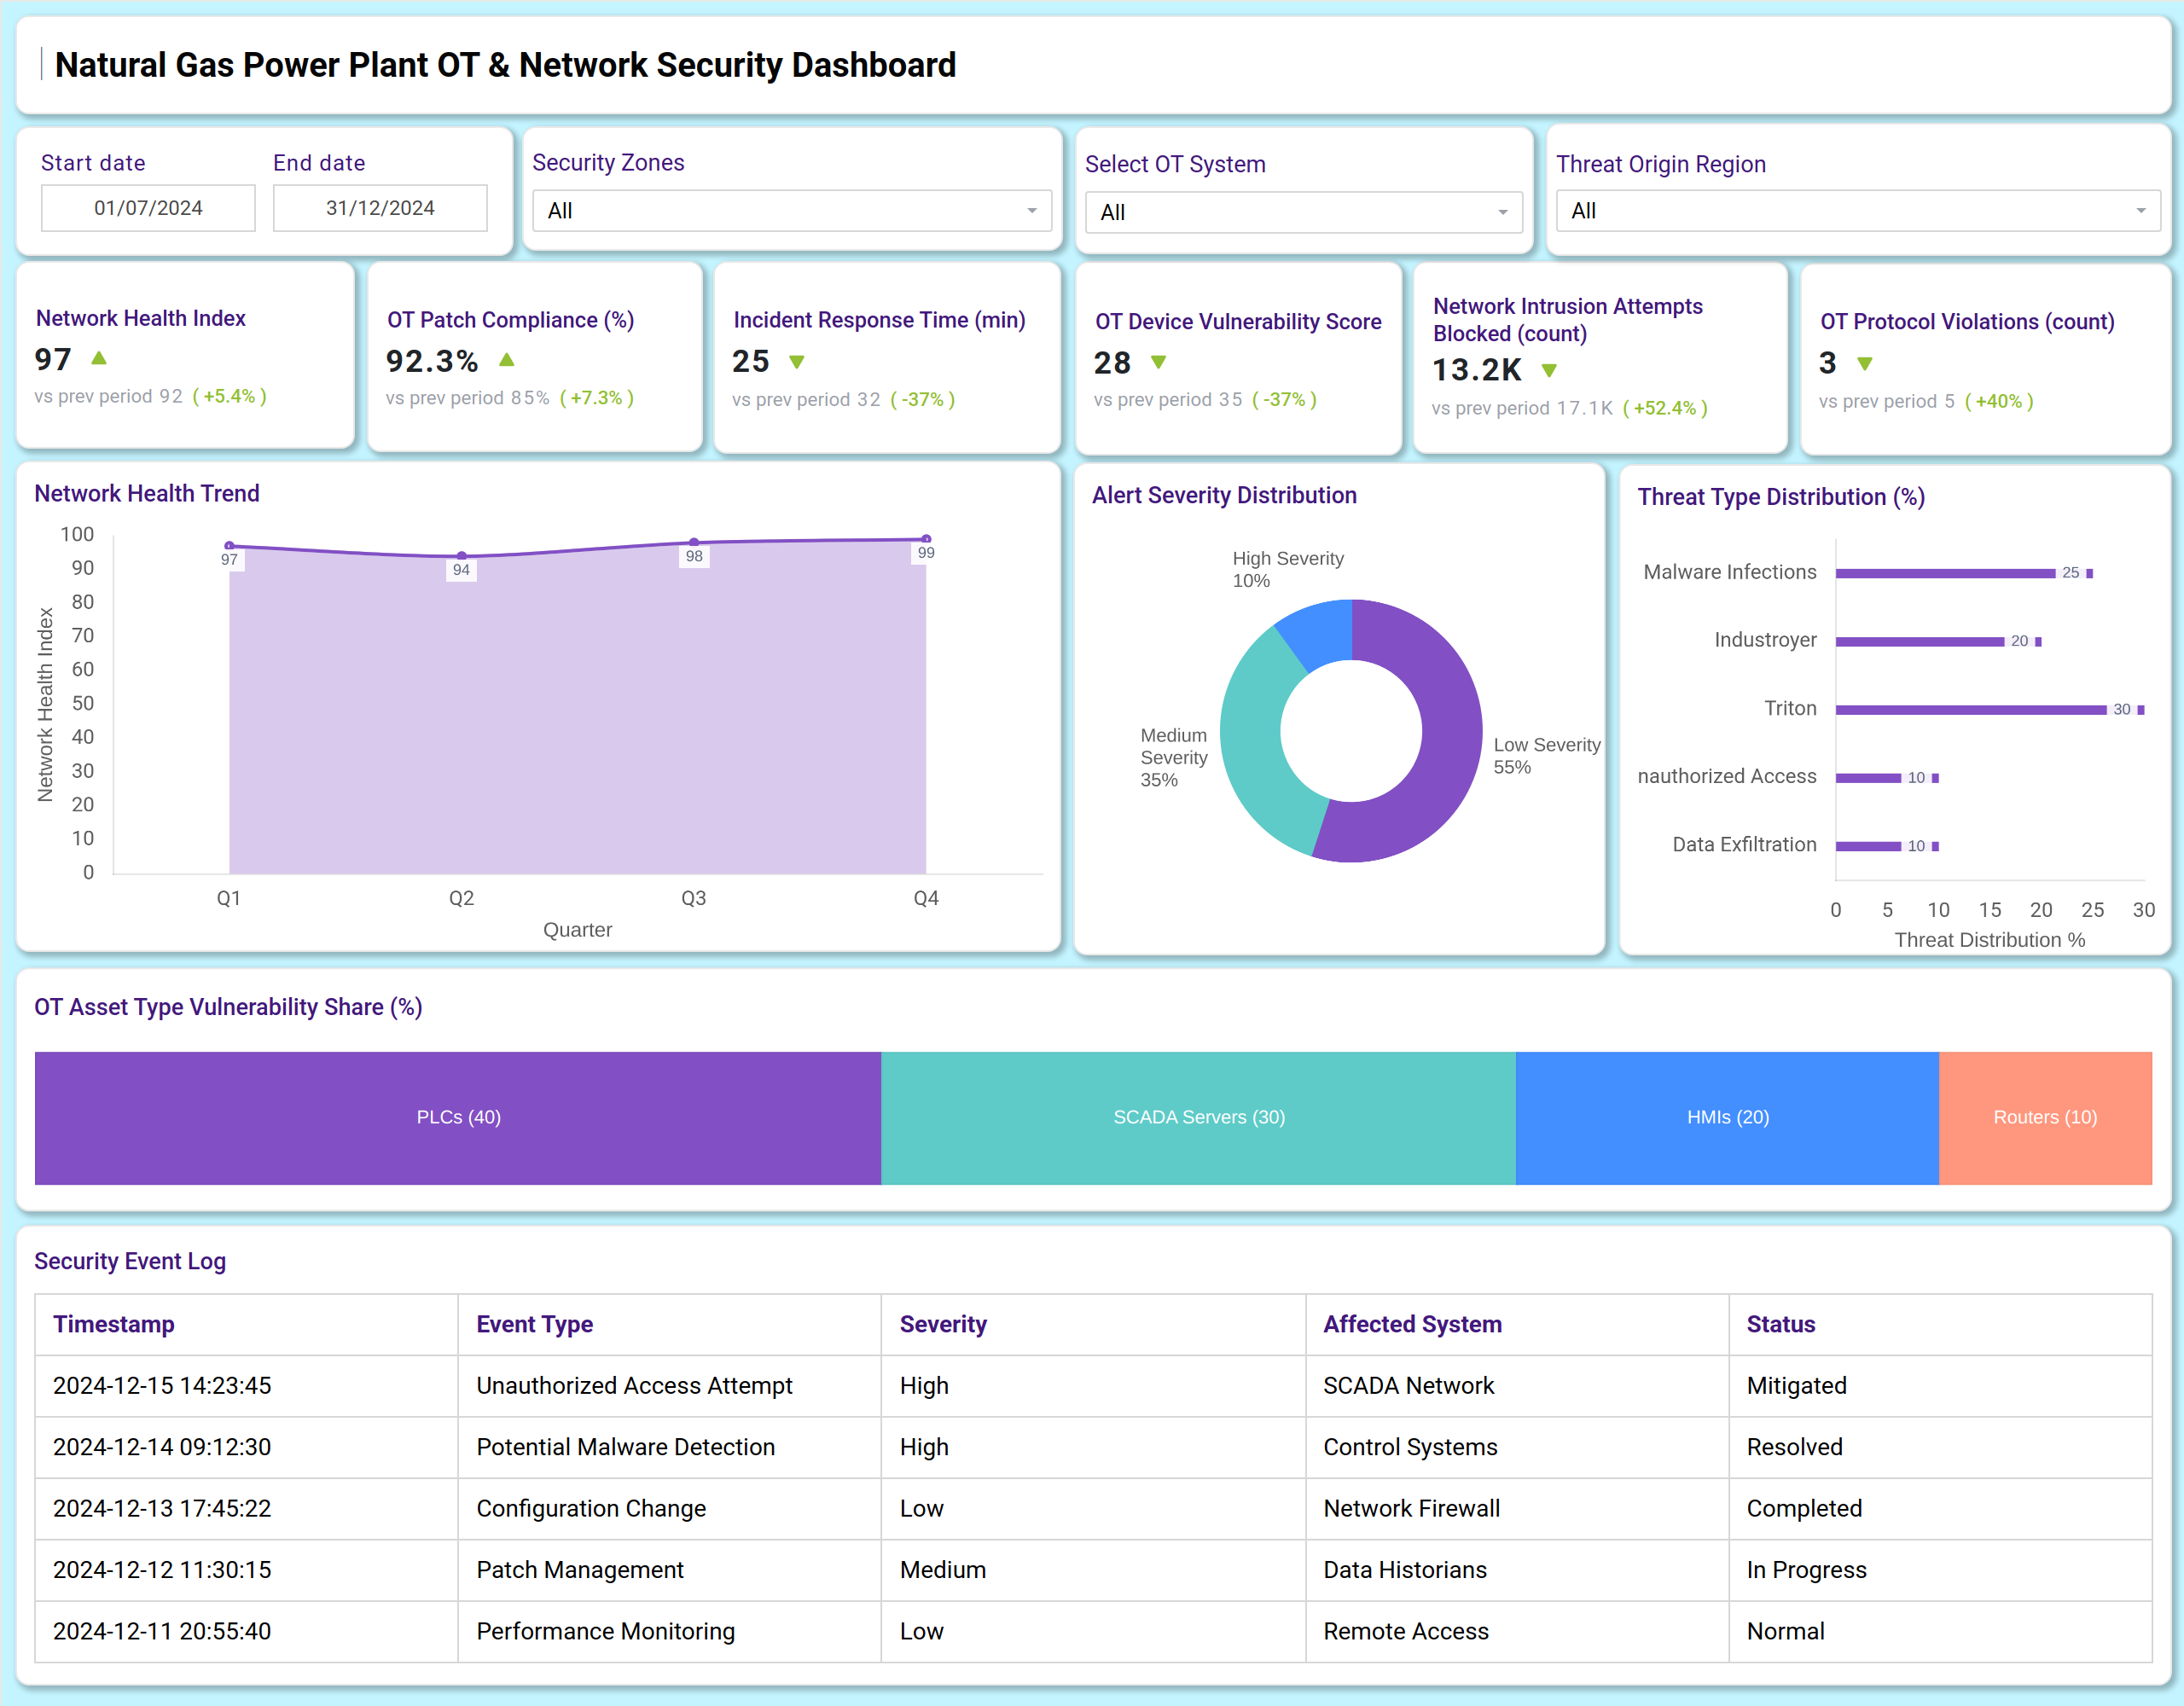
What is a Natural Gas Power Plant OT & Network Security Dashboard?
A Natural Gas Power Plant OT & Network Security Dashboard is a centralized monitoring tool designed for cybersecurity and operational technology (OT) teams to oversee the security posture and network health of a power plant’s critical infrastructure. It provides visibility into key security metrics, threat activity, compliance status, and system vulnerabilities across OT environments such as SCADA networks, PLCs, and HMIs. This dashboard helps security leads, network administrators, and plant managers track intrusion attempts, patch compliance, incident response times, and protocol violations—all in one place.
How to Create a Natural Gas Power Plant OT & Network Security Dashboard
You don’t need to build your security report from scratch—just start with a ready-to-use Natural Gas Power Plant OT & Network Security Dashboard template from Mokkup. Customize it with your metrics and export it in your preferred format. Here’s how:
1. Create or Log in to Your Mokkup Account
Sign up on Mokkup.ai using your email address. Existing users can log in directly.
2. Choose and Customize Your Dashboard Template
Navigate to the Templates section and select the Natural Gas Power Plant OT & Network Security Dashboard. Use the intuitive drag-and-drop editor to modify KPIs, adjust charts, or add security-specific elements.
3. Export to Your BI Tool
Once your dashboard wireframe is finalized, export it directly to Power BI or Tableau using the BI Tool Export feature. You can also download it as a PDF, PNG, or JPEG, embed it into a platform, or invite team members to collaborate.
Note: This is a Pro template. A Mokkup Pro subscription is required to access and customize this dashboard wireframe. Upgrade anytime to unlock all features.
Natural Gas Power Plant OT & Network Security Dashboard Example
You can design a Natural Gas Power Plant OT & Network Security Dashboard using a combination of KPI tiles and security-focused visualizations. At the top, KPI cards display essential metrics, including the Network Health Index, OT Patch Compliance, Incident Response Time, and OT Device Vulnerability Score. Below, charts illustrate trends in network health, alert severity distribution, threat type breakdown, and the share of OT asset vulnerabilities. A security event log provides a chronological record of incidents. Together, this dashboard serves as a comprehensive OT security monitoring and reporting dashboard for natural gas power plants.
How to Analyze Data in Natural Gas Power Plant OT & Network Security Dashboards
Here’s how security teams can leverage the dashboard for actionable insights:
- Monitor network health: Track the Network Health Index to gauge overall system stability and performance.
- Assess patch compliance: Review OT Patch Compliance percentages to ensure systems are up-to-date and secure.
- Evaluate response efficiency: Analyze Incident Response Time to improve reaction speed to security events.
- Identify vulnerabilities: Use the OT Device Vulnerability Score to prioritize remediation efforts.
- Track intrusion attempts: Monitor Network Intrusion Attempts Blocked to understand threat frequency and defense effectiveness.
- Review protocol violations: Check OT Protocol Violations to detect misconfigurations or unauthorized activities.
- Analyze threat types: Use the Threat Type Distribution chart to identify common attack vectors, such as malware or unauthorized access.
- Audit security events: Review the Security Event Log for recent incidents and their resolution status.
Benefits of Natural Gas Power Plant OT & Network Security Dashboards
Here are benefits of using this dashboard:
- Enhanced security visibility: A clear view of OT and network security status across the entire plant.
- Proactive vulnerability management: Identifies and scores device vulnerabilities for timely action.
- Improved compliance tracking: Monitors patch compliance and ensures adherence to security protocols.
- Faster incident response: Tracks response times to minimize the impact of security breaches.
- Threat intelligence insights: Breaks down threat types and origins for better defense planning.
- Operational continuity: Supports uninterrupted plant operations by detecting and mitigating risks early.
- Audit and reporting readiness: Functions as an OT security compliance and reporting dashboard for regulatory reviews.
Together, these elements provide plant operators and security teams with the insights needed to protect critical infrastructure and maintain operational integrity. That’s why many industry professionals consider it the best OT security dashboard for natural gas power plants.
KPIs to Track in Natural Gas Power Plant OT & Network Security Dashboards
- Network Health Index: Measures the overall condition and performance of the plant’s network infrastructure.
- OT Patch Compliance (%): Tracks the percentage of OT systems that are up-to-date with security patches.
- Incident Response Time (minutes): Indicates the average time required to respond to and mitigate security incidents.
- OT Device Vulnerability Score: Rates the vulnerability level of OT devices, with lower scores indicating better security.
- Network Intrusion Attempts Blocked (count): Counts the number of unauthorized access attempts prevented by security systems.
- OT Protocol Violations (count): Monitors incidents where OT communication protocols are breached or misused.
- Alert Severity Distribution: Breaks down security alerts by severity level (High, Medium, Low).
- Threat Type Distribution (%): Displays the percentage of various threat types, including malware and unauthorized access.
Frequently Asked Questions
1. Who should use a Natural Gas Power Plant OT & Network Security Dashboard?
OT security managers, network administrators, plant managers, and CISOs are responsible for safeguarding power plant infrastructure.
2. Can this dashboard help reduce security risks?
Yes. By tracking vulnerabilities, intrusions, and response times, teams can proactively address threats and reduce risk exposure.
3. How does it support compliance?
It provides documented evidence of patch compliance, incident handling, and security monitoring—key for regulatory audits.
4. Is the dashboard suitable for non-IT staff?
Yes. The visual and metric-driven design makes it accessible for operational staff with limited cybersecurity backgrounds.