
What is a Natural Gas Pipeline Expansion & CapEx Execution Dashboard?
A Natural Gas Pipeline Expansion & CapEx Execution Dashboard is a data-driven analytics platform designed to monitor, track, and optimize capital expenditure (CapEx) and pipeline expansion projects in the natural gas industry. This dashboard consolidates financial, operational, and project performance metrics into a single interface, enabling utility companies, investors, and project managers to assess pipeline growth, budget adherence, and infrastructure development. By integrating pipeline infrastructure investment analytics, the dashboard provides insights into gas transmission pipeline capacity expansion, CapEx execution monitoring, and project progress reporting. It helps stakeholders identify cost overruns, track pipeline miles added, monitor permit approvals, and ensure safety compliance. With natural gas utility capital expenditure tracking, decision-makers can align investments with strategic growth objectives while maintaining operational efficiency.
How to Create a Natural Gas Pipeline Expansion & CapEx Execution Dashboard
You don't need to build your report from scratch, just start with a ready-to-use dashboard template from Mokkup. Add in your data and export it however you like. Here's how to do it:
1. Create or Log in to Your Mokkup Account
Start by signing up on Mokkup.ai using your email. If you already have an account, just log in, and you'll be good to go.
2. Choose and Customize Your Dashboard Template
Find the Natural Gas Pipeline Expansion & CapEx Execution Dashboard template in the Templates section. Use the drag-and-drop editor to adjust KPIs, edit filters, or add elements based on your data.
3. Export to Your BI Tool
Once your dashboard wireframe is ready, use the BI Tool Export feature to send it directly to Power BI or Tableau for further analysis and enhancements. You can also download the dashboard as a PDF, PNG, or JPEG, embed it on a platform, or invite your team to collaborate.
Note: This is a Pro template. You'll need a Pro subscription on Mokkup to use and customize this dashboard wireframe. Upgrade anytime to unlock full access.
Natural Gas Pipeline Expansion & CapEx Execution Dashboard Example
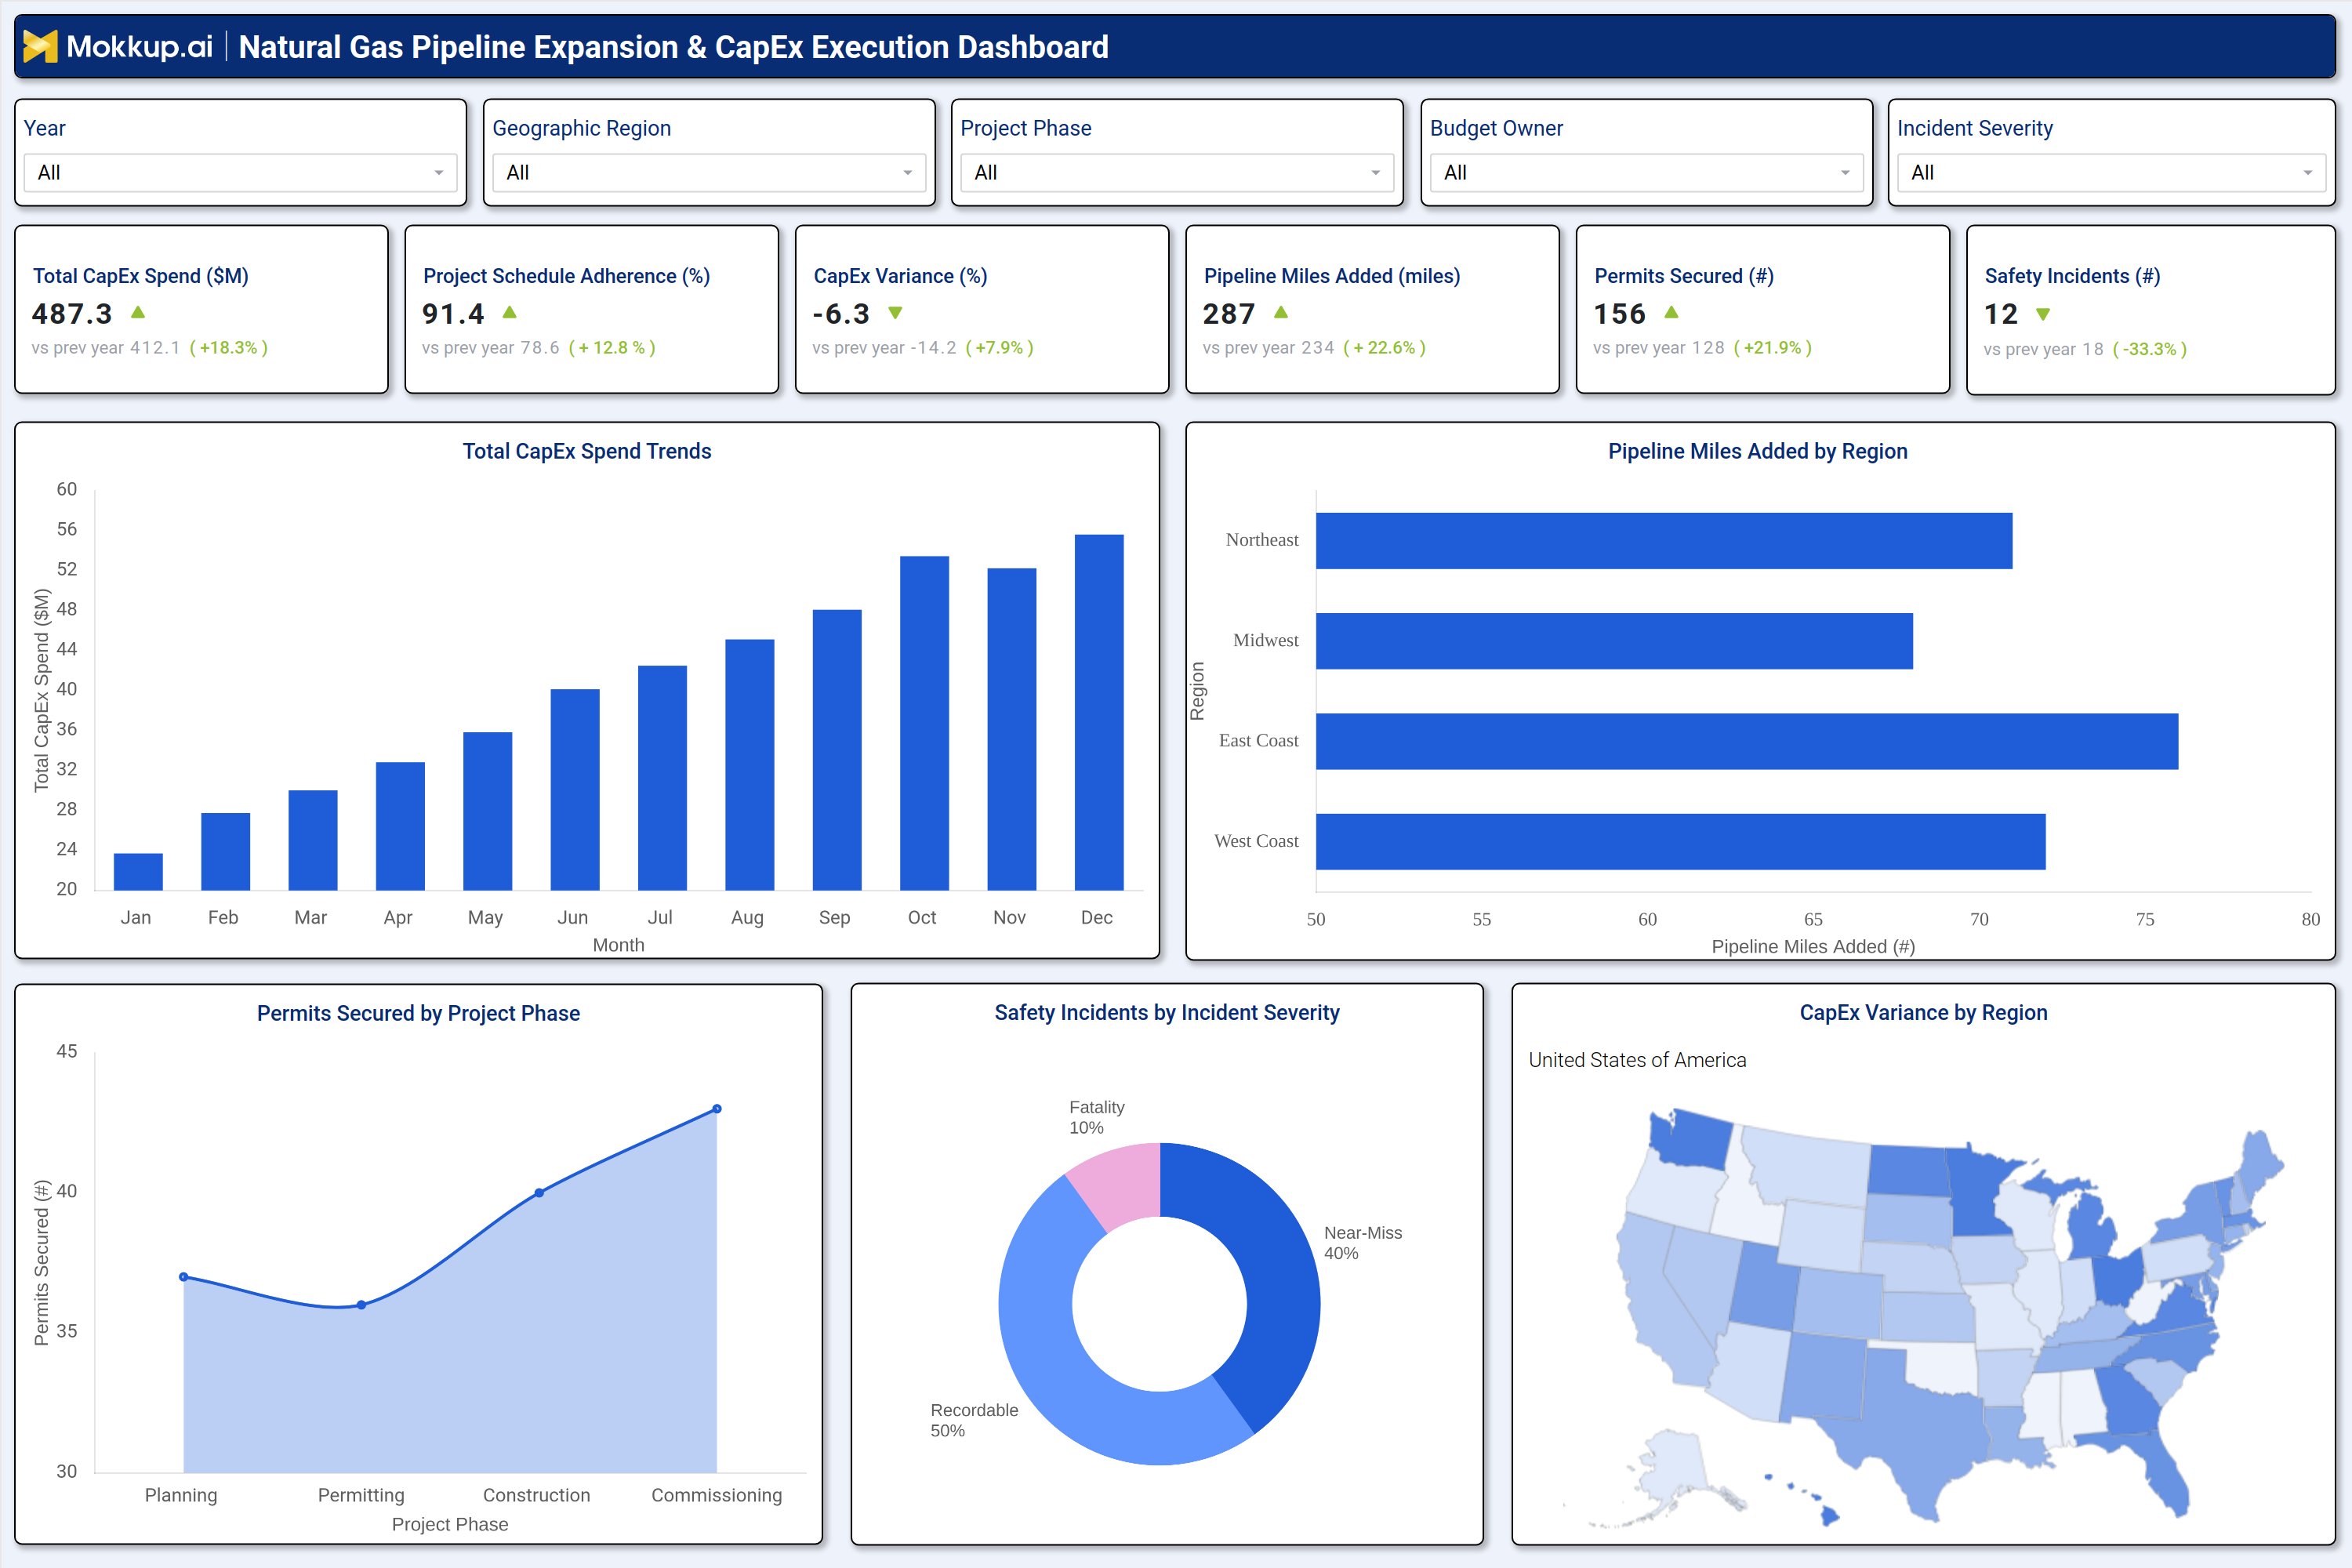
A well-structured gas transmission pipeline capacity expansion dashboard includes interactive filters for date ranges, geographic regions, project phases, budget owners, and incident severity. Key performance tiles display total CapEx spend, project schedule adherence, CapEx variance, pipeline miles added, permits secured, and safety incidents, with year-over-year comparisons for trend analysis. Trend charts visualize monthly CapEx spend, while bar graphs break down pipeline miles added by region, helping utilities assess expansion progress across different service territories. A permit acquisition trend line tracks approvals across planning, permitting, construction, and commissioning phases, ensuring regulatory compliance. A safety incident severity pie chart categorizes incidents into recordable, near-miss, and fatality cases, supporting risk mitigation efforts. Additionally, a CapEx variance heatmap highlights regional spending deviations, enabling targeted cost control measures. Together, these components form a pipeline expansion progress reporting and insights tool that provides a comprehensive view of gas transmission network growth and CapEx management.
How to Analyze Data in a Natural Gas Pipeline Expansion & CapEx Execution Dashboard
Here is how you can analyze data from this gas infrastructure investment dashboard:
- Total CapEx Spend Trends: Monitor capital expenditure trends to assess budget utilization, identify spending spikes, and ensure investments align with strategic objectives.
- Project Schedule Adherence: Track project timelines to ensure expansion initiatives remain on schedule, minimize delays, and improve project execution efficiency.
- CapEx Variance Analysis: Analyze budget variances to identify cost overruns, uncover savings opportunities, and improve financial control across regions.
- Pipeline Miles Added by Region: Review pipeline expansion progress by measuring miles added in each region, enabling better assessment of growth initiatives and infrastructure development.
- Permits Secured by Project Phase: Monitor permit approvals across project stages to identify regulatory bottlenecks, accelerate approvals, and reduce implementation delays.
- Safety Incidents by Severity: Evaluate workplace and operational safety incidents based on severity to identify risk areas, strengthen safety practices, and reduce accidents.
- Historical Performance Comparison: Compare current project and financial performance against historical data to measure progress, identify trends, and detect areas of concern.
- Geographic Heatmap Analysis: Use location-based visualizations to pinpoint regions experiencing high CapEx variance, project delays, or expansion challenges, enabling targeted corrective actions.
Benefits of a Natural Gas Pipeline Expansion & CapEx Execution Dashboard
The following are the benefits of using this permit approval tracking dashboard:
- Enhanced CapEx Execution Monitoring: Provide comprehensive financial tracking and visibility into capital expenditures to improve budget management and project oversight.
- Improved Pipeline Expansion Tracking: Monitor project progress, milestones, and timelines to ensure pipeline expansion initiatives remain on schedule and aligned with business objectives.
- Optimized Infrastructure Investment Analytics: Analyze investment performance and spending patterns to support better budget allocation and maximize returns on pipeline infrastructure projects.
- Support for Capacity Expansion Planning: Enable data-driven decision-making for gas transmission pipeline capacity expansion by providing insights into project performance, demand, and resource utilization.
- Reduced Cost Overruns: Identify CapEx variances early to take corrective actions, control project expenses, and minimize budget overruns.
- Streamlined Permit Approval Tracking: Monitor permit statuses and approval timelines to avoid regulatory delays and keep projects progressing efficiently.
- Strengthened Safety Compliance: Analyze safety incident trends to improve risk management, enhance workplace safety, and ensure compliance with industry regulations.
- Strategic Growth Planning: Align infrastructure investments with future demand forecasts and business goals to support sustainable growth and long-term network expansion.
KPIs to Track in a Natural Gas Pipeline Expansion & CapEx Execution Dashboard
The following key KPIs can be tracked by using this infrastructure progress reporting dashboard:
- Total CapEx Spend ($M): Measures total capital expenditure on pipeline expansion projects.
- Project Schedule Adherence (%): Tracks the percentage of projects completed on time.
- CapEx Variance (%): Indicates budget deviations (positive or negative) from planned spending.
- Pipeline Miles Added (miles): Shows the total length of new pipelines constructed.
- Permits Secured (count): Tracks the number of regulatory approvals obtained.
- Safety Incidents (count): Monitors workplace accidents to assess operational risk.
Frequently Asked Questions
1. What is a Natural Gas Pipeline Expansion & CapEx Execution Dashboard used for?
It helps utilities track pipeline expansion progress, CapEx spending, permit approvals, and safety incidents to optimize infrastructure growth.
2. What data sources feed this gas transmission growth dashboard?
Project management systems, financial software, regulatory databases, and safety incident logs.
3. How does this capital expenditure monitoring dashboard improve CapEx execution?
By providing financial tracking, variance analysis, and project progress monitoring to prevent cost overruns.