
What is a Natural Gas Industrial & Commercial Customer Sales Dashboard?
A natural gas industrial & commercial customer sales dashboard is a specialized analytics tool designed for energy providers, utilities, and gas suppliers to monitor sales performance, customer consumption patterns, and revenue trends. This dashboard consolidates data from billing systems, demand response programs, contract signings, and regional distribution metrics into a single interface. By tracking key performance indicators (KPIs) such as therm sales volume, churn rate, and C&I (commercial and industrial) penetration, utilities gain actionable insights to optimize pricing strategies, improve customer retention, and forecast demand. The dashboard also helps identify high-value contracts, assess program effectiveness, and streamline sales operations for industrial and commercial clients.
How to Create a Natural Gas Industrial & Commercial Customer Sales Dashboard
You don’t need to build your report from scratch; just start with a ready-to-use dashboard template from Mokkup. Add in your data and export it however you like. Here’s how to do it:
1. Create or Log in to Your Mokkup Account
Start by signing up on Mokkup.ai using your email. If you already have an account, just log in, and you’ll be good to go.
2. Choose and Customize Your Dashboard Template
Find the Natural Gas Industrial & Commercial Customer Sales Dashboard template in the Templates section. Use the drag and drop editor to adjust KPIs, edit filters, or add elements based on your data.
3. Export to Your BI Tool
Once your dashboard wireframe is ready, use the BI Tool Export feature to send it directly to Power BI or Tableau for further analysis and enhancements. You can also download the dashboard as a PDF, PNG, or JPEG, embed it on a platform, or invite your team to collaborate.
Note: This is a Pro template. You’ll need a Pro subscription on Mokkup to use and customize this dashboard wireframe. Upgrade anytime to unlock full access.
Natural Gas Industrial & Commercial Customer Sales Dashboard Example
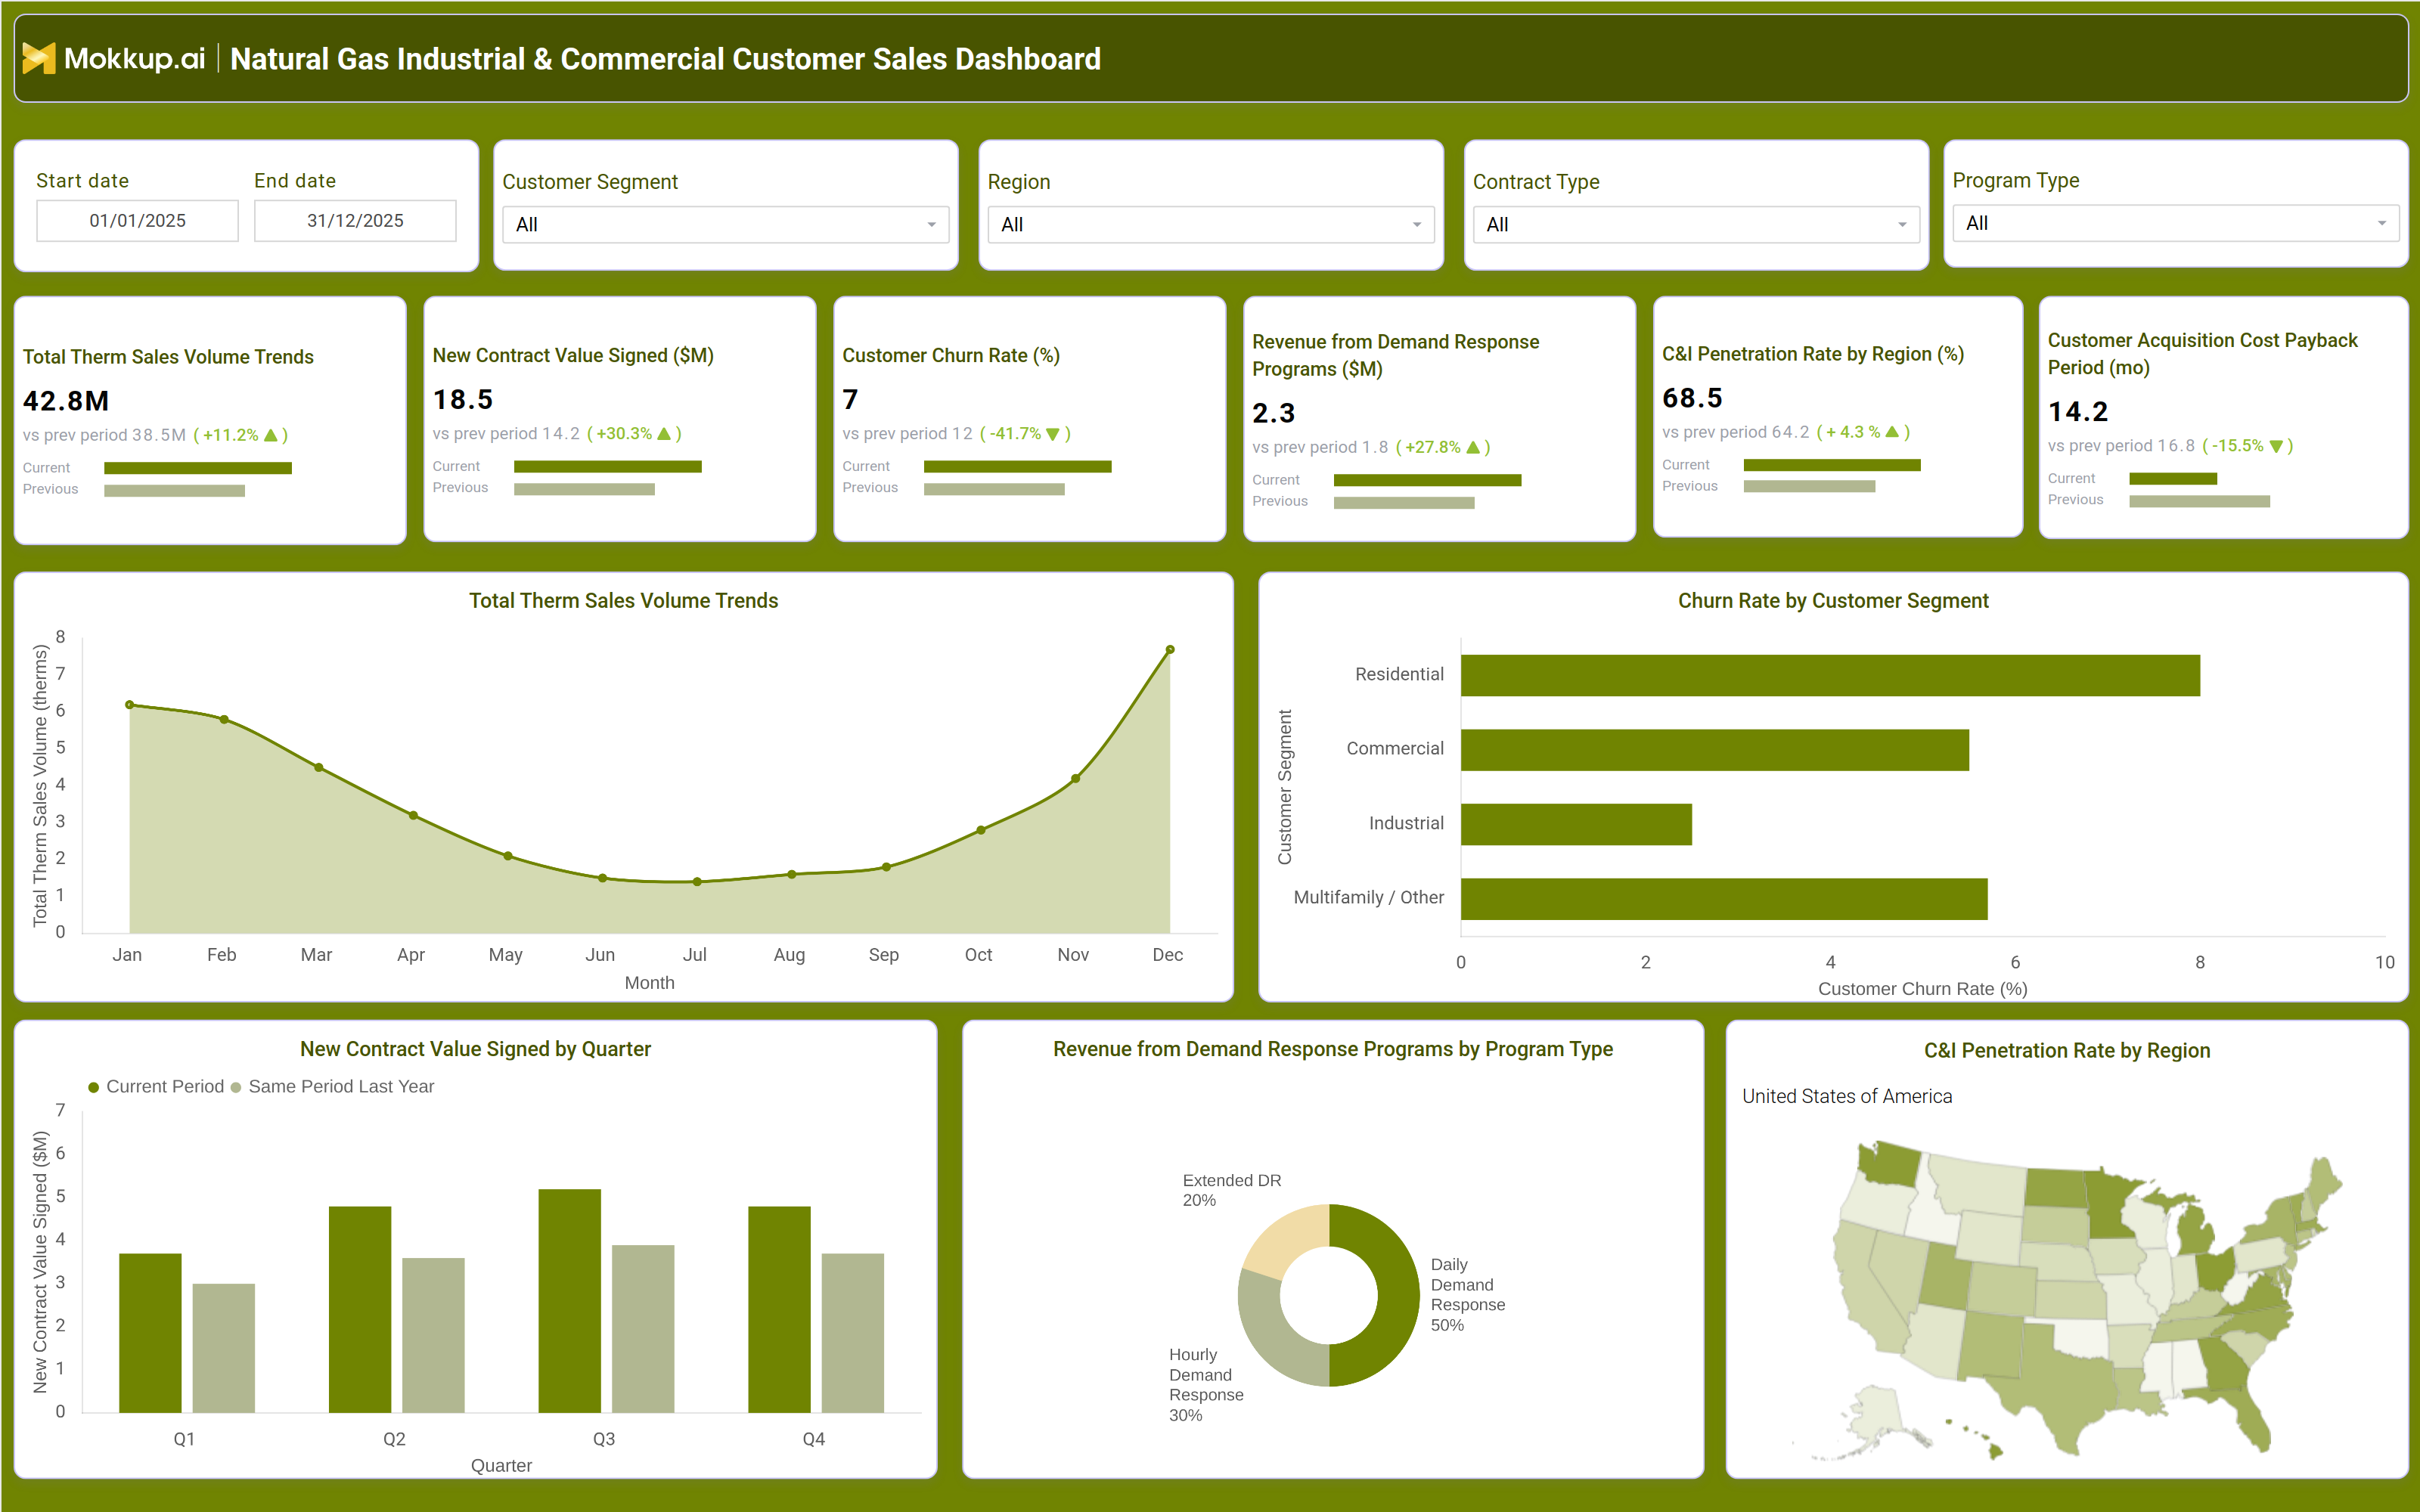
A well structured natural gas sales dashboard for industrial customers includes interactive filters for date ranges, customer segments, regions, contract types, and program participation. The dashboard typically displays key metrics such as total therm sales volume trends, new contract value signed, customer churn rate, revenue from demand response programs, and C&I penetration rates by region. Visualizations like bar charts, line graphs, and geographic heatmaps provide a clear view of sales performance over time. For example, a line chart may show monthly therm sales volume trends, while a bar graph compares new contract values across quarters. A geographic map highlights C&I penetration rates by state, helping utilities identify underperforming regions. Additional breakdowns, such as churn rate by customer segment and revenue from demand response programs, offer deeper operational insights. Together, these components create a commercial natural gas consumption tracking software that enables data driven decisionmaking for gas providers.
How to Analyze Data in a Natural Gas Industrial & Commercial Customer Sales Dashboard
Here is how you can analyze data from this C&I penetration rate dashboard:
- Review total therm sales volume trends to assess demand fluctuations and seasonal patterns.
- Track new contract value signed to measure sales team performance and revenue growth.
- Monitor customer churn rate to identify at risk accounts and improve retention strategies.
- Analyze revenue from demand response programs to evaluate program effectiveness and ROI.
- Compare C&I penetration rates by region to target expansion opportunities in underperforming areas.
- Assess the customer acquisition cost payback period to optimize marketing and sales spend.
- Break down churn rate by customer segment to tailor retention efforts for industrial vs. commercial clients.
- Evaluate contract type performance to focus on high value agreements.
- Use geographic heatmaps to visualize regional sales performance and demand distribution.
Benefits of a Natural Gas Industrial & Commercial Customer Sales Dashboard
The following are the benefits of using this demand response revenue dashboard:
- Enhances sales performance tracking with therm sales volume and contract value data.
- Improves customer retention by identifying churn risks and implementing targeted strategies.
- Optimizes demand response programs through revenue and participation analytics.
- Supports regional expansion by highlighting high potential markets for C&I penetration.
- Reduces customer acquisition costs with payback period analysis.
- Streamlines sales operations by automating reporting and performance monitoring.
- Enables data driven pricing strategies based on consumption trends and contract performance.
- Strengthens decision making with actionable insights for industrial and commercial gas sales.
KPIs to Track in a Natural Gas Industrial & Commercial Customer Sales Dashboard
The following key KPIs can be tracked by using this dashboard:
- Total Therm Sales Volume (Therms): Measures total natural gas consumption by industrial and commercial customers.
- New Contract Value Signed ($M): Tracks the monetary value of newly signed contracts within a period.
- Customer Churn Rate (%): Indicates the percentage of customers who discontinue service.
- Revenue from Demand Response Programs ($M): Evaluates income generated from demand flexibility initiatives.
- C&I Penetration Rate by Region (%): Shows the market share of commercial and industrial customers in a specific area.
- Customer Acquisition Cost Payback Period (Months): Calculates the time required to recover acquisition costs from new customers.
Frequently Asked Questions
1. What is a commercial gas customer retention dashboard used for?
A natural gas sales dashboard for industrial customers is an analytics tool that tracks sales performance, consumption trends, and revenue metrics for industrial and commercial gas clients. It helps utilities monitor therm sales, contract signings, churn rates, and demand response program effectiveness.
2. What data sources feed into this industrial gas consumption tracking dashboard?
Data sources include billing systems, CRM platforms, demand response program records, contract management tools, and regional distribution reports.
3. Who should use a natural gas sales dashboard?
Gas providers, utility companies, energy sales teams, and operations managers use this dashboard to track industrial and commercial customer performance, sales growth, and program effectiveness.