
What is a Natural Gas Distribution Losses and Network Efficiency Dashboard?
A natural gas distribution losses dashboard is a specialized analytics tool used by gas utilities to monitor losses, efficiency, and operational performance across distribution networks. It focuses on identifying unaccounted-for gas (UFG), leakage incidents, pressure losses, and inefficiencies in gas delivery systems. This type of gas network efficiency monitoring dashboard provides visibility into how effectively gas is transported from input points to end consumers. The dashboard integrates operational, metering, and network data to track key metrics such as total gas loss, distribution efficiency, and pipeline utilization.
It helps utilities detect leakage patterns, monitor pressure drops, and analyze discrepancies between gas input and delivered volumes. A well-designed gas distribution loss analysis dashboard supports proactive decision-making, enabling utilities to reduce losses, improve network reliability, and optimize asset performance.
How to Create a Natural Gas Distribution Losses and Network Efficiency Dashboard
You don’t need to build your report from scratch, just start with a ready-to-use Natural Gas Distribution Losses and Network Efficiency dashboard template from Mokkup. Add in your data and export it however you like. Here’s how to do it:
1. Create or Log in to Your Mokkup Account
Start by signing up on Mokkup.ai using your email. If you already have an account, just log in, and you’ll be good to go.
2. Choose and Customize Your Dashboard Template
Find the Natural Gas Distribution Losses and Network Efficiency Dashboard template in the Templates section. Use the drag-and-drop editor to adjust KPIs, edit filters, or add elements based on your data.
3. Export to Your BI Tool
Once your dashboard wireframe is ready, use the BI Tool Export feature to send it directly to Power BI or Tableau for further analysis and enhancements. You can also download the dashboard as a PDF, PNG, or JPEG, embed it on a platform, or invite your team to collaborate.
Note: This is a Pro template. You’ll need a Pro subscription on Mokkup to use and customize this dashboard wireframe. Upgrade anytime to unlock full access.
Natural Gas Distribution Losses and Network Efficiency Dashboard Example
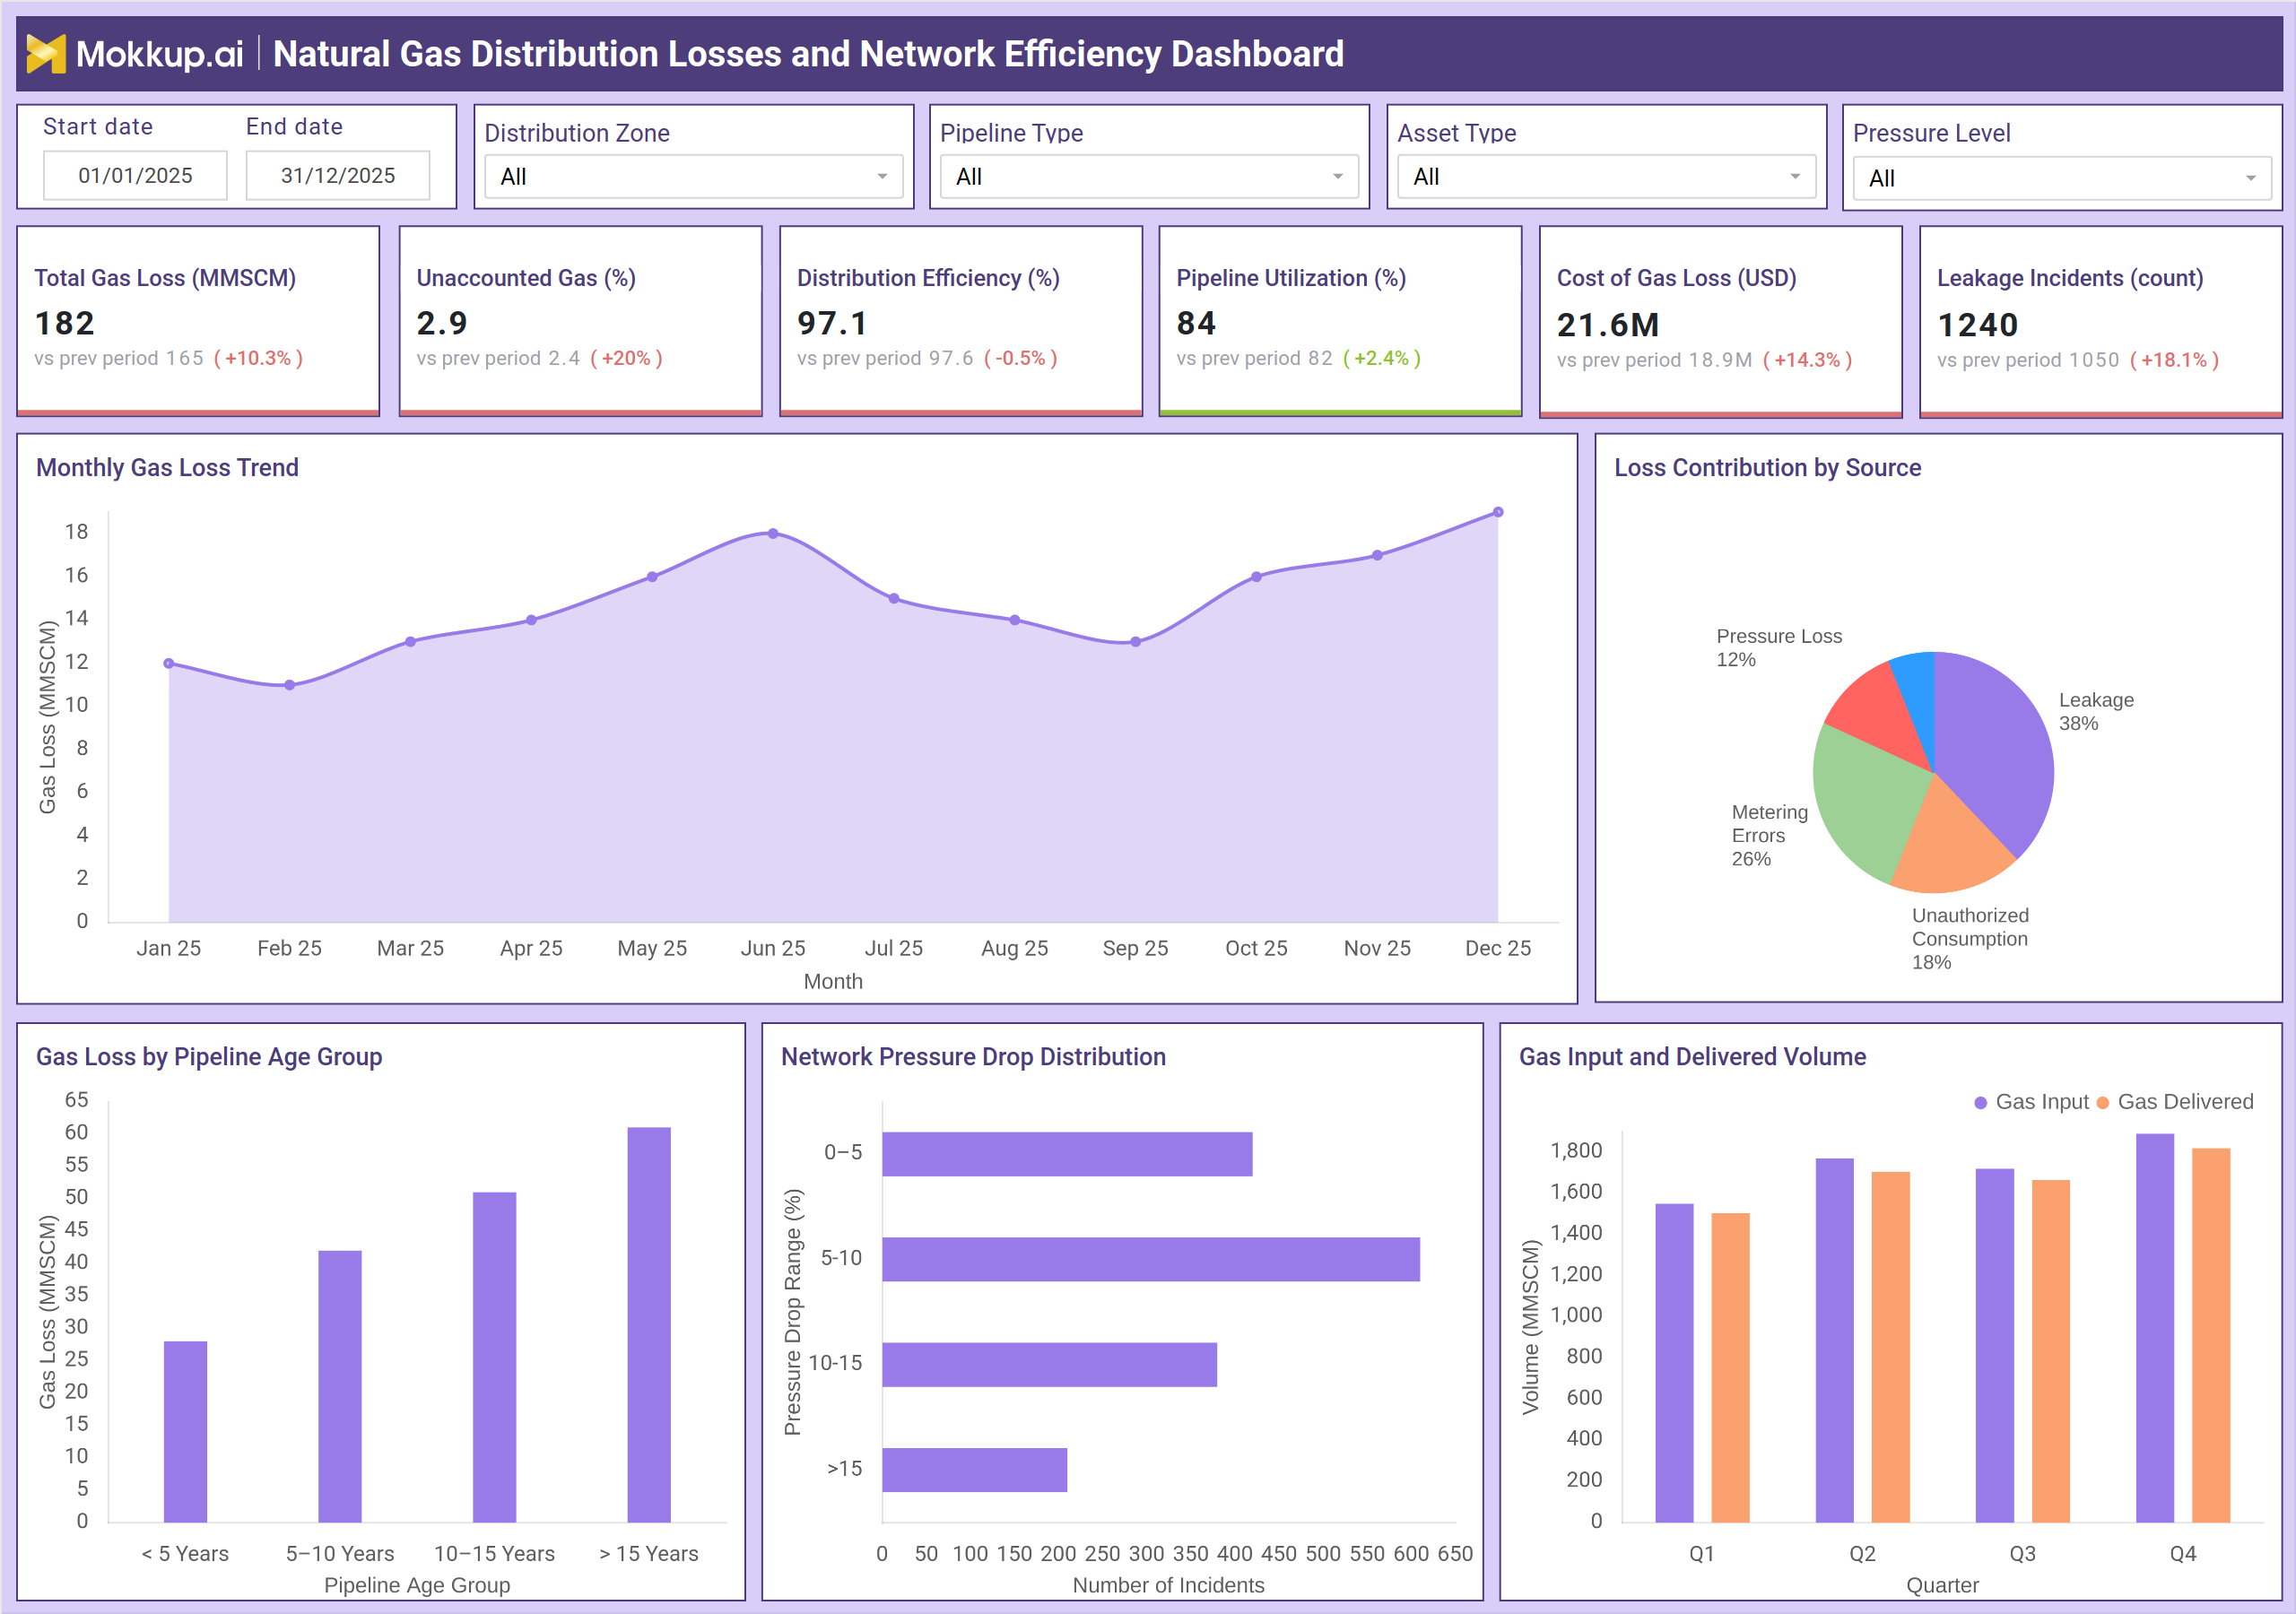
A typical gas distribution efficiency tracking dashboard provides a structured view of network performance using KPIs and visual analytics. At the top level, KPIs such as total gas loss, unaccounted gas percentage, and distribution efficiency give a quick summary of network health. Metrics like pipeline utilization and cost of gas loss provide insights into operational and financial efficiency. Trend visuals such as monthly gas loss help track how losses evolve over-time, highlighting seasonal or operational patterns. Contribution analysis shows the primary sources of losses, including leakage, metering errors, and unauthorized consumption.
Pipeline age analysis helps identify older infrastructure contributing to higher losses, while pressure drop distribution highlights network inefficiencies. Additionally, comparing gas input versus delivered volume helps quantify system losses directly. This natural gas leakage monitoring dashboard allows operators to pinpoint inefficiencies, prioritize maintenance, and improve overall distribution performance.
How to Analyze Data in Natural Gas Distribution Losses and Network Efficiency Dashboard
Here is how you can analyze data from this dashboard:
- Loss Level Assessment: Start with total gas loss and UFG (%) to understand overall network loss levels.
- Supply vs Delivery Reconciliation: Compare gas input vs delivered volume to identify discrepancies.
- Trend Monitoring: Monitor monthly gas loss trends to detect rising losses or seasonal patterns.
- Loss Driver Analysis: Analyze loss contribution by source to identify key causes such as leakage or metering errors.
- Pipeline Utilization Evaluation: Evaluate pipeline utilization (%) to understand capacity efficiency.
- Distribution Efficiency Review: Review distribution efficiency (%) to measure delivery effectiveness.
- Aging Infrastructure Analysis: Assess gas loss by pipeline age group to identify risks from older assets.
- Pressure Drop Analysis: Analyze pressure drop distribution to detect flow inefficiencies and imbalances.
- Leakage Monitoring: Track leakage incidents count to assess operational reliability and safety risks.
- Financial Impact Evaluation: Evaluate cost of gas loss (USD) to prioritize corrective actions.
Benefits of Natural Gas Distribution Losses and Network Efficiency Dashboard
The following are the benefits of using this dashboard:
- Network Visibility: Provides clear insight into gas losses and efficiency performance.
- Proactive Issue Detection: Enables early identification of leaks and inefficiencies.
- Improved UFG Control: Strengthens monitoring and reduction of unaccounted-for gas.
- Data-Driven Maintenance: Supports asset repair and replacement planning.
- Cost Reduction: Lowers operational costs by minimizing losses.
- Enhanced Reliability: Improves supply consistency and network performance.
- Regulatory Compliance: Supports accurate reporting and compliance tracking.
- Optimized Operations: Helps improve pipeline utilization and pressure management.
- Targeted Interventions: Identifies high-risk areas for focused action.
- Performance Improvement: Strengthens overall distribution network efficiency.
KPIs to Track in Natural Gas Distribution Losses and Network Efficiency Dashboard
The following key KPIs can be tracked by using this dashboard:
- Total Gas Loss (MMSCM): Measures total volume of gas lost across the distribution network
- Unaccounted Gas (%): Tracks percentage of gas lost due to leakage, theft, or metering inaccuracies
- Distribution Efficiency (%): Indicates how efficiently gas is delivered compared to input
- Pipeline Utilization (%): Measures how effectively pipeline capacity is being used
- Cost of Gas Loss (USD): Quantifies financial impact of gas losses
- Leakage Incidents (Count): Tracks number of leakage events affecting operations
- Monthly Gas Loss Trend (MMSCM): Shows how gas losses change over time
- Loss Contribution by Source (%): Identifies key sources such as leakage, metering errors, and unauthorized consumption
- Gas Loss by Pipeline Age Group: Highlights impact of aging infrastructure on losses
- Network Pressure Drop Distribution: Tracks pressure inefficiencies across the network
- Gas Input vs Delivered Volume (MMSCM): Compares supplied vs delivered gas to identify losses
Frequently Asked Questions
Q1. What is unaccounted-for gas (UFG)?
UFG represents the difference between gas supplied into the network and gas billed to customers, often caused by leakage, theft, or measurement errors.
Q2. Why is monitoring gas losses important?
Monitoring gas losses helps reduce operational costs, improve safety, and enhance overall network efficiency.
Q3. How does this dashboard help reduce leakage?
It identifies leakage patterns, tracks incidents, and highlights high-risk areas for maintenance and repair.