
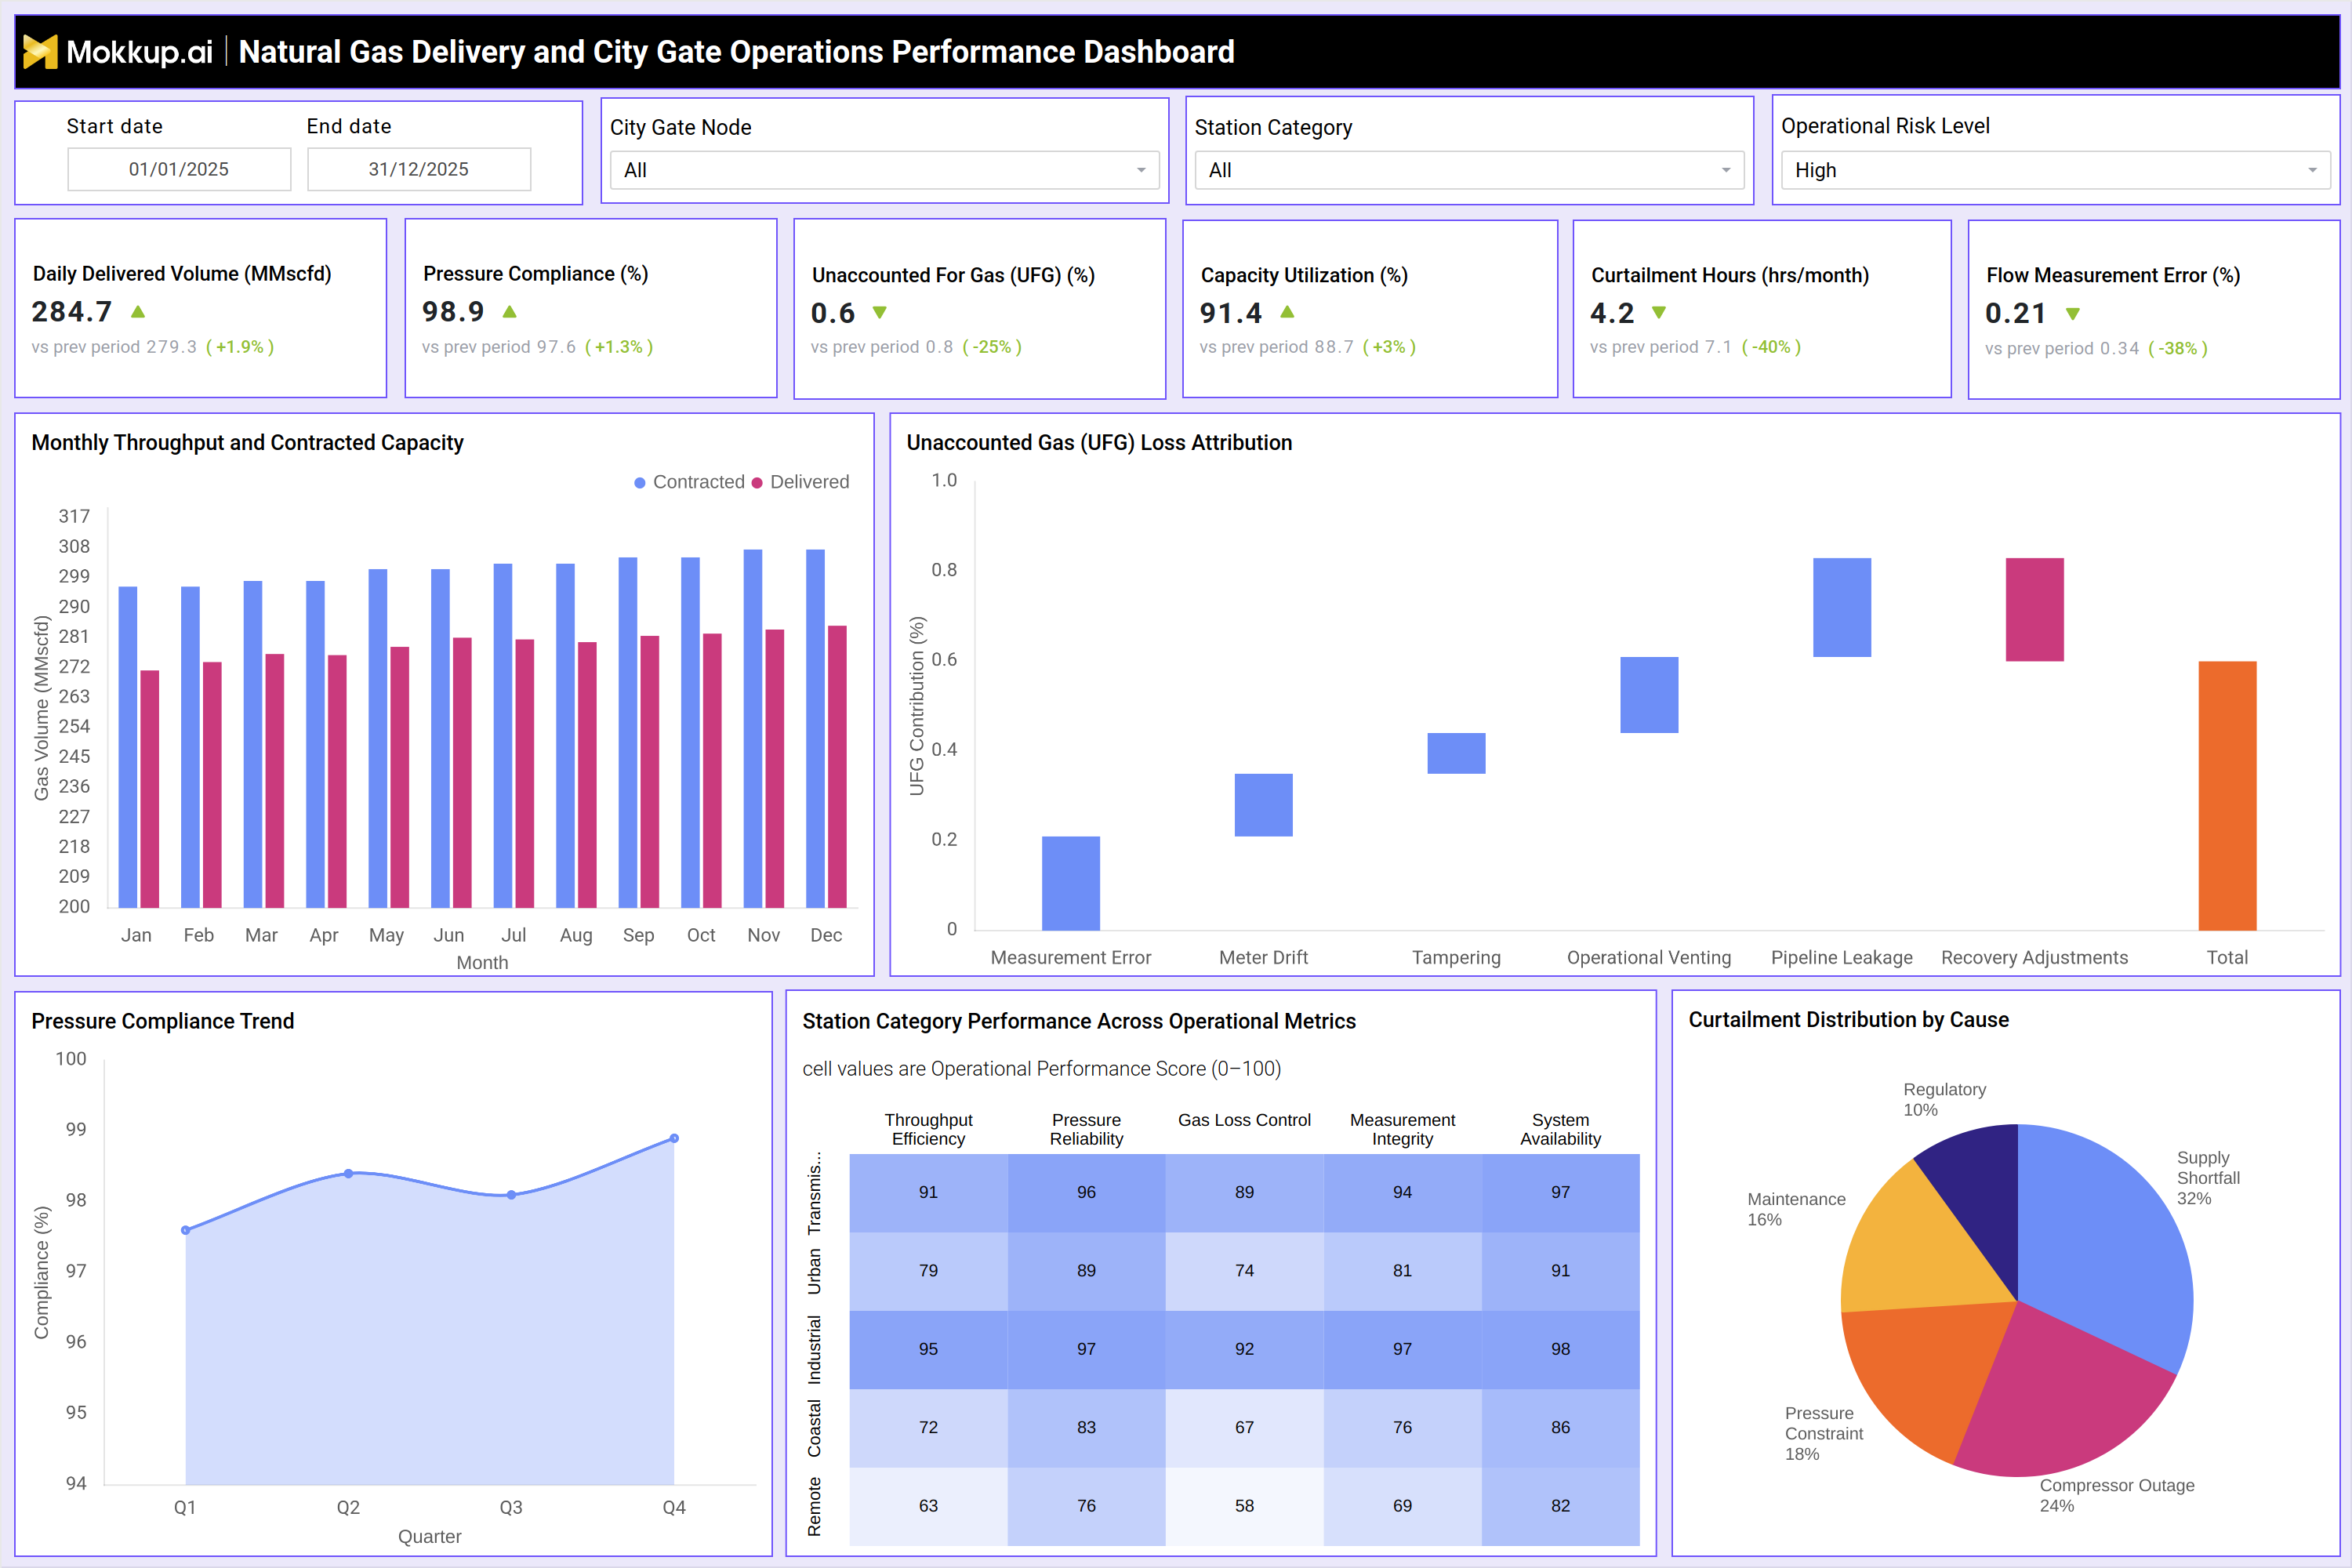
What is a Natural Gas Delivery and City Gate Operations Performance Dashboard?
A natural gas delivery and city gate operations performance dashboard is a centralized analytics platform used by gas utilities to monitor delivery performance, pressure compliance, and flow efficiency at city gate stations. City gate stations act as the interface between transmission pipelines and distribution networks. These stations regulate pressure, measure gas flow, and ensure supply reliability to downstream consumers. A city gate gas distribution performance monitoring dashboard consolidates operational data such as throughput, pressure compliance, and gas loss metrics. It enables operators to monitor system efficiency and detect deviations. The dashboard also functions as a natural gas city gate operations analytics dashboard for tracking performance across station categories and pipeline segments. Operators can evaluate gas delivery volumes, capacity utilization, and measurement accuracy. As a gas delivery performance monitoring dashboard for utilities, it improves operational visibility. This city gate pressure and flow monitoring dashboard supports reliable and efficient gas distribution operations.
How to Create a Natural Gas Delivery and City Gate Operations Performance Dashboard
You don't need to build your report from scratch; just start with a ready-to-use dashboard template from Mokkup. Add in your data and export it however you like. Here's how to do it:
1. Create or Log in to Your Mokkup Account
Start by signing up on Mokkup.ai using your email. If you already have an account, just log in, and you'll be good to go.
2. Choose and Customize Your Dashboard Template
Find the Natural Gas Delivery and City Gate Operations Performance Dashboard template in the Templates section. Use the drag-and-drop editor to adjust KPIs, edit filters, or add elements based on your data.
3. Export to Your BI Tool
Once your dashboard wireframe is ready, use the BI Tool Export feature to send it directly to Power BI or Tableau for further analysis and enhancements. You can also download the dashboard as a PDF, PNG, or JPEG, embed it on a platform, or invite your team to collaborate.
Note: This is a Pro template. You'll need a Pro subscription on Mokkup to use and customize this dashboard wireframe. Upgrade anytime to unlock full access.
Natural Gas Delivery and City Gate Operations Performance Dashboard
A gas utility managing multiple city gate stations must ensure consistent gas delivery while maintaining pressure and flow compliance. A natural gas delivery and city gate operations performance dashboard provides a centralized view of delivery volumes, pressure compliance, and system utilization. Operators can monitor daily delivered volume alongside contracted capacity to evaluate supply performance. The dashboard highlights pressure compliance trends to ensure gas is delivered within regulatory limits. Unaccounted for gas (UFG) metrics help identify losses due to leakage, measurement error, or operational inefficiencies. A natural gas distribution city gate KPI dashboard also tracks capacity utilization and curtailment hours across stations. Flow measurement error monitoring ensures billing and metering accuracy. Operational performance across station categories highlights differences between urban, industrial, and remote locations. This city gate gas distribution performance monitoring dashboard enables utilities to optimize delivery efficiency and maintain compliance.
How to Analyze Data in Natural Gas Delivery and City Gate Operations Performance Dashboard
Here is how you can analyze data from this dashboard:
- Start by reviewing daily delivered volume to assess gas supply performance across city gate stations.
- Analyze pressure compliance to ensure delivery meets regulatory and operational limits.
- Monitor unaccounted for gas (UFG) to identify losses in the distribution system.
- Track capacity utilization to evaluate efficiency of gas transmission to distribution transfer.
- Review curtailment hours to understand supply disruptions or operational constraints.
- Analyze flow measurement error to ensure metering accuracy and billing reliability.
- Compare delivered versus contracted capacity to identify supply-demand gaps.
- Study UFG loss attribution to identify root causes such as leakage or measurement errors.
- Evaluate station category performance across throughput efficiency and system availability.
- Monitor pressure compliance trends to detect performance changes over time.
Benefits of Natural Gas Delivery and City Gate Operations Performance Dashboard
The following are the benefits of using this dashboard:
- Provides centralized visibility into gas delivery and city gate operations.
- Improves monitoring of pressure, flow, and throughput performance.
- Enables early detection of gas losses and operational inefficiencies.
- Enhances compliance with regulatory pressure and delivery standards.
- Improves capacity utilization across gas transmission and distribution systems.
- Supports accurate metering and billing through flow measurement monitoring.
- Helps reduce curtailment and supply disruptions.
- Enables better operational planning across city gate stations.
- Improves performance comparison across station categories and regions.
- Strengthens decision-making for gas distribution operations.
KPIs to Track in Natural Gas Delivery and City Gate Operations Performance Dashboard
The following key KPIs can be tracked by using this dashboard:
- Daily Delivered Volume (MMscfd): Total gas volume delivered through city gate stations.
- Pressure Compliance (%): Percentage of time gas delivery meets required pressure limits.
- Unaccounted For Gas (UFG) (%): Percentage of gas losses due to leakage, measurement error, or operational factors.
- Capacity Utilization (%): Degree to which available pipeline capacity is utilized.
- Curtailment Hours (hrs/month): Total hours of reduced or interrupted gas supply.
- Flow Measurement Error (%): Accuracy of gas flow measurement systems.
- Monthly Throughput vs Contracted Capacity: Comparison of actual delivered volume against contracted supply levels.
- UFG Loss Attribution: Breakdown of gas loss causes such as measurement error, meter drift, tampering, or leakage.
- Pressure Compliance Trend: Trend of pressure adherence over time.
- Station Category Performance Across Operational Metrics: Performance comparison across station types based on throughput, reliability, and system availability.
- Curtailment Distribution by Cause: Breakdown of curtailment reasons such as supply shortfall, compressor outage, and maintenance.
Frequently Asked Questions
1. What is a natural gas delivery and city gate operations performance dashboard?
It is a monitoring platform that tracks gas delivery, pressure compliance, flow accuracy, and operational performance at city gate stations.
2. Who uses a city gate gas distribution performance monitoring dashboard?
Gas utility operators, pipeline managers, distribution planners, and operations teams use this dashboard.
3. Why is city gate monitoring important in gas distribution?
City gate stations regulate pressure and flow between transmission and distribution systems, making them critical for reliable gas delivery.
4. What KPIs are tracked in a natural gas delivery and city gate operations performance dashboard?
Key KPIs include daily delivered volume, pressure compliance, unaccounted for gas (UFG), capacity utilization, curtailment hours, flow measurement error, and monthly throughput versus contracted capacity.
5. What are the benefits of using a city gate operations performance dashboard?
It provides centralized visibility into gas delivery, improves pressure and flow monitoring, enables early detection of gas losses, enhances regulatory compliance, and supports better operational planning across city gate stations.