
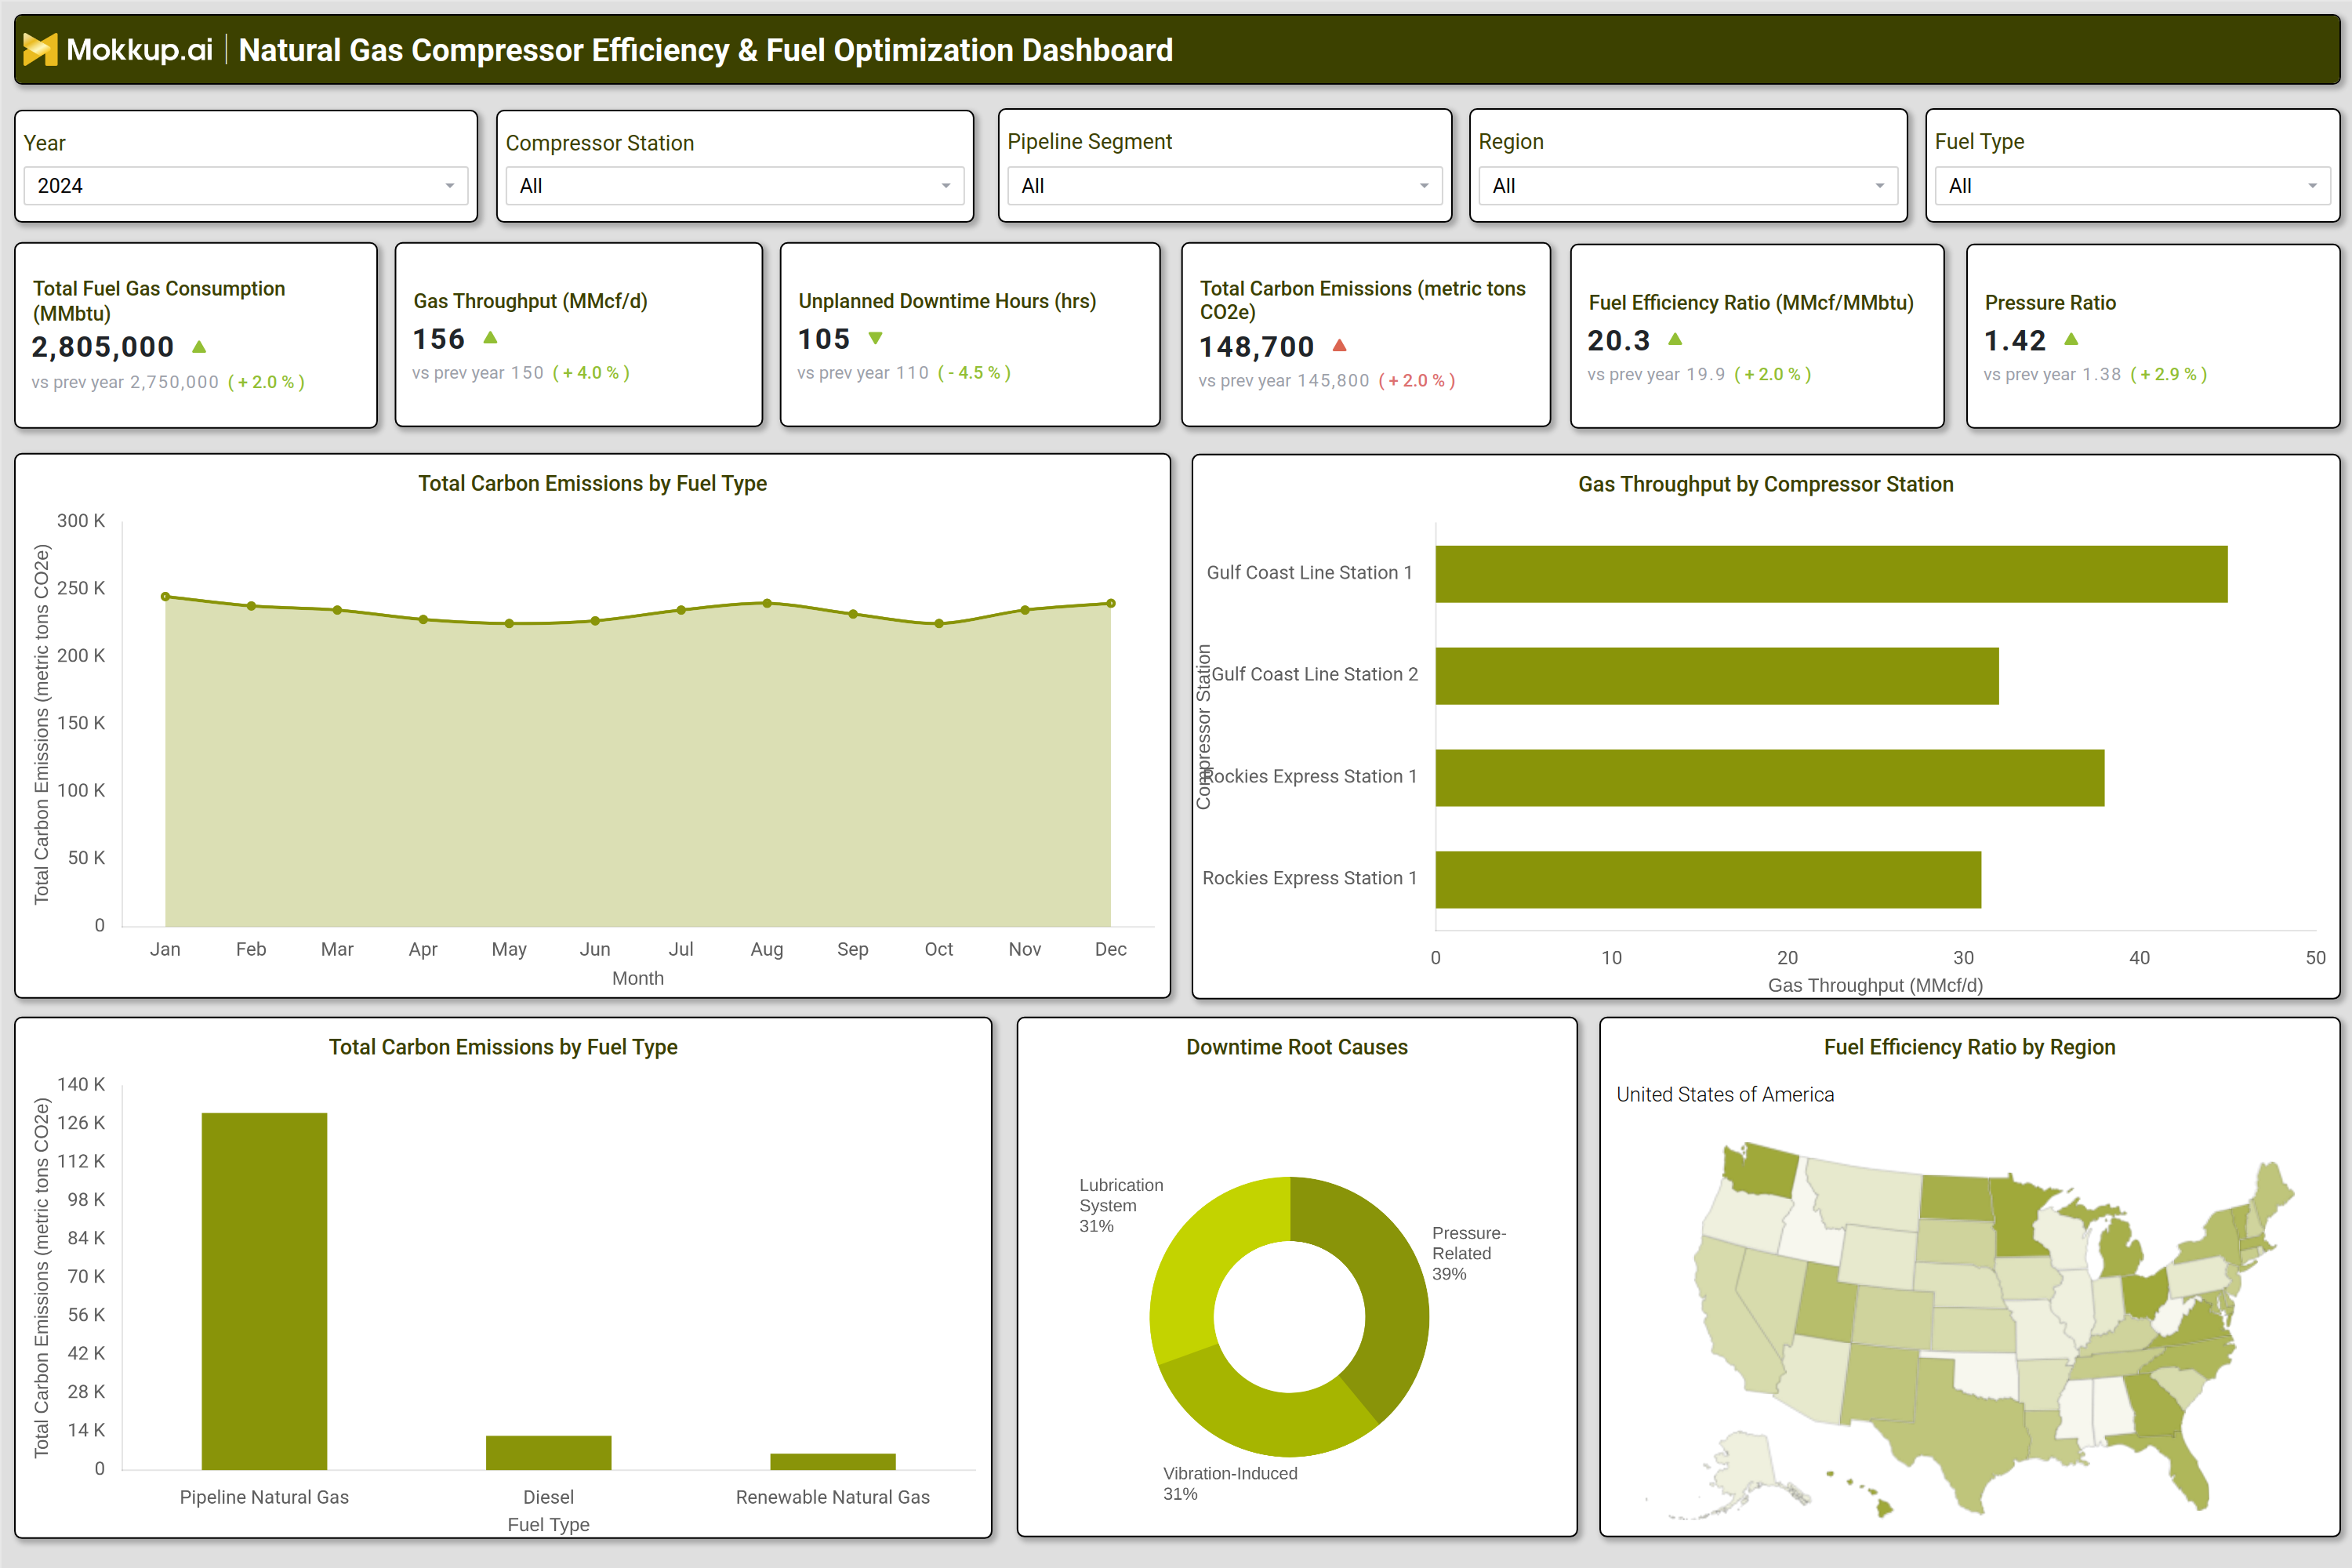
What is a Natural Gas Compressor Efficiency & Fuel Optimization Dashboard?
Natural gas transmission relies on compressor stations to maintain pressure and ensure efficient fuel delivery across pipelines. However, inefficiencies in compressor performance can lead to higher fuel consumption, increased emissions, and operational costs. A natural gas transmission compressor efficiency & fuel optimization dashboard provides pipeline operators with a data-driven tool to monitor, analyze, and optimize compressor performance. This dashboard consolidates fuel usage, throughput, emissions, and efficiency metrics into a single interface, enabling operators to reduce waste, improve fuel efficiency, and lower carbon emissions. By tracking key performance indicators (KPIs), utilities can identify underperforming compressors, optimize fuel consumption, and enhance overall pipeline efficiency.
How to Create a Natural Gas Compressor Efficiency & Fuel Optimization Dashboard
You don't need to build your report from scratch, just start with a ready-to-use dashboard template from Mokkup. Add in your data and export it however you like. Here's how to do it:
1. Create or Log in to Your Mokkup Account
Start by signing up on Mokkup.ai using your email. If you already have an account, just log in, and you'll be good to go.
2. Choose and Customize Your Dashboard Template
Find the Natural Gas Compressor Efficiency & Fuel Optimization Dashboard template in the Templates section. Use the drag-and-drop editor to adjust KPIs, edit filters, or add elements based on your data.
3. Export to Your BI Tool
Once your dashboard wireframe is ready, use the BI Tool Export feature to send it directly to Power BI or Tableau for further analysis and enhancements. You can also download the dashboard as a PDF, PNG, or JPEG, embed it on a platform, or invite your team to collaborate.
Note: This is a Pro template. You'll need a Pro subscription on Mokkup to use and customize this dashboard wireframe. Upgrade anytime to unlock full access.
Natural Gas Compressor Efficiency & Fuel Optimization Dashboard Example
A well-designed compressor efficiency and fuel optimization dashboard includes interactive filters for year, compressor station, pipeline segment, region, and fuel type. Key metrics displayed in performance tiles include total fuel gas consumption, gas throughput, unplanned downtime hours, carbon emissions, fuel efficiency ratio, and pressure ratio. Trend charts show monthly carbon emissions by fuel type, helping operators assess environmental impact. A gas throughput breakdown by compressor station highlights high-performing and underutilized assets. A downtime root cause analysis identifies whether failures stem from pressure-related issues, lubrication system failures, or vibration-induced problems. Additionally, a fuel efficiency heatmap by region allows operators to compare performance across different pipeline networks. Together, these components provide a comprehensive view of compressor efficiency, enabling data-driven decisions to reduce fuel waste, improve operational reliability, and meet sustainability goals.
How to Analyze Data in a Natural Gas Compressor Efficiency & Fuel Optimization Dashboard
Here is how you can analyze data from this downtime root cause analysis dashboard:
- Total Fuel Gas Consumption: Monitor overall fuel gas usage to identify consumption trends, detect inefficiencies, and uncover opportunities for cost and energy savings.
- Gas Throughput (MMcf/d): Track gas throughput to evaluate compressor station productivity, measure capacity utilization, and ensure efficient pipeline operations.
- Unplanned Downtime Hours: Review unexpected downtime to assess equipment reliability, minimize operational disruptions, and improve system availability.
- Total Carbon Emissions: Analyze greenhouse gas emissions to measure environmental impact, support sustainability initiatives, and ensure compliance with regulatory requirements.
- Fuel Efficiency Ratios (MMcf/MMbtu): Compare fuel efficiency across compressor stations to identify high-performing assets, optimize operations, and reduce fuel consumption.
- Pressure Ratios: Evaluate compressor pressure ratios to ensure equipment operates within optimal ranges, maintaining performance, safety, and energy efficiency.
- Downtime Root Cause Analysis: Examine the underlying causes of equipment failures and outages to prioritize maintenance activities and prevent recurring issues.
- Regional Fuel Efficiency Assessment: Analyze fuel efficiency by geographic region to identify performance variations and implement location-specific optimization strategies.
- Historical Performance Benchmarking: Compare current operational metrics against historical data to track performance trends, measure improvements, and identify areas requiring attention.
Benefits of a Natural Gas Compressor Efficiency & Fuel Optimization Dashboard
The following are the benefits of using this gas throughput monitoring dashboard:
- Reduced Fuel Consumption: Identify inefficient compressors and optimize operating parameters to lower fuel usage and improve overall energy efficiency.
- Lower Operational Costs: Improve fuel management practices and minimize unplanned downtime to reduce operating expenses and maximize asset utilization.
- Minimized Carbon Emissions: Enhance compressor efficiency and reduce energy waste to lower greenhouse gas emissions and support sustainability goals.
- Enhanced Pipeline Reliability: Monitor unplanned downtime and maintenance requirements to improve equipment reliability and ensure uninterrupted pipeline operations.
- Stronger Regulatory Compliance: Support adherence to environmental regulations through accurate emissions tracking, monitoring, and reporting.
- Improved Decision-Making: Leverage historical performance data and operational insights to make informed decisions and drive continuous improvement initiatives.
- Optimized Compressor Station Operations: Balance gas throughput and fuel efficiency to maximize compressor station performance while minimizing energy consumption.
- Predictive Maintenance Enablement: Analyze equipment failure patterns and downtime causes to identify potential issues early and prevent unexpected breakdowns.
KPIs to Track in a Natural Gas Compressor Efficiency & Fuel Optimization Dashboard
The following key KPIs can be tracked by using this dashboard:
- Total Fuel Gas Consumption (MMBtu): Measures overall fuel usage across compressor stations.
- Gas Throughput (MMcf/d): Tracks the volume of natural gas processed daily.
- Unplanned Downtime Hours (hrs): Monitors unexpected outages affecting pipeline operations.
- Total Carbon Emissions (metric tons CO₂e): Quantifies environmental impact from fuel combustion.
- Fuel Efficiency Ratio (MMcf/MMbtu): Evaluates how efficiently fuel is converted into throughput.
- Pressure Ratio: Assesses compressor performance by comparing inlet and outlet pressures.
Frequently Asked Questions
1. What is a pipeline emissions tracking dashboard used for?
It helps pipeline operators monitor fuel consumption, optimize compressor performance, and reduce emissions by providing actionable insights.
2. What data sources feed into this natural gas fuel optimization dashboard?
Data comes from SCADA systems, compressor station logs, fuel meters, and emissions monitoring tools.
3. Who should use a compressor efficiency dashboard?
Pipeline operators, energy analysts, maintenance teams, and sustainability managers benefit from this tool.