
What is a Multi-Specialty Hospital Pharmacy Dashboard?
A Multi-Specialty Hospital Pharmacy Dashboard is a centralized digital tool for pharmacy inventory tracking in hospitals. It consolidates data on medication dispensing, inventory management, procurement efficiency, and clinical performance. By integrating key metrics, this dashboard provides pharmacy managers and hospital administrators with a real-time view of operations, enabling data-driven decisions to reduce errors, optimize inventory, and enhance patient safety. It acts as a clinical pharmacy analytics dashboard, offering insights on medication delivery, adverse drug events, and overall pharmacy workflow efficiency.
How to Create a Multi-Specialty Hospital Pharmacy Dashboard
You don’t need to build your report from scratch—just start with a ready-to-use Multi-specialty hospitalal pharmacy dashboard template from Mokkup. Add in your data and export it however you like. Here’s how to do it:
1. Create or Log in to Your Mokkup Account
Start by signing up on Mokkup.ai using your email. If you already have an account, just log in, and you’ll be good to go.
2. Choose and Customize Your Dashboard Template
Find the Multi-Specialty Hospital Pharmacy Dashboard template in the Templates section. Use the drag-and-drop editor to adjust KPIs, edit filters, or add elements based on your data.
3. Export to Your BI Tool
Once your dashboard wireframe is ready, use the BI Tool Export feature to send it directly to Power BI or Tableau for further analysis and enhancements. You can also download the dashboard as a PDF, PNG, or JPEG, embed it on a platform, or invite your team to collaborate.
Note: This is a Pro template. You’ll need a Pro subscription on Mokkup to use and customize this dashboard wireframe. Upgrade anytime to unlock full access.
Multi-Specialty Hospital Pharmacy Dashboard Example
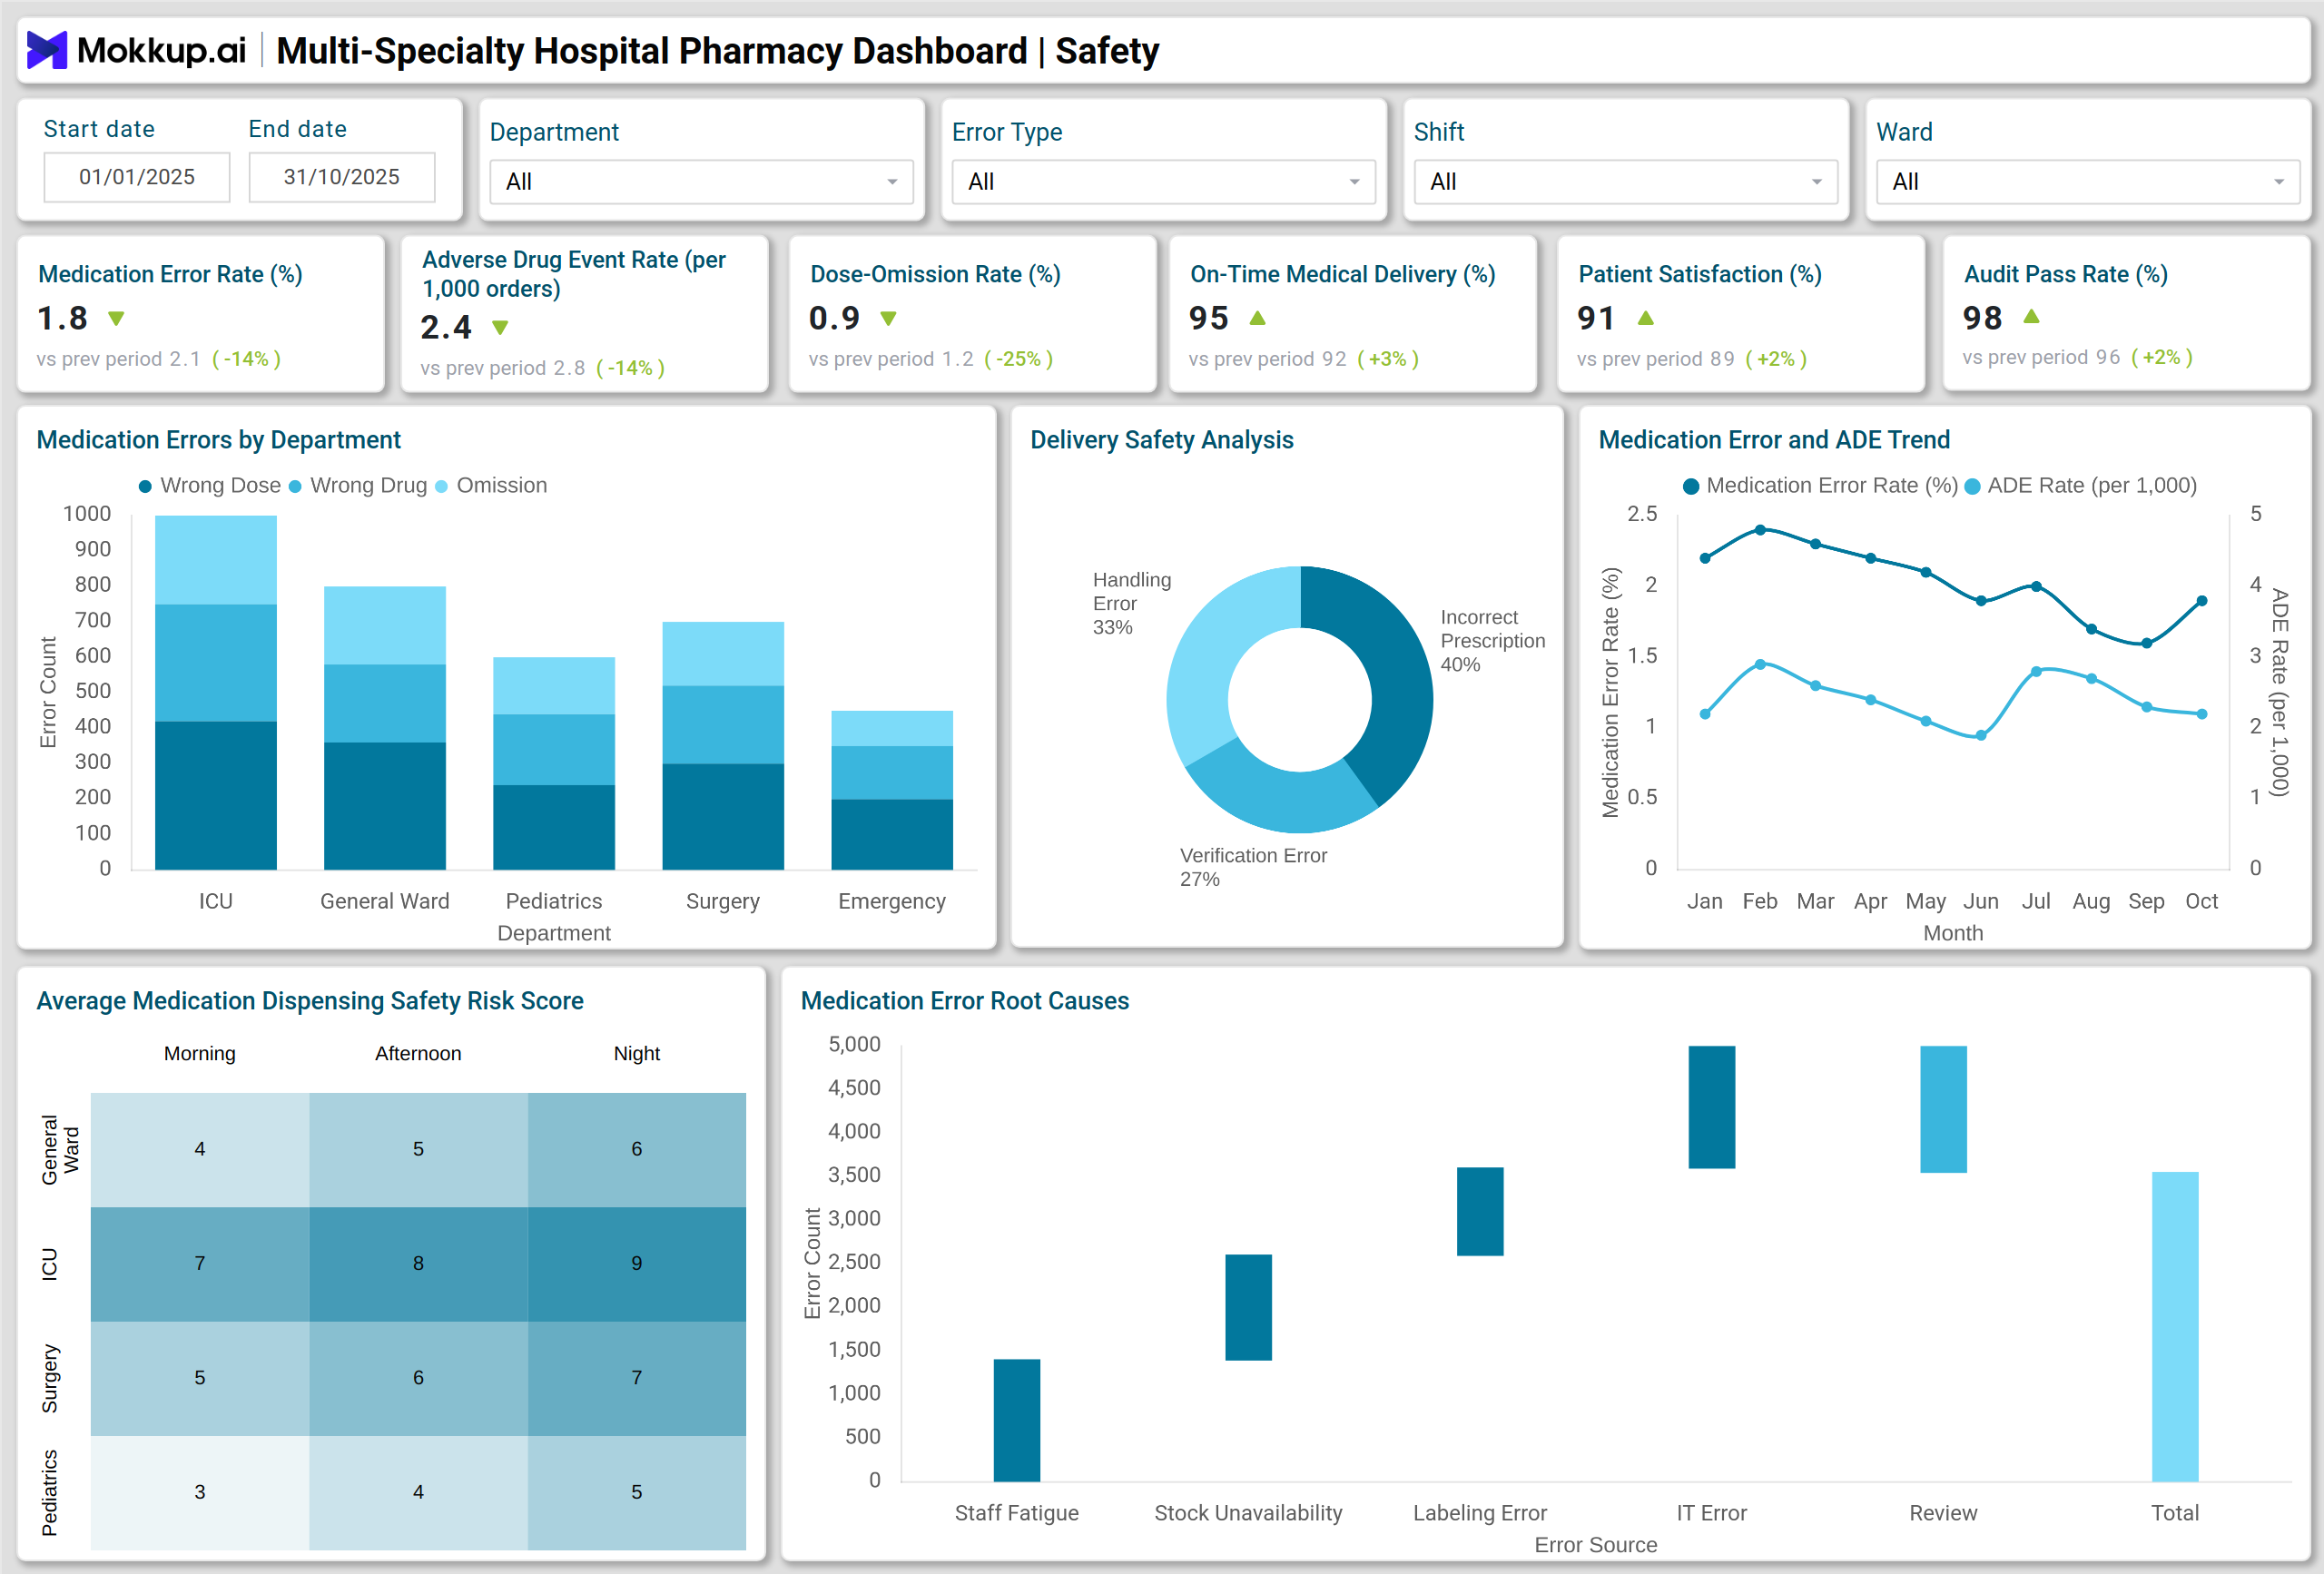
A typical hospital medication management dashboard displays multiple visualizations to represent pharmacy performance. For example, a stacked column chart can show medication errors by type and department, while a line chart tracks the trend of adverse drug events over time. A donut chart highlights delivery delays, and a heatmap visualizes average medication dispensing times across wards and shifts. Inventory performance is shown using a line+column chart for turnover versus days on hand, while a pie chart identifies wastage causes. Additionally, a funnel chart helps assess procurement-to-dispensing efficiency. These visuals together provide actionable insights for hospital pharmacy teams, serving as a comprehensive pharmacy performance dashboard for hospitals.
How to Analyze Data in Multi-Specialty Hospital Pharmacy Dashboards
To make the most of your pharmacy data, here’s how you can analyze key metrics using different visualizations:
- Track medication error trends using stacked column charts to identify high-risk departments or drug types.
- Monitor adverse drug events (ADEs) over time with line charts to implement preventive measures.
- Evaluate delivery efficiency using donut charts to reduce delays and improve patient satisfaction.
- Use heatmaps to analyze dispensing times across wards and shifts for workflow optimization.
- Assess inventory performance with line+column charts to balance turnover ratio and days on hand.
- Identify wastage patterns through pie charts and implement strategies to reduce expiry costs.
- Review the procurement-to-dispensing process using funnel charts to enhance operational efficiency.
Benefits of Multi-Specialty Hospital Pharmacy Dashboards
Implementing a well-designed hospital pharmacy dashboard offers measurable advantages across operations:
- Improved Medication Safety: Quickly identify and reduce medication errors and ADEs.
- Efficient Inventory Management: Optimize stock levels, turnover, and reduce wastage.
- Faster Medication Delivery: Monitor delays and ensure on-time delivery to patients.
- Data-Driven Decisions: Access real-time insights to improve pharmacy operations.
- Regulatory Compliance: Track audit pass rates and controlled substances accurately.
- Enhanced Patient Satisfaction: Monitor and improve patient experience with pharmacy services.
KPIs to Track in Multi-Specialty Hospital Pharmacy Dashboards
These are the most impactful KPIs to monitor for maintaining safety, efficiency, and compliance:
- Medication Error Rate Percent – Measure overall errors in dispensing and administration.
- Adverse Drug Event (ADE) Rate per 1,000 Orders – Track clinical safety incidents.
- Dose-Omission Rate Percent – Identify missed doses to prevent patient risk.
- On-Time Medication Delivery Percent – Evaluate timeliness of drug administration.
- Patient Satisfaction with Pharmacy Services Percent – Monitor quality of service.
- Audit Pass Rate (Controlled Substances) Percent – Ensure compliance with regulations.
- Inventory Turnover Ratio – Measure stock usage efficiency.
Frequently Asked Questions
Q1: Why is a Multi-Specialty Hospital Pharmacy Dashboard important?
It centralizes pharmacy data, reduces errors, optimizes inventory, and improves patient safety.
Q2: What types of visualizations are used in these dashboards?
Common visualizations include stacked column charts, line charts, donut charts, heatmaps, waterfall charts, and funnel charts.
Q3: Which KPIs are essential for hospital pharmacy monitoring?
Medication error rate, ADE rate, inventory turnover, days on hand, and on-time delivery are key indicators.
Q4: Can this dashboard help in regulatory compliance?
Yes. Tracking audit pass rates and controlled substance management ensures compliance with hospital regulations.
Q5: Who uses a hospital pharmacy dashboard?
Pharmacy managers, clinical pharmacists, hospital administrators, and quality assurance teams use it for decision-making.