
What is a Medication & Health Monitoring Dashboard?
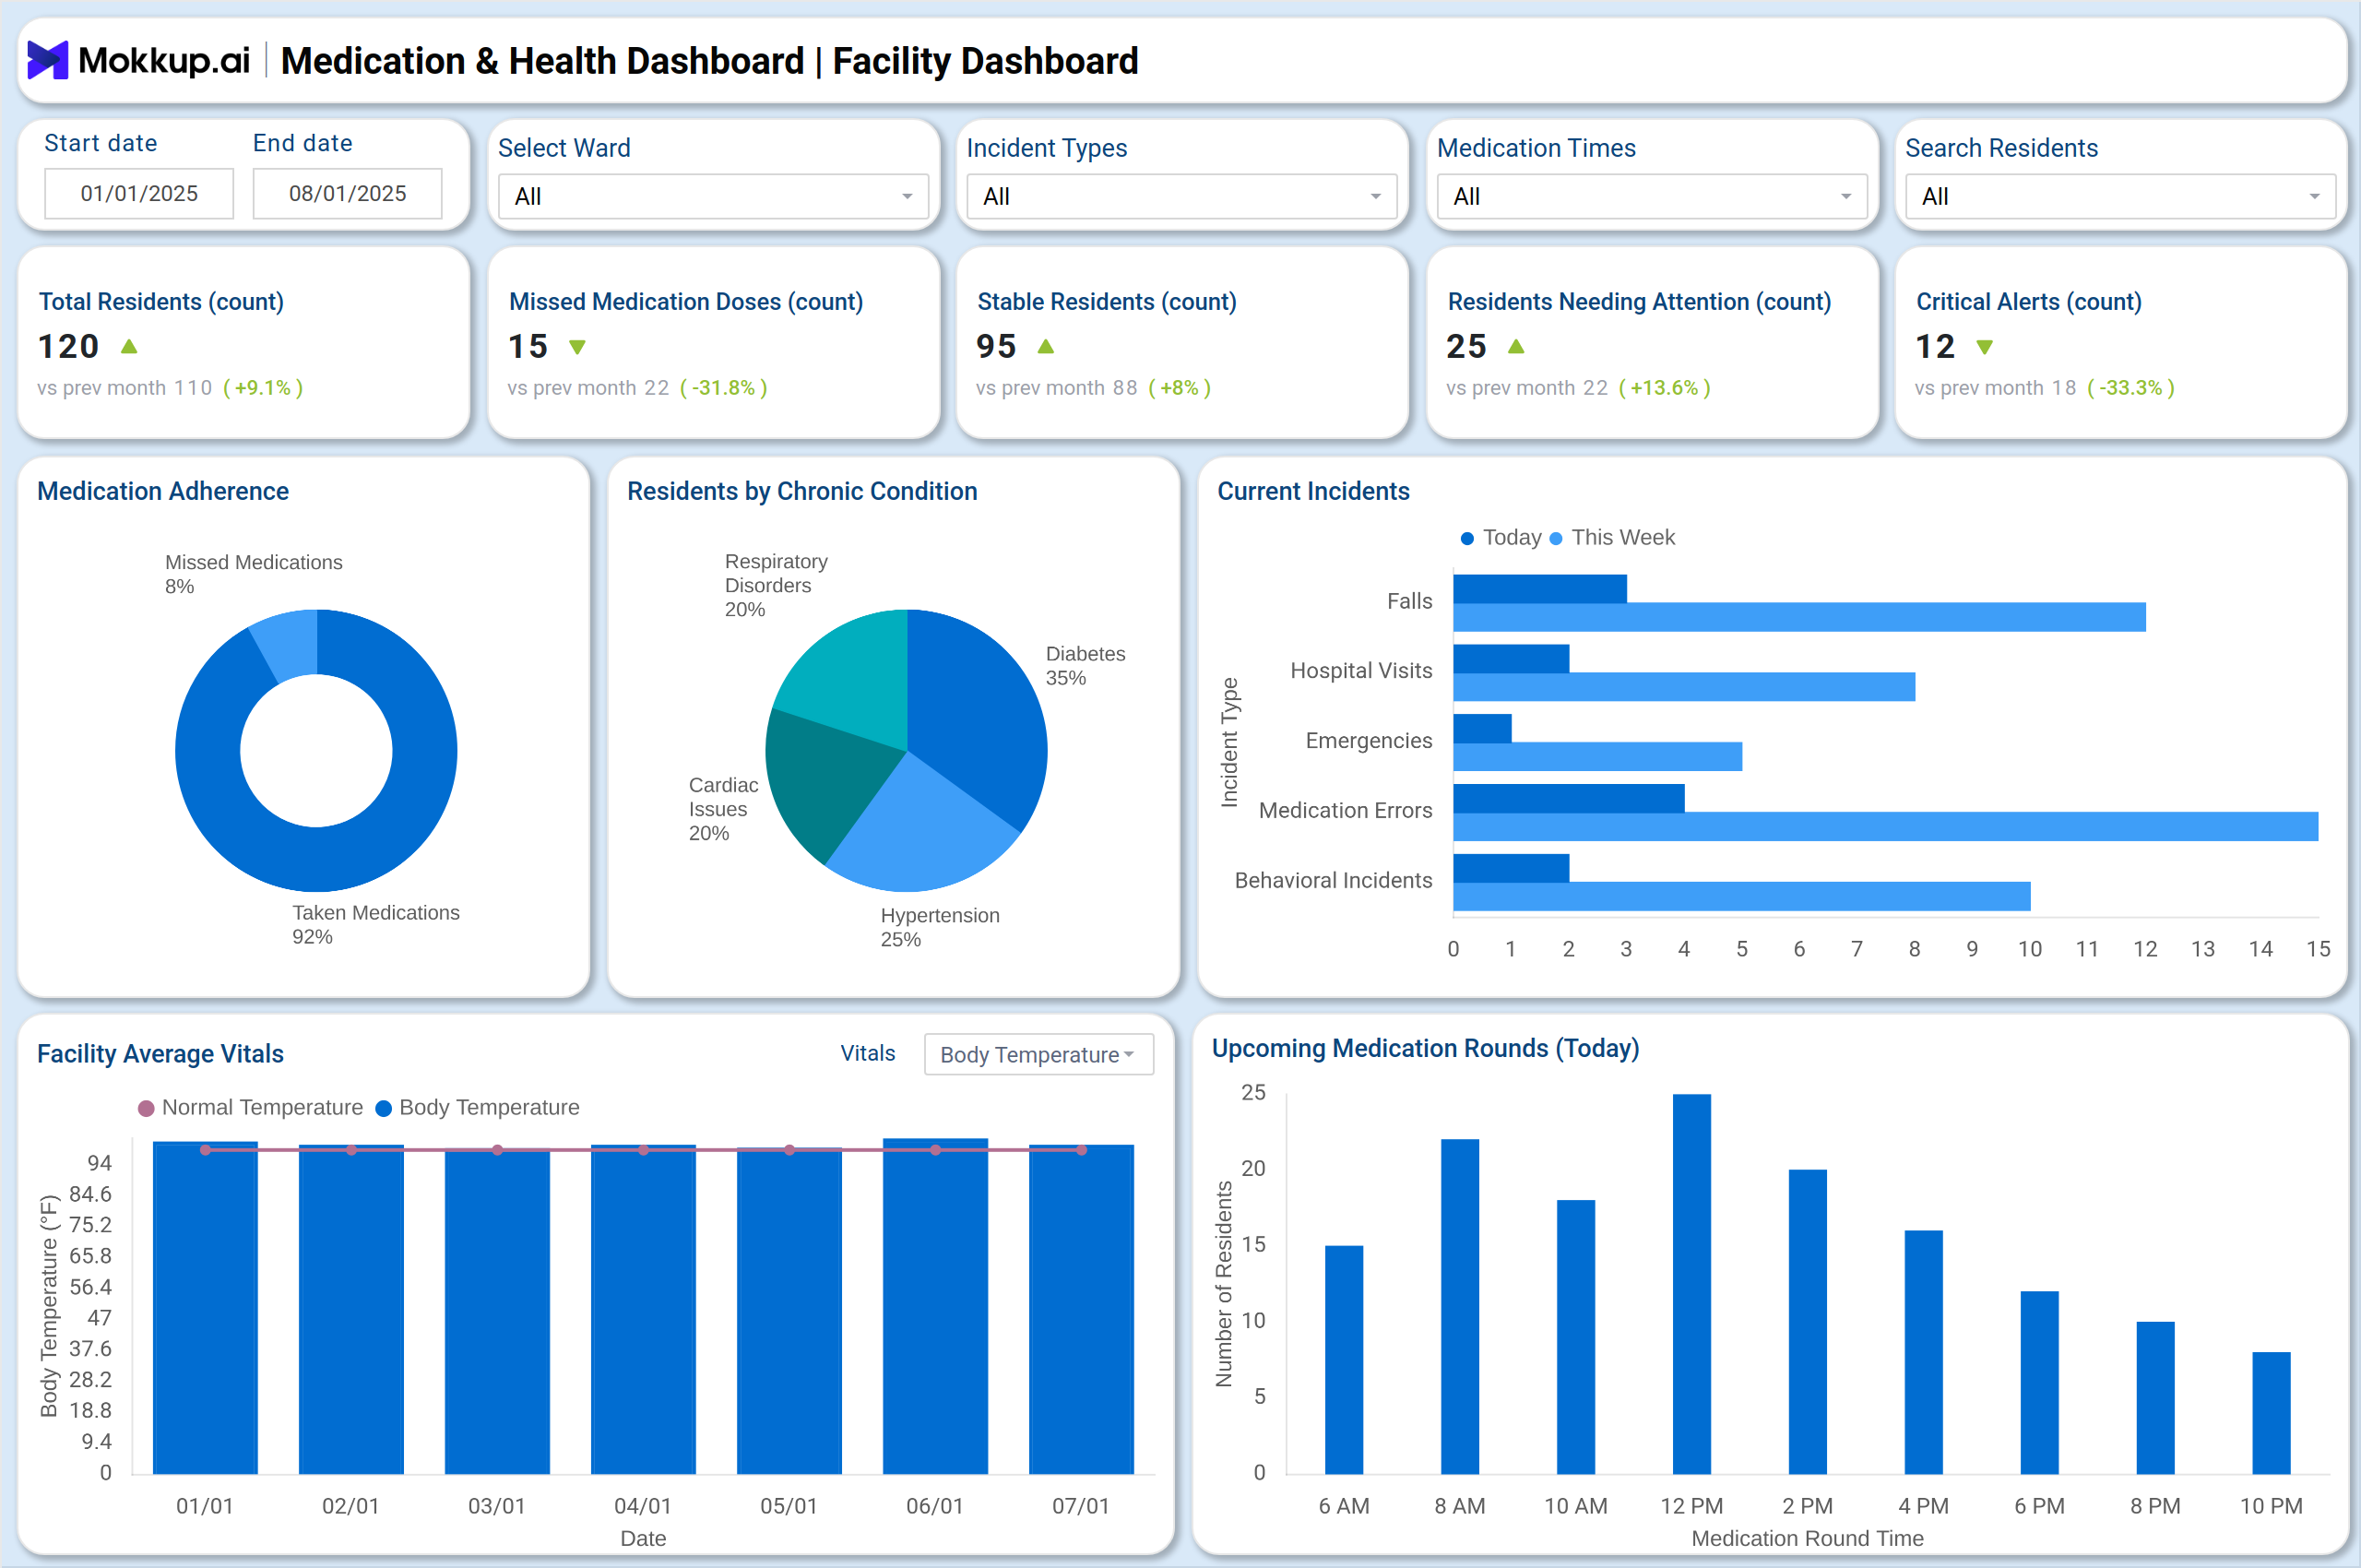
A Medication & Health Monitoring Dashboard is a centralized tool that helps healthcare providers track patient health, medication adherence, and critical incidents in real time. Instead of relying on manual records or static reports, it provides data visualization for patient health, making it easier to spot patterns and take timely action. These dashboards bring together medication schedules, chronic condition tracking, vitals, and incidents in one view for quick insights. Similar to a remote healthcare monitoring dashboard, they enable informed decisions, reduce errors, and improve patient safety.
How to Create a Medication & Health Monitoring Dashboard
You don’t need to build your report from scratch—just start with a ready-to-use Health Monitoring dashboard template from Mokkup. Add in your data and export it however you like. Here’s how to do it:
1. Create or Log in to Your Mokkup Account
Start by signing up on Mokkup.ai using your email. If you already have an account, just log in, and you’ll be good to go.
2. Choose and Customize Your Dashboard Template
Find the Medication & Health Monitoring Dashboard template in the Templates section. Use the drag-and-drop editor to adjust KPIs, edit filters, or add elements based on your data.
3. Export to Your BI Tool
Once your dashboard wireframe is ready, use the BI Tool Export feature to send it directly to Power BI or Tableau for further analysis and enhancements. You can also download the dashboard as a PDF, PNG, or JPEG, embed it on a platform, or invite your team to collaborate.
Note: This is a Pro template. You’ll need a Pro subscription on Mokkup to use and customize this dashboard wireframe. Upgrade anytime to unlock full access.
Medication & Health Monitoring Dashboard Example
Create your personalized Medication & Health Dashboard, bringing all of your metrics into one structured view. The Mokkup Medical and Health Monitoring Dashboard wireframe includes visualizations such as % of doses administered on time, missed/late doses, vitals logged per resident and more. Filters for date, region, energy source, and grid allow users to tailor analysis to specific needs. Once the data is added, this dashboard can be exported to BI tools like Power BI or Tableau for deeper analysis, making it a practical solution for tracking health and wellness of patients.
How to Analyze Data in Medication & Health Monitoring Dashboards
To effectively use the Energy Distribution Dashboard, follow these steps:
- Monitor medication adherence rates to track missed doses.
- Review chronic condition distribution (diabetes, hypertension, cardiac issues) to allocate resources.
- Track incidents and alerts such as falls, hospital visits, or medication errors.
- Compare vital sign trends (blood pressure, sugar, temperature) to normal ranges.
- Analyze staff task completion rates to ensure smooth operations.
- Monitor medication stock levels to avoid shortages.
- Use resident-level profiles for early detection of health risks.
By analyzing data this way, healthcare providers can improve medication adherence, track patient health more effectively, and support better health outcomes
Benefits of Medication & Health Monitoring Dashboards
A Medication & Health Monitoring Dashboard provides several advantages for healthcare providers:
- Centralized Data: Access all patient health and medication information in one place.
- Real-Time Tracking: Monitor vitals and medication schedules to reduce risks.
- Better Compliance: Get alerts for missed doses or overdue tasks.
- Early Detection: Spot health deterioration quickly through incident and trend tracking.
- Improved Efficiency: Manage staff tasks, workloads, and reporting in one dashboard.
- Enhanced Engagement: Help patients stay on track with clear adherence and health profiles.
Overall, this dashboard simplifies health monitoring and helps caregivers deliver more consistent, personalized, and effective care.
KPIs to Track in Medication & Health Monitoring Dashboards
The best health monitoring dashboard tracks key KPIs including:
- Missed Medication Doses: Number of unadministered doses over time.
- Medication Adherence (%): Percentage of doses taken vs prescribed.
- Critical Alerts: High-priority events like emergencies or hospital transfers.
- Resident Stability Count: Number of patients in stable condition.
- Incident Frequency: Types and counts of incidents such as falls or errors.
- Chronic Condition Distribution: Patient breakdown by long-term conditions.
- Vital Trends: Blood pressure, heart rate, sugar, and temperature averages.
- Staff Task Completion Rate: Percentage of tasks finished on time.
- Medication Stock Levels: Units available for critical drugs.
- Upcoming Appointments: Scheduled visits to specialists.
By tracking these metrics, healthcare providers can reduce risks, improve patient outcomes, and deliver more efficient care.
Frequently Asked Questions
1. Why is a Medication & Health Monitoring Dashboard important?
A Medication & Health Monitoring Dashboard is important because it centralizes patient data, tracks vitals and medication adherence in real time, and reduces the risk of errors. It helps healthcare providers make faster decisions, detect early health deterioration, and deliver more consistent, personalized care.
2. What KPIs should be included in a Medication & Health Monitoring Dashboard?
The most important KPIs include Missed Medication Doses, Medication Adherence (%), Critical Alerts, Resident Stability Count, Incident Frequency, Chronic Condition Distribution, Vital Trends, Staff Task Completion Rate, and Medication Stock Levels. These metrics give a complete view of patient safety, compliance, and overall care quality.
3. Can this dashboard support remote healthcare?
Yes. The dashboard is designed to work as a remote healthcare monitoring and reporting tool. It integrates medication schedules, vitals, and incident tracking, making it valuable for telemedicine, elderly care facilities, and home health monitoring.