
What is a LNG Workforce Readiness & Certification Dashboard?
An LNG Workforce Readiness & Certification Dashboard is a specialized visual tool designed to monitor, analyze, and report on the training, certification, and operational readiness of personnel within the liquefied natural gas (LNG) industry. It consolidates critical metrics such as certification rates, training hours, shift coverage, attrition, and certification expiry risks into a single, interactive interface.
By integrating LNG operator certification tracking, workforce readiness analytics, and training compliance monitoring, this dashboard enables facility managers, HR teams, and operational leads to ensure a qualified, compliant, and efficient workforce. It supports proactive management of training programs, reduces certification lapses, and enhances overall plant safety and productivity.
How to Create a LNG Workforce Readiness & Certification Dashboard
You don’t need to build your report from scratch—just start with a ready-to-use LNG Workforce Readiness & Certification dashboard template from Mokkup. Add in your data and export it however you like. Here’s how to do it:
1. Create or Log in to Your Mokkup Account
Start by signing up on Mokkup.ai using your email. If you already have an account, just log in, and you’ll be good to go.
2. Choose and Customize Your Dashboard Template
Find the LNG Workforce Readiness & Certification Dashboard template in the Templates section. Use the drag-and-drop editor to adjust KPIs, edit filters, or add elements based on your data.
3. Export to Your BI Tool
Once your dashboard wireframe is ready, use the BI Tool Export feature to send it directly to Power BI or Tableau for further analysis and enhancements. You can also download the dashboard as a PDF, PNG, or JPEG, embed it on a platform, or invite your team to collaborate.
Note: This is a Pro template. You’ll need a Pro subscription on Mokkup to use and customize this dashboard wireframe. Upgrade anytime to unlock full access.
LNG Workforce Readiness & Certification Dashboard Example
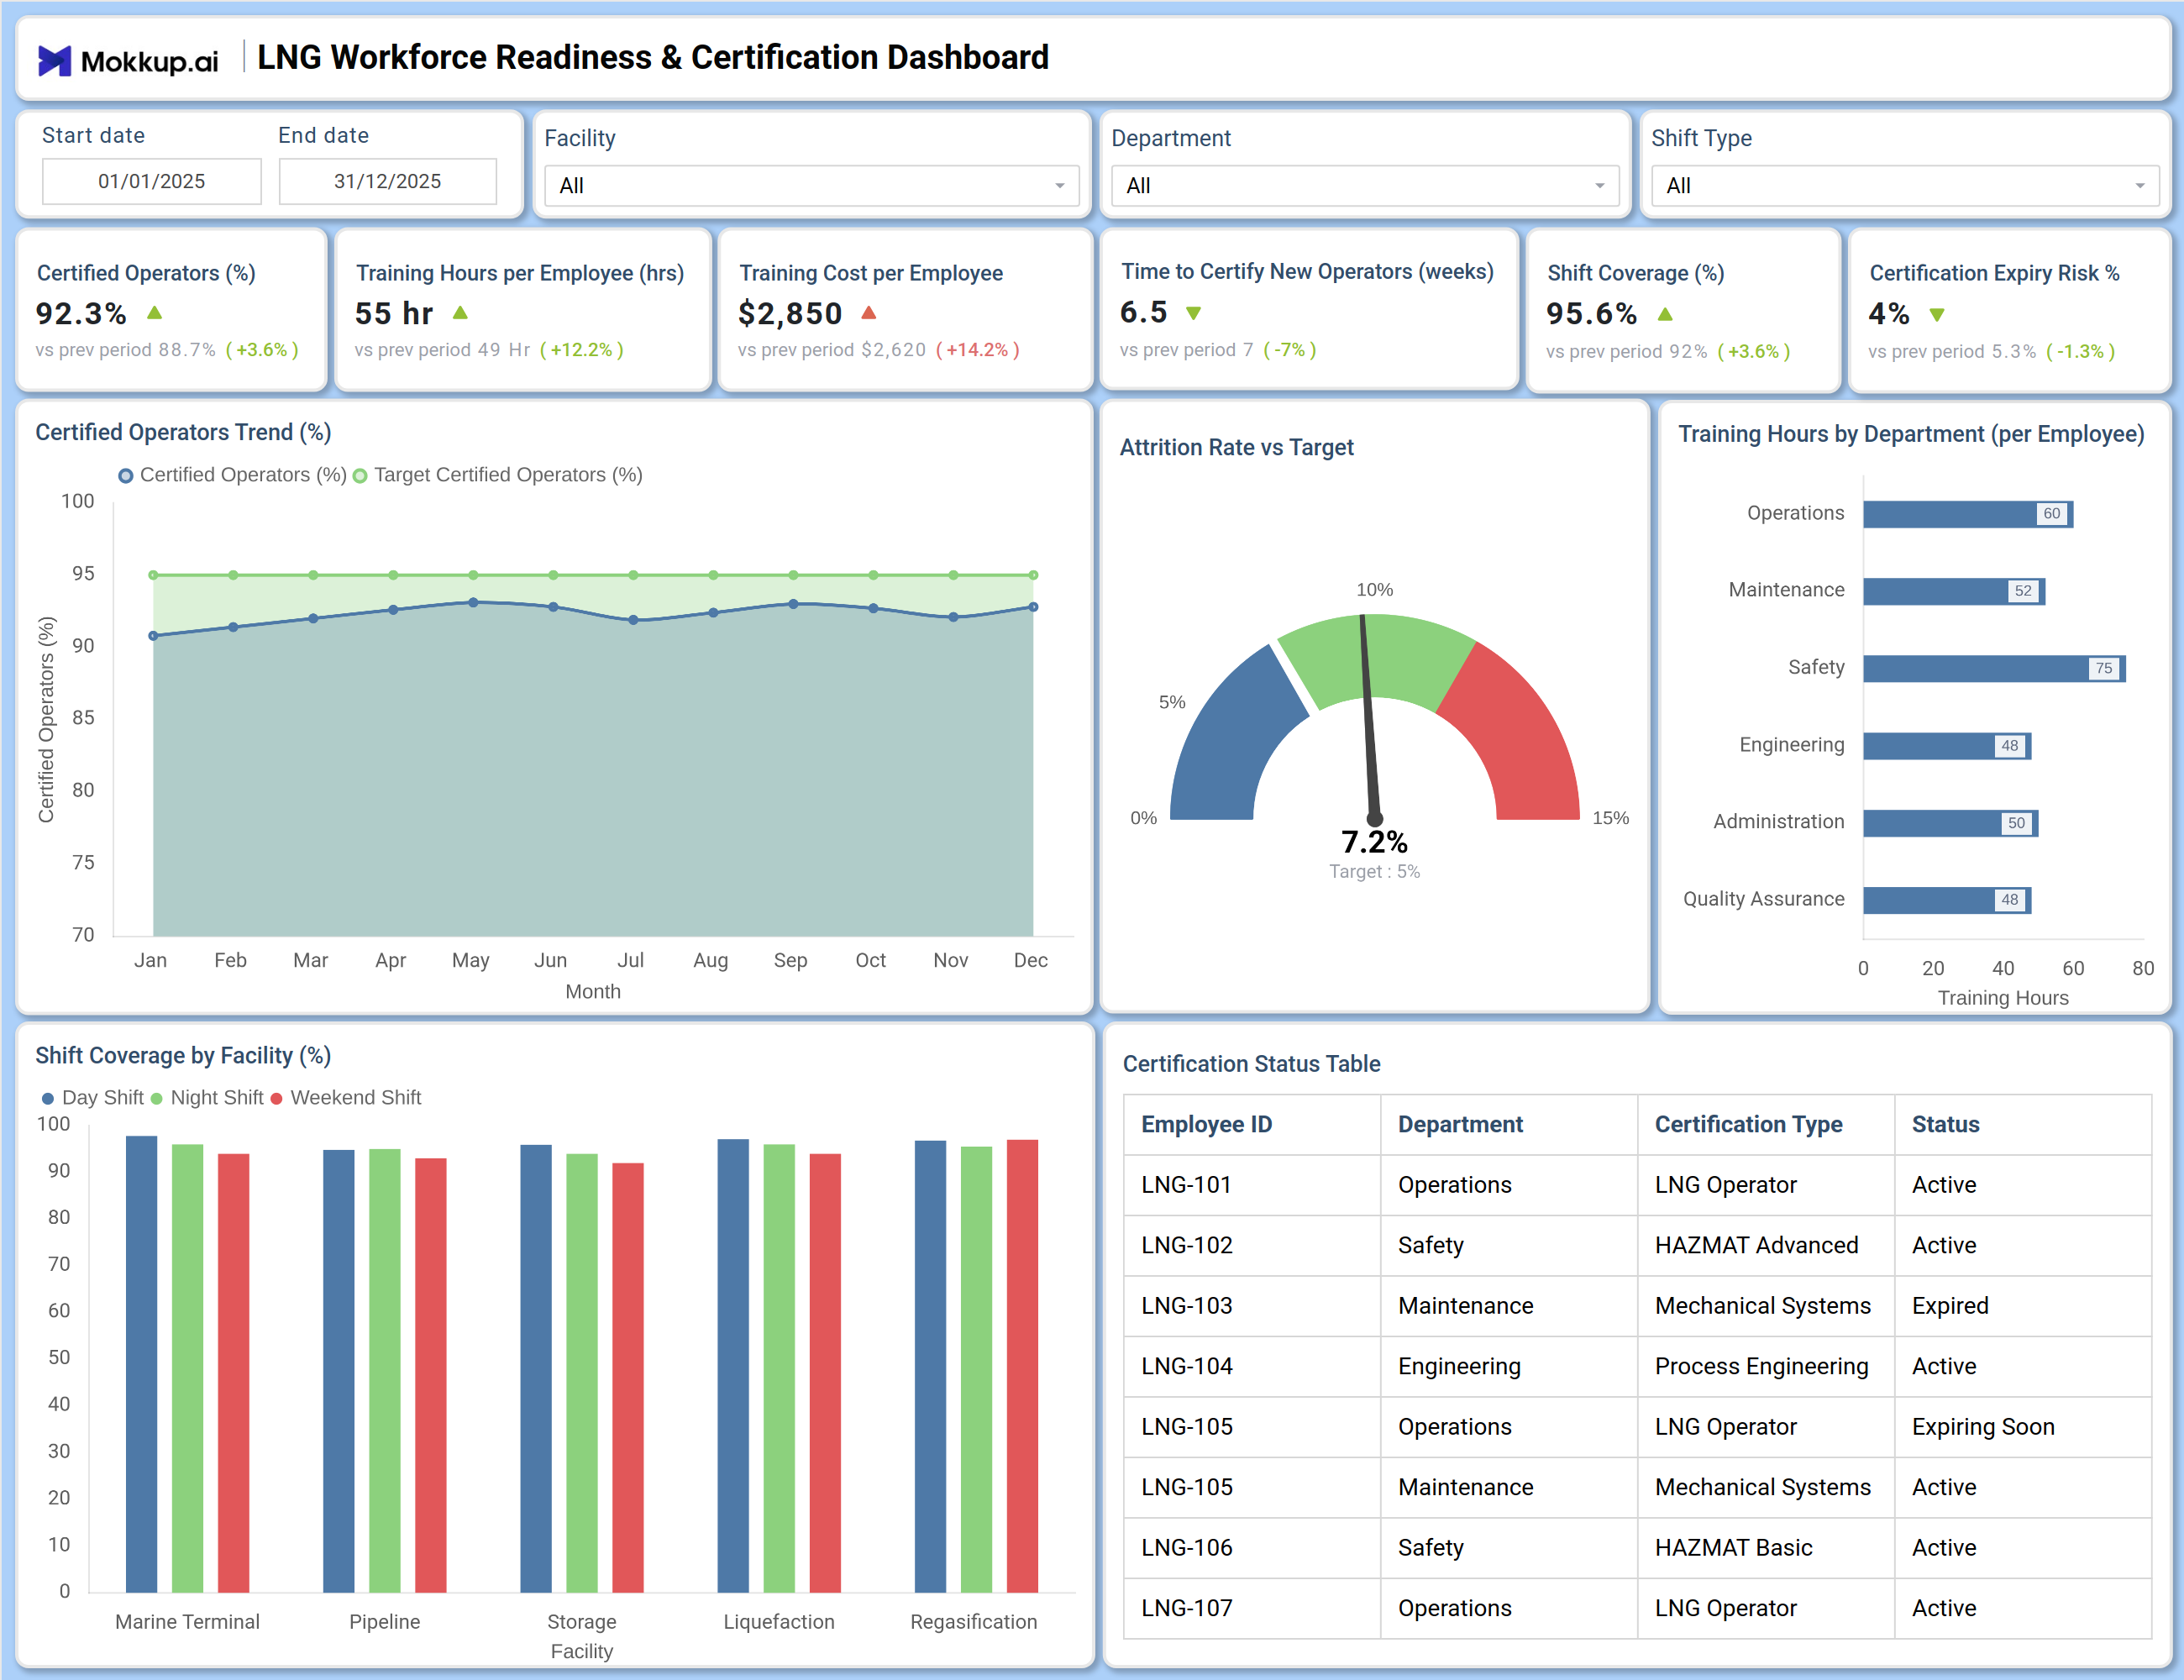
This dashboard provides a comprehensive view of workforce certification and readiness across LNG facilities. The Overview screen displays high-level KPIs such as Certified Operators (92.3%), Training Hours per Employee (55 hrs), and Shift Coverage (95.6%). Visual trends show certification rates by shift type over time, while department-specific training hours highlight areas of focus. The Attrition Rate vs. Target chart (7.2% vs. 5% target) and Certification Expiry Risk (4%) allow for proactive workforce planning. A detailed Certification Status Table lists employee certifications by department and status, enabling quick compliance checks. This centralized view supports LNG operator certification tracking, workforce readiness planning, and training efficiency analysis.
How to Analyze Data in a LNG Workforce Readiness & Certification Dashboard
Here is how you can analyze data from this dashboard:
- Monitor Certified Operators (%): Ensure compliance with operational and safety standards.
- Track Training Hours per Employee: Evaluate the effectiveness and investment in workforce development.
- Analyze Shift Coverage (%): Identify staffing gaps and optimize shift planning across facilities.
- Review Certification Expiry Risk (%): Proactively schedule recertification and avoid lapses.
- Compare Attrition Rate vs. Target: Assess employee retention and address turnover drivers.
- Examine Training Hours by Department: Allocate resources where skill development is most needed.
- Certification Status Table: Verify individual and team certification compliance in real time.
Benefits of a LNG Workforce Readiness & Certification Dashboard
The following are the benefits of using this dashboard:
- Centralized Workforce Visibility: Provides a single view of certification status, training completion, and workforce readiness metrics.
- Certification Compliance Tracking: Enhances LNG operator certification monitoring across shifts and facilities.
- Proactive Workforce Planning: Identifies certification gaps and training needs early for better planning.
- Reduced Operational Risk: Monitors certification expiry dates to ensure timely renewals and compliance.
- Data Driven Training Decisions: Supports informed planning for training budgets, staffing, and resource allocation.
- Audit & Regulatory Transparency: Improves visibility for safety inspections, audits, and regulatory reporting.
- Improved Productivity & Safety: Strengthens workforce performance through continuous readiness monitoring.
KPIs to Track in a LNG Workforce Readiness & Certification Dashboard
The following key KPIs can be tracked by using this dashboard:
- Certified Operators (%): Percentage of operators holding valid, role-specific certifications.
- Training Hours per Employee: Average hours of training completed per employee.
- Training Cost per Employee: Average expenditure on training per employee.
- Time to Certify New Operators (weeks): Average duration to onboard and certify new hires.
- Shift Coverage (%): Percentage of scheduled shifts filled by certified personnel.
- Certification Expiry Risk (%): Percentage of certifications nearing expiration.
- Attrition Rate (%): Employee turnover rate compared to organizational targets.
- Departmental Training Hours: Breakdown of training hours by department (Operations, Safety, Maintenance, etc.).
Frequently Asked Questions
Q1. What is the purpose of an LNG Workforce Readiness Dashboard?
It helps track employee certifications, training progress, shift coverage, and compliance to ensure a qualified and ready workforce for safe LNG operations.
Q2. Can this dashboard help reduce certification lapses?
Yes. By monitoring Certification Expiry Risk (%) and certification status in real time, managers can schedule renewals proactively and avoid compliance gaps.
Q3. How does the dashboard support training management?
It displays training hours, costs, and departmental breakdowns, enabling better planning, budgeting, and effectiveness evaluation of training programs.
Q4. Who typically uses this dashboard?
LNG plant managers, HR and training coordinators, safety officers, and operational supervisors use it to monitor workforce readiness and compliance.
Q5. Can the dashboard be customized for different facilities or departments?
Yes. Using filters for Facility, Department, and Shift Type, users can drill down into specific areas for targeted analysis.