
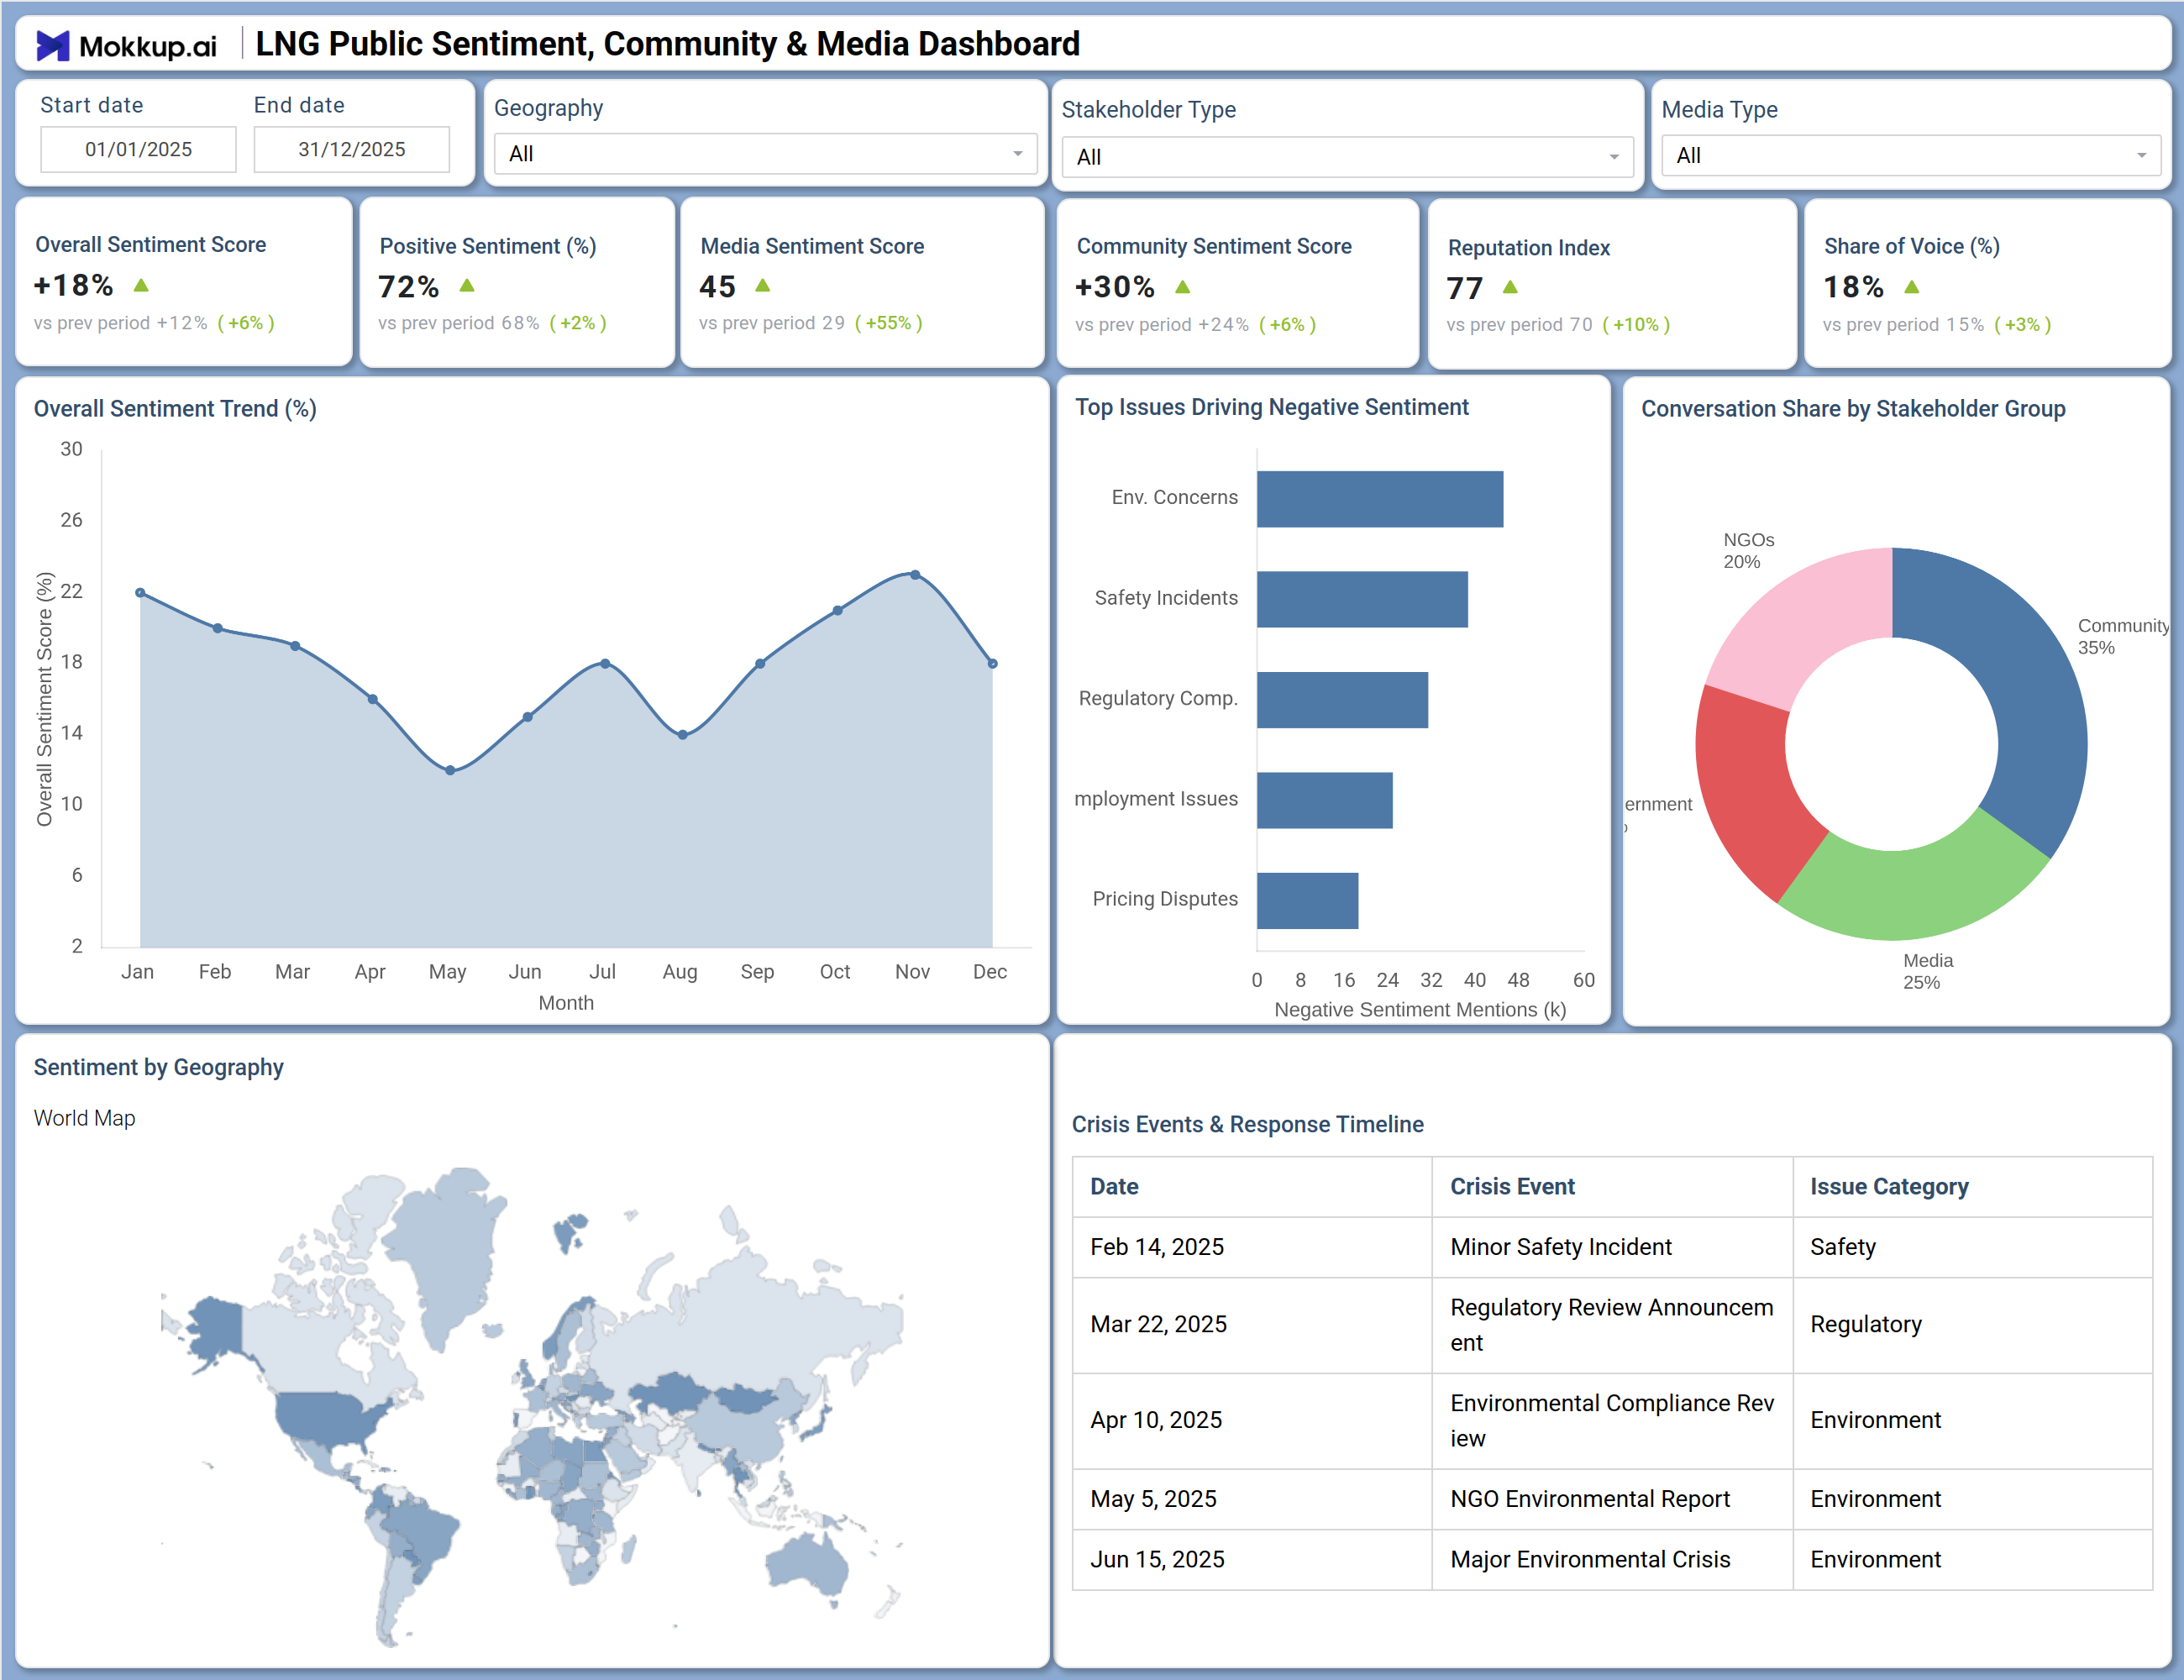
What is an LNG Public Sentiment, Community & Media Dashboard?
An LNG public sentiment monitoring dashboard gives communications teams, ESG managers, and government relations professionals a unified view of how LNG projects are perceived across media channels, communities, and stakeholder groups. This tool tracks key indicators, including Overall Sentiment Score, Positive Sentiment, Media Sentiment Score, Community Sentiment Score, Reputation Index, and Share of Voice, giving teams the data they need to respond proactively to public concern. LNG stakeholder engagement analytics are central to the dashboard's design, enabling organizations to segment perception by geography, stakeholder type, and media type. By consolidating crisis event timelines, negative issue drivers, and conversation share data in one place, this dashboard helps LNG operators protect and strengthen their social license to operate.
How to Create an LNG Public Sentiment, Community & Media Dashboard
You don't need to build your report from scratch, just start with a ready-to-use dashboard template from Mokkup. Add in your data and export it however you like. Here's how to do it:
1. Create or Log in to Your Mokkup Account
Start by signing up on Mokkup.ai using your email. If you already have an account, just log in, and you'll be good to go.
2. Choose and Customize Your Dashboard Template
Find the LNG Public Sentiment, Community & Media Dashboard template in the Templates section. Use the drag-and-drop editor to adjust KPIs, edit filters, or add elements based on your data.
3. Export to Your BI Tool
Once your dashboard wireframe is ready, use the BI Tool Export feature to send it directly to Power BI or Tableau for further analysis and enhancements. You can also download the dashboard as a PDF, PNG, or JPEG, embed it on a platform, or invite your team to collaborate.
Note: This is a Pro template. You'll need a Pro subscription on Mokkup to use and customize this dashboard wireframe. Upgrade anytime to unlock full access.
LNG Public Sentiment, Community & Media Dashboard Example
Community relations managers and communications teams at LNG companies use this dashboard to stay ahead of public perception shifts before they develop into reputational crises. By reviewing the overall perception indicators, teams can assess whether sentiment across their key audience groups — communities, media, NGOs, investors, and government — is trending in the right direction and which stakeholder segment is driving the most conversation volume. When signs of deterioration appear, teams can use the date range, Geography, and Stakeholder Type filters to isolate whether an issue is confined to a specific region or broader in scope, enabling faster and more targeted response planning. The community sentiment tracking component for LNG projects becomes especially valuable when organizations face clusters of environmental or safety-related complaints.
Managers can examine which categories — such as environmental concerns, safety incidents, or regulatory compliance questions — are contributing the most negative mentions and direct communications resources accordingly. The Crisis Events & Response Timeline gives leadership a structured record of past incidents and their measured impact on public perception, helping teams understand how quickly sentiment recovered and informing decisions about escalation and communication strategy for similar future events. For media strategy teams, the Conversation Share by Stakeholder Group chart clarifies how much of the public narrative each audience controls, while the Sentiment by Geography map highlights where concerns are most geographically concentrated. This combination of views helps teams decide where to invest in proactive community engagement versus reactive media response, ultimately reducing the time between a public incident and a coordinated, evidence-based reply.
How to Analyze Data in an LNG Public Sentiment, Community & Media Dashboard
Here is how you can analyze data from this dashboard:
- Use the Geography filter to isolate sentiment performance for specific regions and identify where community opposition or media criticism is strongest.
- Monitor the Overall Sentiment Trend (%) line chart to detect declining public perception patterns across months before they develop into broader reputational crises.
- Review the Top Issues Driving Negative Sentiment bar chart to conduct targeted media sentiment analysis energy sector teams need for prioritizing communication responses across environmental, safety, and regulatory categories.
- Analyze the Conversation Share by Stakeholder Group donut chart to understand which audience segment — Community, Media, NGOs, Investors, or Government — is shaping the most public narrative.
- Compare the Sentiment by Geography world map to find regions with the lowest sentiment intensity and the highest concentration of negative coverage requiring localized outreach.
- Use the Crisis Events & Response Timeline table to correlate past incidents with sentiment score drops and measure the duration of reputational recovery after each event.
- Filter by Stakeholder Type to align messaging strategies with specific audience groups such as NGOs, investors, or government stakeholders.
- Track the Reputation Index over time to measure progress in LNG reputation index management and assess the long-term effectiveness of community outreach and crisis communication programs.
Benefits of an LNG Public Sentiment, Community & Media Dashboard
The following are the benefits of using this dashboard:
- Centralizes Overall Sentiment Score, Media Sentiment Score, Community Sentiment Score, Reputation Index, and Share of Voice across LNG operations in one structured template.
- Supports community sentiment tracking LNG projects monitoring across five stakeholder dimensions — Community, Media, Government, NGOs, and Investors — simultaneously.
- Reduces manual data compilation for public affairs and ESG reporting with pre-built KPI tiles and chart layouts covering trend, issue, geography, and crisis views.
- Enables region-level analysis of LNG reputation index management to guide targeted community engagement and crisis communication investment decisions.
- Provides a horizontal bar chart breakdown of the top negative sentiment drivers for structured response planning and media strategy prioritization.
- Helps communications teams and ESG managers align stakeholder reporting with organizational transparency goals without rebuilding sentiment dashboards from scratch.
- Gives corporate affairs teams and community relations managers a shared view of public perception performance across all channels and geographies.
KPIs to Track in an LNG Public Sentiment, Community & Media Dashboard
The following key KPIs can be tracked by using this dashboard:
- Overall Sentiment Score (%): Central to any LNG public sentiment monitoring dashboard — measures net public perception across all channels and stakeholder types, signaling whether opinion is improving or deteriorating versus the prior period.
- Positive Sentiment (%): Tracks the proportion of all public mentions that carry a favorable tone — a key indicator of community goodwill and the overall effectiveness of communications outreach.
- Media Sentiment Score: Quantifies how media coverage is trending across the reporting period — essential for media sentiment analysis energy sector teams use to evaluate campaign and crisis communication performance.
- Community Sentiment Score: Measures local community perception levels — key to LNG reputation index management and understanding social license status in project-adjacent areas.
- Reputation Index: Evaluates overall brand standing against prior period benchmarks, tracking how the negative sentiment drivers LNG operations face from environmental, safety, and regulatory issues are affecting long-term organizational trust.
- Share of Voice (%): Tracks the organization's presence in public discourse across Media, Community, Government, NGO, and Investor stakeholder dimensions, showing whether the organization is controlling or ceding its share of the narrative.
Frequently Asked Questions
1. What teams use an LNG Public Sentiment, Community & Media Dashboard?
Communications and public affairs teams, ESG and sustainability managers, community relations officers, and government relations professionals at LNG companies rely on this dashboard to monitor public perception, track stakeholder sentiment, and manage reputational risk proactively.
2. How does this dashboard improve crisis communication in LNG operations?
The Crisis Events & Response Timeline table logs each incident by date, issue category, and measured sentiment impact, giving teams a structured record of how past events affected public perception. Combined with the Overall Sentiment Trend (%) chart, teams can pinpoint exactly when sentiment declined and assess how quickly it recovered after their response, building a data-driven playbook for future crises.
3. Can this dashboard track sentiment by geography and stakeholder type?
Yes. The Sentiment by Geography world map visualizes regional sentiment intensity, while the Geography, Stakeholder Type, and Media Type filters allow teams to drill into specific audiences and markets. This makes it straightforward to isolate whether a concern is localized to one region or reflects a broader shift in public opinion.
4. How does the Conversation Share by Stakeholder Group chart work?
This donut chart breaks down total public conversation volume across five stakeholder groups — Community, Media, Government, NGOs, and Investors. It shows which group is driving the largest share of public narrative during the selected period, helping teams prioritize outreach and response efforts toward the most influential and active audience segments.
5. What does the Reputation Index measure?
The Reputation Index is a composite score that evaluates the organization's overall standing in public perception compared to the prior reporting period. Monitoring this KPI helps teams understand whether their response to negative sentiment drivers LNG operations face — such as environmental compliance reviews or safety incidents — is translating into measurable reputational recovery over time.