What is a Kidney Stone & Lithotripsy Specialty Care Dashboard?
A Kidney Stone & Lithotripsy Specialty Care Dashboard is a specialized digital tool designed for urology centers to monitor and analyze kidney stone treatments and lithotripsy procedures. It provides visibility into procedural success rates, complication trends, patient outcomes, and operational efficiency. This dashboard helps urologists, clinical directors, and operations managers identify patterns in treatment effectiveness, track patient flow, and optimize workflow across departments. By integrating data from multiple sources, healthcare teams can make evidence-based decisions, reduce complications, and enhance patient satisfaction. Essentially, it serves as a performance dashboard for kidney stone treatment and a monitoring dashboard for lithotripsy procedures, consolidating clinical and operational insights in a single view.
How to Create a Kidney Stone & Lithotripsy Specialty Care Dashboard
You don’t need to build your report from scratch—just start with a ready-to-use dashboard template from Mokkup. Add in your data and export it however you like. Here’s how to do it:
1. Create or Log in to Your Mokkup Account
Start by signing up on Mokkup.ai using your email. If you already have an account, just log in, and you’ll be good to go.
2. Choose and Customize Your Dashboard Template
Find the Kidney Stone & Lithotripsy Specialty Care Dashboard template in the Templates section. Use the drag-and-drop editor to adjust KPIs, edit filters, or add elements based on your data.
3. Export to Your BI Tool
Once your dashboard wireframe is ready, use the BI Tool Export feature to send it directly to Power BI or Tableau for further analysis and enhancements. You can also download the dashboard as a PDF, PNG, or JPEG, embed it on a platform, or invite your team to collaborate.
Note: This is a Pro template. You’ll need a Pro subscription on Mokkup to use and customize this dashboard wireframe. Upgrade anytime to unlock full access.
Kidney Stone & Lithotripsy Specialty Care Dashboard Example
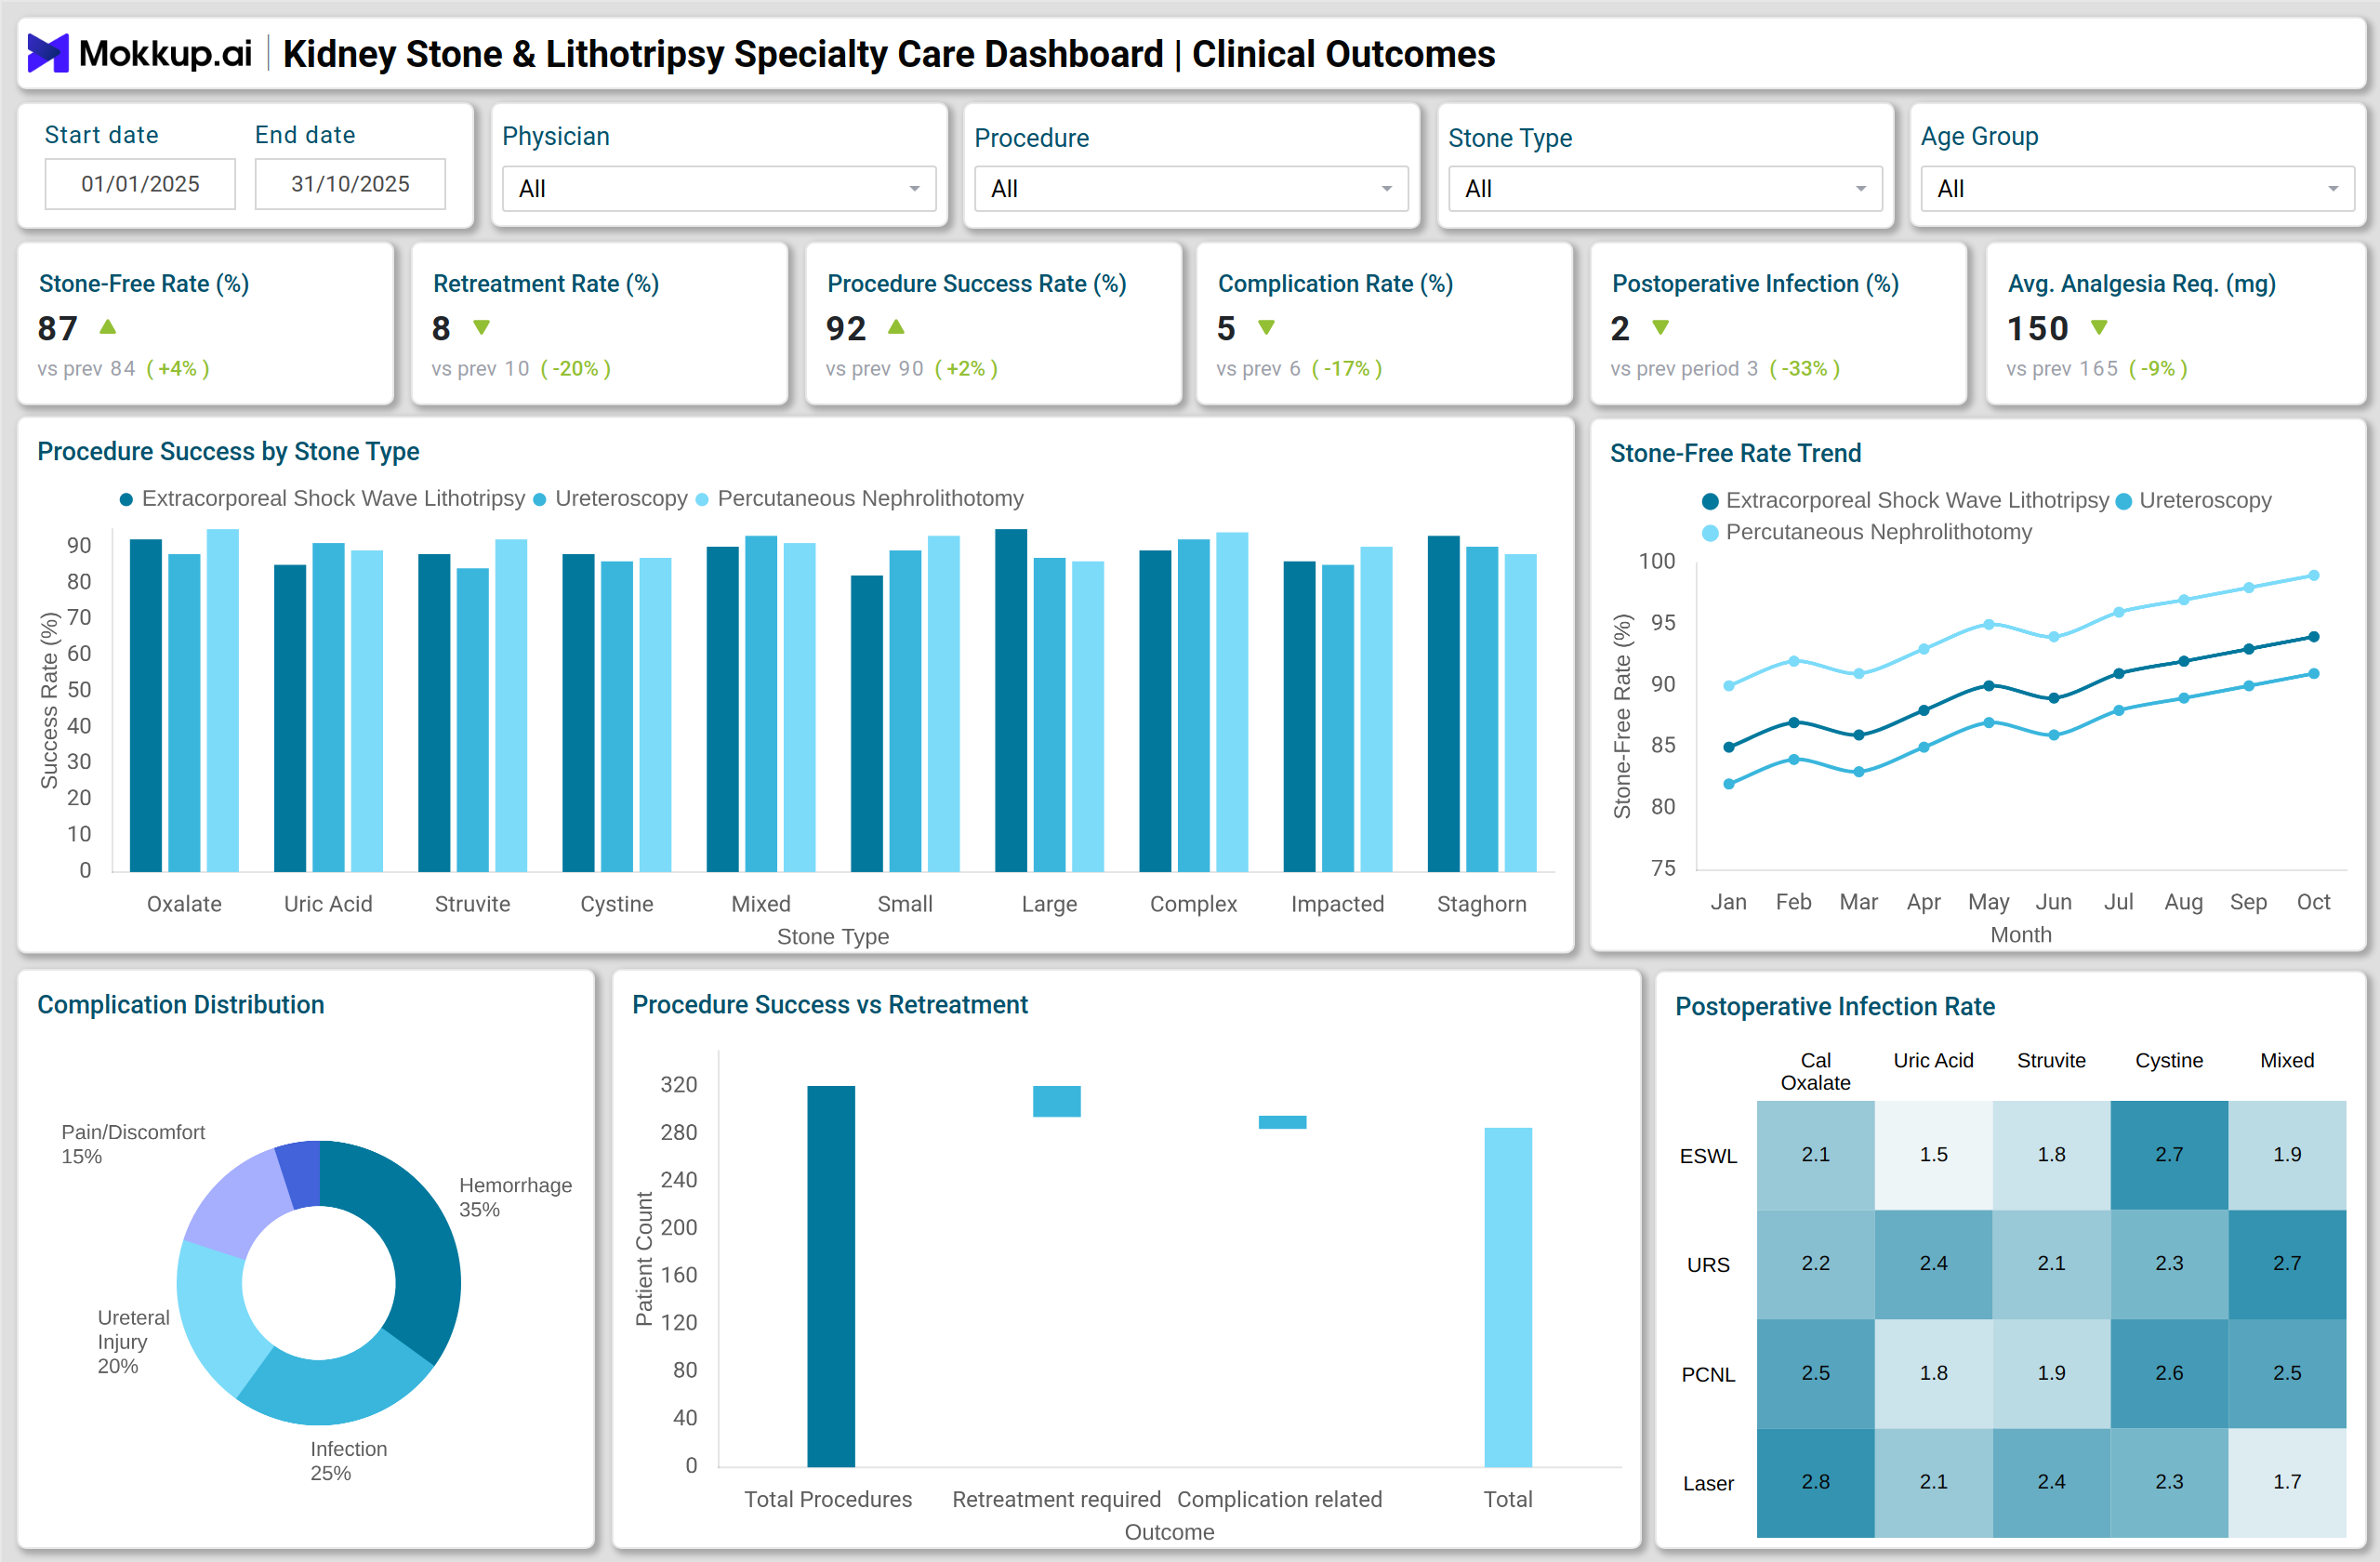
The dashboard offers multiple visualizations to simplify complex data. For example, a stacked column chart illustrates the success of procedures by stone type, enabling the identification of which stones respond best to specific treatments. A line chart tracks the trends in stone-free rates over time across different procedure types, highlighting patterns of effectiveness. A pie chart displays the distribution of complications to pinpoint the most common issues. Waterfall charts quantify the impact of retreatments on overall success, while heatmaps identify high-risk procedure-stone combinations associated with infections. Additional visuals include bar charts by doctor, gauge charts for patient wait times, pie charts for bed occupancy, funnel charts for patient flow, and combo charts correlating readmission rates with patient satisfaction. Together, these insights make the dashboard a comprehensive clinical performance dashboard for a urology center and a patient outcomes dashboard for kidney stone care.
How to Analyze Data in Kidney Stone & Lithotripsy Specialty Care Dashboards
Here is how you can analyze data in the Kidney Stone & Lithotripsy Specialty Care Dashboard:
- Compare procedure success rates by stone type using stacked column charts.
- Track stone-free rate trends monthly to monitor treatment effectiveness.
- Analyze complication types and distribution to implement preventive strategies.
- Use waterfall charts to evaluate the impact of retreatment cases on net successful outcomes.
- Identify high-risk procedure-stone combinations using heatmaps of infection rates.
- Monitor doctor-wise procedural volumes to manage workloads efficiently.
- Evaluate patient wait times with gauge charts to optimize scheduling.
- Assess bed occupancy rates across wards to prevent bottlenecks.
- Visualize patient flow from consultation to procedure using funnel charts to reduce drop-offs.
- Correlate readmission rates with patient satisfaction to improve clinical outcomes.
Benefits of Kidney Stone & Lithotripsy Specialty Care Dashboards
These are the benefits of using the Kidney Stone & Lithotripsy Specialty Care Dashboard:
- Provides monitoring of kidney stone treatments and lithotripsy procedures.
- Improves clinical decision-making by highlighting trends and patterns.
- Reduces procedure complications through predictive insights.
- Enhances patient experience by tracking wait times and satisfaction scores.
- Optimizes hospital operations with insights into bed occupancy and doctor workloads.
- Facilitates data-driven reporting for urology departments.
- Supports continuous improvement in treatment outcomes.
KPIs to Track in Kidney Stone & Lithotripsy Specialty Care Dashboards
Some key performance indicators (KPIs) every hospital should monitor include:
- Stone-Free Rate Percent – Measures successful stone clearance.
- Retreatment Rate Percent – Tracks repeat procedures.
- Procedure Success Rate Percent – Overall effectiveness of interventions.
- Complication Rate Percent – Frequency of procedural complications.
- Postoperative Infection Rate Percent – Infection tracking by procedure and stone type.
- Analgesia Requirement Average Dose (mg) – Pain management assessment.
- Lithotripsy Procedure Volume – Tracks total procedures performed.
Frequently Asked Questions
Q1. Who can use a Kidney Stone & Lithotripsy Specialty Care Dashboard?
Urologists, clinical directors, operations managers, and hospital administrators can use it for monitoring, analysis, and decision-making.
Q2. What visualizations are most useful for kidney stone monitoring?
Stacked columns, line charts, pie charts, waterfall charts, heatmaps, gauges, and funnels are most effective for clinical and operational insights.
Q3. How does it help in resource optimization?
It highlights doctor workloads, bed occupancy, and patient flow inefficiencies, enabling better staffing and scheduling decisions.