
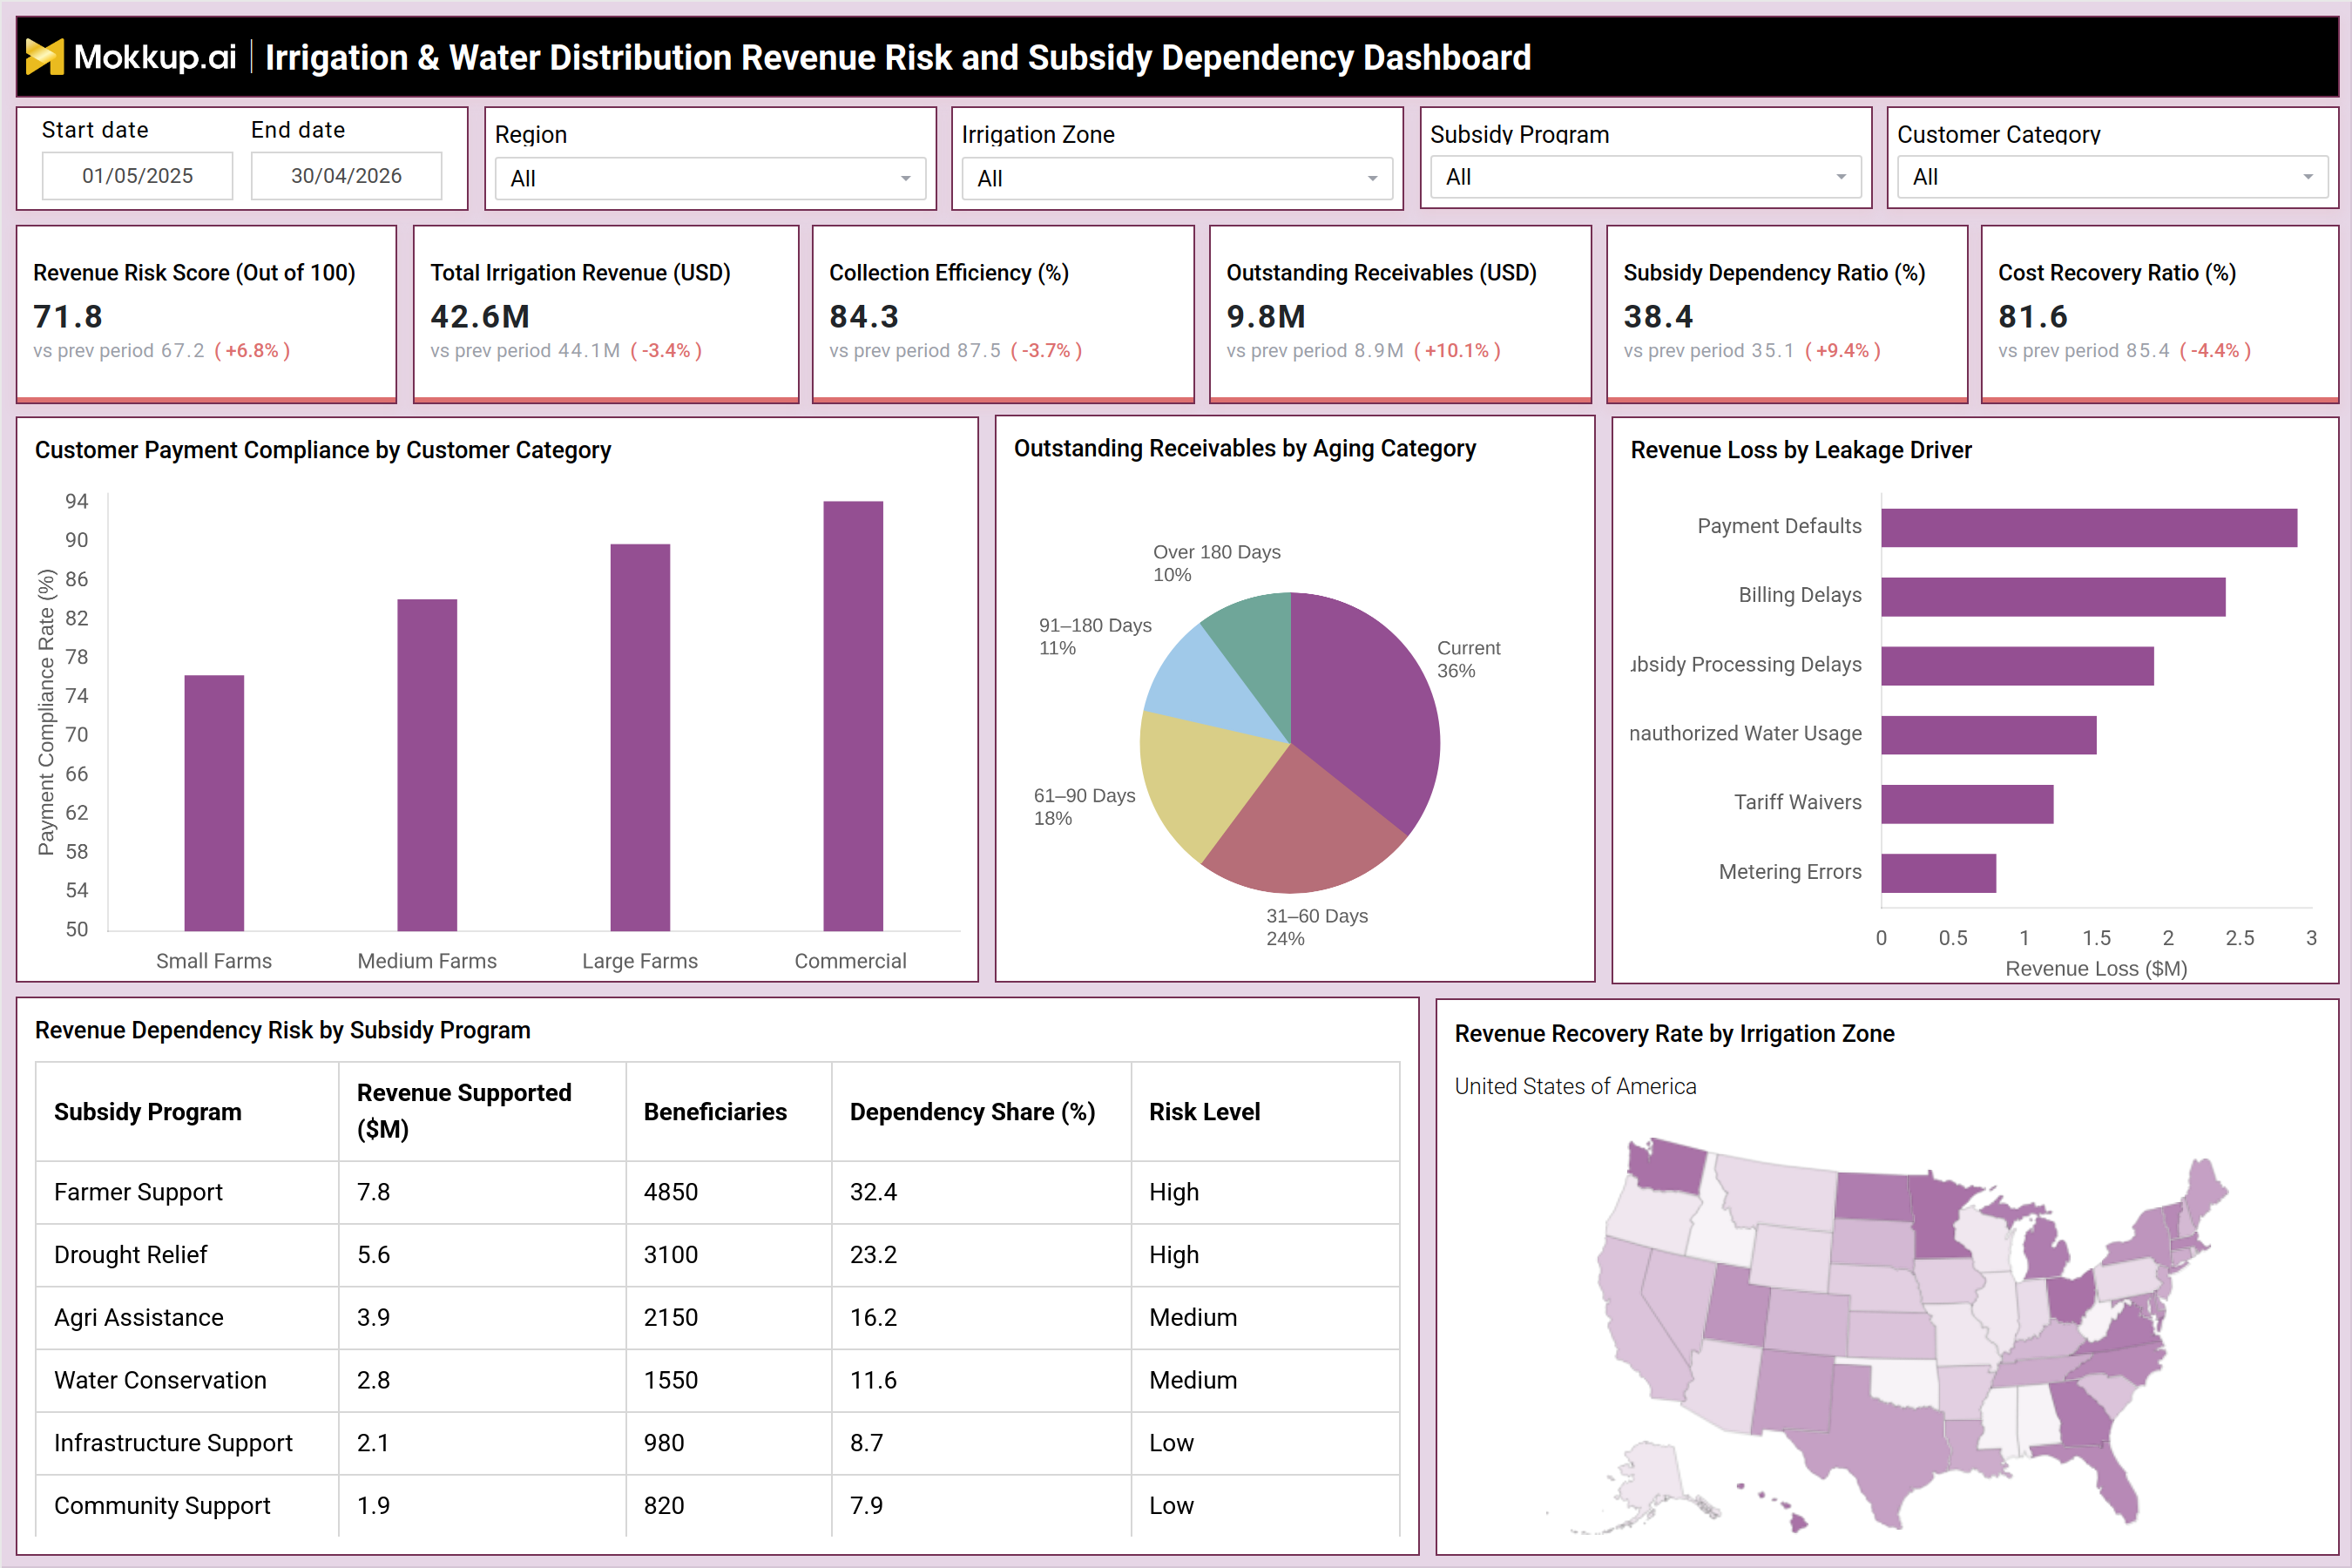
What is an Irrigation & Water Distribution Revenue Risk and Subsidy Dependency Dashboard?
An Irrigation & Water Distribution Revenue Risk and Subsidy Dependency Dashboard helps utilities, irrigation authorities, and water distribution agencies monitor financial sustainability, revenue collection performance, subsidy reliance, and funding risks. The dashboard consolidates critical financial indicators such as revenue risk scores, collection efficiency, outstanding receivables, subsidy dependency ratios, and cost recovery performance into a single view. Organizations use this dashboard to identify revenue leakage, assess the impact of subsidy programs, evaluate customer payment compliance, and improve long-term financial stability. As an irrigation and water distribution revenue risk dashboard, it provides decision-makers with visibility into financial vulnerabilities while supporting better budgeting, policy planning, and revenue optimization strategies.
How to Create an Irrigation & Water Distribution Revenue Risk and Subsidy Dependency Dashboard
You don't need to build your report from scratch, just start with a ready-to-use dashboard template from Mokkup. Add in your data and export it however you like. Here's how to do it:
1. Create or Log in to Your Mokkup Account
Start by signing up on Mokkup.ai using your email. If you already have an account, just log in, and you'll be good to go.
2. Choose and Customize Your Dashboard Template
Find the Irrigation & Water Distribution Revenue Risk and Subsidy Dependency Dashboard template in the Templates section. Use the drag-and-drop editor to adjust KPIs, edit filters, or add elements based on your data.
3. Export to Your BI Tool
Once your dashboard wireframe is ready, use the BI Tool Export feature to send it directly to Power BI or Tableau for further analysis and enhancements. You can also download the dashboard as a PDF, PNG, or JPEG, embed it on a platform, or invite your team to collaborate.
Note: This is a Pro template. You'll need a Pro subscription on Mokkup to use and customize this dashboard wireframe. Upgrade anytime to unlock full access.
Irrigation & Water Distribution Revenue Risk and Subsidy Dependency Dashboard Example
A regional irrigation authority managing multiple irrigation zones can use this irrigation revenue risk and subsidy dependency monitoring dashboard to evaluate the financial health of its operations. Executives can track total irrigation revenue, collection efficiency, subsidy dependency ratios, and cost recovery rates across customer categories and regions. Financial managers can analyze aging receivables, identify major revenue leakage drivers such as payment defaults and billing delays, and assess dependency on government-funded subsidy programs. The dashboard also supports water distribution financial sustainability analytics by highlighting areas where revenue recovery is weak and subsidy exposure is high. This enables proactive actions to improve collections, reduce funding risks, and strengthen operational sustainability.
How to Analyze Data in Irrigation & Water Distribution Revenue Risk and Subsidy Dependency Dashboard
Here is how you can analyze data from this water utility revenue risk management dashboard:
- Monitor Revenue Risk Score: Evaluate overall financial risk exposure by tracking key revenue, collection, and cost recovery indicators in a single metric.
- Analyze Total Irrigation Revenue Trends: Review revenue performance over time to identify growth opportunities, declining trends, and overall financial health.
- Assess Collection Efficiency: Measure the effectiveness of payment collection processes to ensure timely revenue recovery and improve cash flow management.
- Track Outstanding Receivables: Monitor unpaid balances and pending collections to identify revenue recovery challenges and reduce financial risk.
- Evaluate Subsidy Dependency Ratio: Analyze the extent to which operations rely on subsidies or external funding to assess long-term financial sustainability.
- Monitor Cost Recovery Ratio: Determine whether operational and maintenance costs are being adequately recovered through revenue generation.
- Compare Customer Payment Compliance: Assess payment behavior across customer categories to identify segments with higher collection risks or compliance challenges.
- Analyze Receivables Aging Distribution: Review outstanding payments by aging categories to identify overdue accounts and prioritize collection efforts.
- Review Revenue Leakage Drivers: Identify factors such as payment defaults, billing delays, inaccurate invoicing, and metering errors that contribute to revenue loss.
- Assess Subsidy Program Dependency Levels: Evaluate reliance on subsidy programs to understand financial vulnerabilities and reduce dependence on external funding sources.
- Compare Revenue Recovery Rates Across Regions: Benchmark collection and recovery performance across irrigation zones and service regions to identify best practices and improvement areas.
- Use Geographic Analysis to Identify Collection Risks: Analyze regional revenue performance to detect areas with elevated collection challenges, payment delays, or financial risks.
- Monitor Financial Performance Trends Over Time: Track long-term revenue, collection, and cost recovery metrics to evaluate progress and support strategic financial planning.
- Prioritize Corrective Actions for High-Risk Operations: Identify subsidy-dependent or underperforming operations that require targeted interventions to improve financial stability and sustainability.
Benefits of Irrigation & Water Distribution Revenue Risk and Subsidy Dependency Dashboard
The following are the benefits of using a water distribution financial sustainability analytics dashboard:
- Improves Visibility into Revenue Performance: Provides a centralized view of revenue generation, collections, and financial performance to support better financial oversight.
- Reduces Financial Risks: Enables proactive monitoring of outstanding receivables, payment delays, and revenue leakage to minimize financial exposure.
- Supports Effective Subsidy Management: Helps evaluate subsidy utilization and funding requirements, enabling more informed allocation and management decisions.
- Enhances Long-Term Financial Sustainability: Provides insights into cost recovery, revenue trends, and funding dependencies to support sustainable financial planning.
- Identifies Payment Compliance Issues Early: Detects customer payment challenges and collection inefficiencies before they significantly impact revenue performance.
- Improves Revenue Recovery Across Service Areas: Highlights regions with low collection efficiency or high receivables, enabling targeted recovery strategies.
- Enables Better Budgeting and Forecasting: Delivers accurate financial performance data that supports more effective budgeting, forecasting, and resource planning.
- Reduces Dependency on External Subsidies: Identifies opportunities to improve self-sufficiency by strengthening revenue collection and cost recovery performance.
- Supports Data-Driven Policy and Tariff Decisions: Provides financial insights that help organizations evaluate tariff structures, subsidy programs, and revenue strategies.
- Strengthens Financial Governance and Accountability: Enhances transparency through continuous monitoring of financial KPIs, risks, and operational performance.
- Provides Centralized Financial Reporting: Consolidates key revenue and collection metrics into a single platform for finance teams, utility managers, and decision-makers.
- Supports Sustainable Infrastructure Funding Initiatives: Helps organizations align financial performance with long-term investment strategies for maintaining and expanding water infrastructure.
KPIs to Track in Irrigation & Water Distribution Revenue Risk and Subsidy Dependency Dashboard
The following key KPIs can be tracked by using this water distribution financial sustainability analytics dashboard:
- Revenue Risk Score (Out of 100): Measures overall financial risk exposure across irrigation and water distribution operations.
- Total Irrigation Revenue (USD): Tracks total revenue generated from irrigation and water distribution services.
- Collection Efficiency (%): Measures the effectiveness of customer payment collection activities.
- Outstanding Receivables (USD): Indicates unpaid customer balances awaiting collection.
- Subsidy Dependency Ratio (%): Measures the percentage of operations supported through subsidy funding.
- Cost Recovery Ratio (%): Tracks the organization's ability to recover operating costs through revenue generation.
Frequently Asked Questions
1. What is the purpose of an Irrigation & Water Distribution Revenue Risk and Subsidy Dependency Dashboard?
It helps organizations monitor revenue performance, subsidy reliance, financial sustainability, and collection efficiency.
2. Why is subsidy dependency important to monitor?
High subsidy dependency can increase financial vulnerability if funding programs are reduced or discontinued.
3. How does the dashboard improve revenue management?
It identifies collection gaps, receivable risks, and revenue leakage drivers that impact financial performance.