
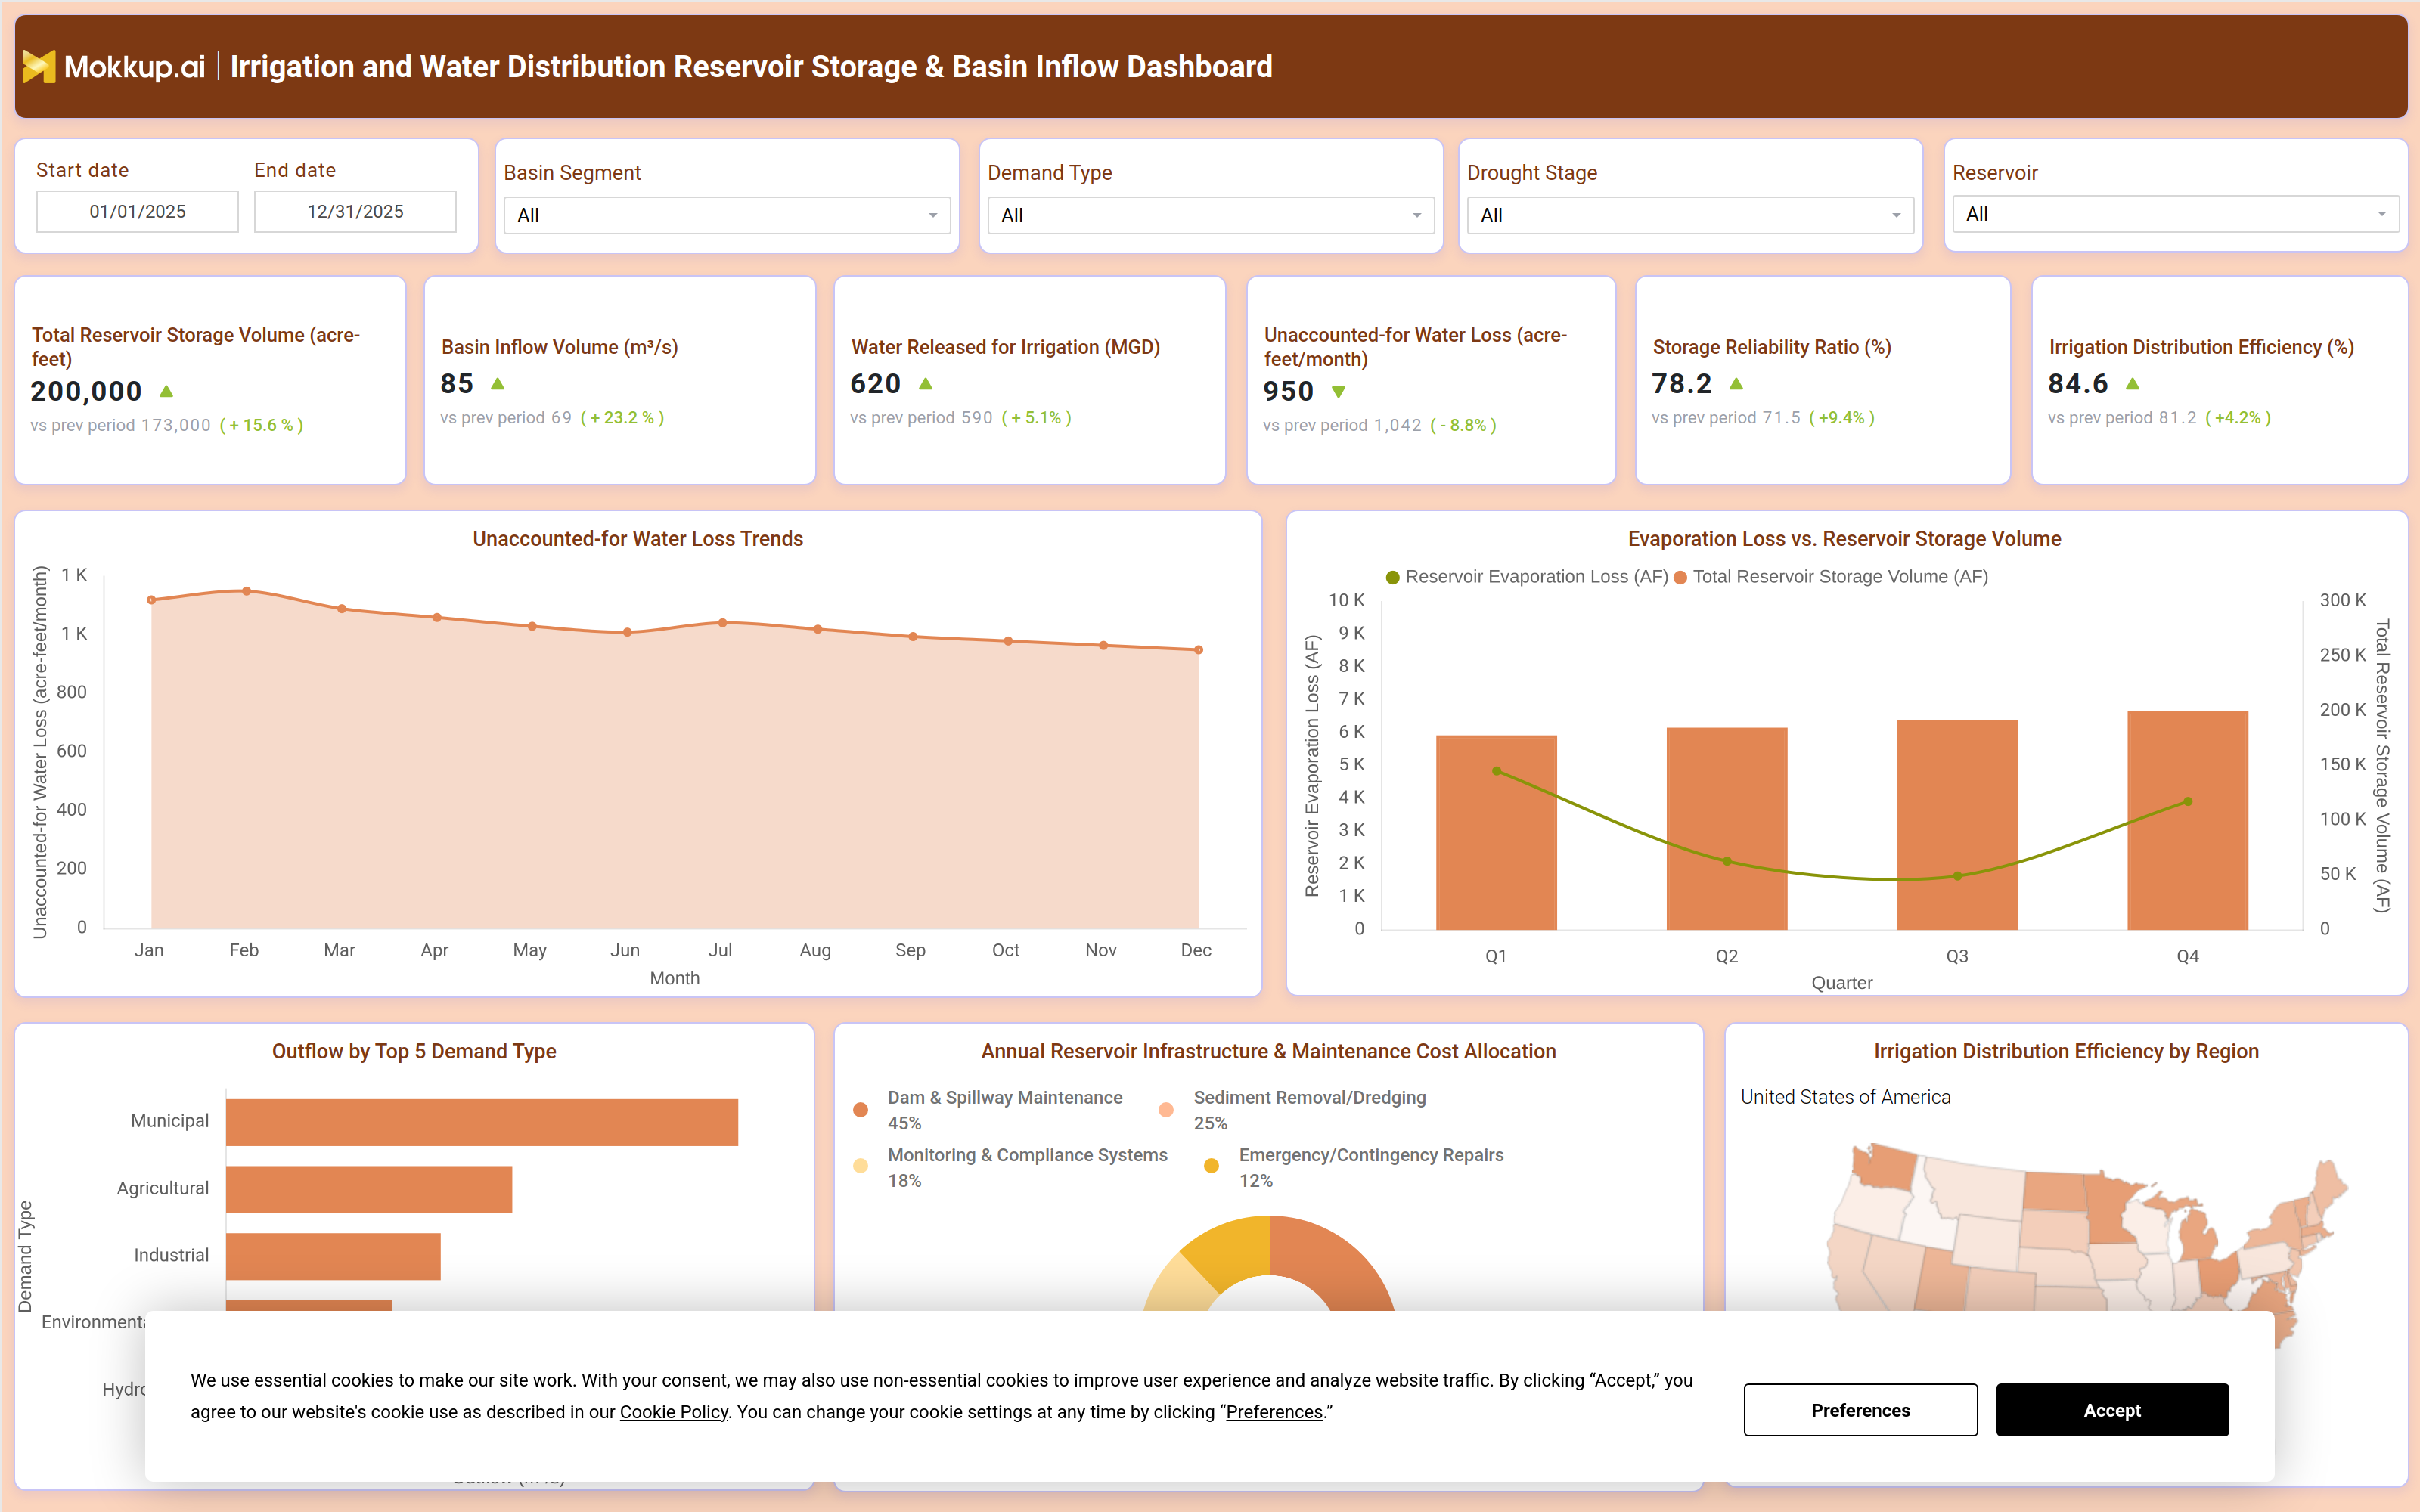
What is an Irrigation and Water Distribution Reservoir Storage & Basin Inflow Dashboard?
The Irrigation and Water Distribution Reservoir Storage & Basin Inflow Dashboard is a wireframe template built for water utility teams responsible for managing reservoir capacity, basin hydrology, and irrigation demand across a service territory. As an irrigation and water distribution reservoir storage dashboard, it consolidates storage volume, inflow, outflow, and infrastructure spend into a single view so planners no longer reconcile hydrology reports, maintenance logs, and demand forecasts from separate sources. Filters for basin segment, demand type, drought stage, and reservoir let teams narrow the view to a specific watershed or customer class without losing the full-system context. Because it also functions as a basin inflow volume tracking dashboard, water resource teams watch how upstream conditions translate into usable storage before drought stages escalate, giving planning and operations groups a shared reference point for allocation decisions.
How to Create an Irrigation and Water Distribution Reservoir Storage & Basin Inflow Dashboard
You don’t need to build your report from scratch; just start with a ready-to-use dashboard template from Mokkup. Add in your data and export it however you like. Here’s how to do it:
1. Create or Log in to Your Mokkup Account
Start by signing up on Mokkup.ai using your email. If you already have an account, just log in, and you'll be good to go.
2. Choose and Customize Your Dashboard Template
Find the Irrigation and Water Distribution Reservoir Storage & Basin Inflow Dashboard template in the Templates section. Use the drag-and-drop editor to adjust KPIs, edit filters, or add elements based on your data.
3. Export to Your BI Tool
Once your dashboard wireframe is ready, use the BI Tool Export feature to send it directly to Power BI or Tableau for further analysis and enhancements. You can also download the dashboard as a PDF, PNG, or JPEG, embed it on a platform, or invite your team to collaborate.
Note: This is a Pro template. You'll need a Pro subscription on Mokkup to use and customize this dashboard wireframe. Upgrade anytime to unlock full access.
Irrigation and Water Distribution Reservoir Storage & Basin Inflow Dashboard Example
A reservoir operations manager typically opens this irrigation and water distribution reservoir storage dashboard at the start of a planning cycle to check whether current storage and basin inflow can support the season's irrigation, municipal, and industrial demand. Instead of pulling separate hydrology and billing reports, they scan the top-level view to see whether storage is trending ahead of or behind the prior period before deciding whether to adjust release schedules. From there, planners compare how much water is being released for irrigation against how much is being lost to unaccounted-for leakage, using this unaccounted-for water loss monitoring dashboard to spot months where losses are climbing faster than expected. When losses trend upward, teams drill into evaporation patterns alongside storage volume to judge whether the cause is seasonal or points to an infrastructure issue that needs inspection.
Filtering by demand type also lets managers see which customer segment, municipal, agricultural, industrial, environmental, or hydroelectric, is driving the largest share of outflow, so allocation conversations are grounded in actual usage rather than assumption. Reviewing infrastructure and maintenance cost allocation alongside regional distribution efficiency helps leadership prioritize which dam, spillway, or monitoring investment will protect reliability at the lowest cost, while the regional view flags which service areas need distribution upgrades first. Together, these views let a utility move from reactive drought response to proactive basin and reservoir management.
How to Analyze Data in a Irrigation and Water Distribution Reservoir Storage & Basin Inflow Dashboard
Here is how you can analyze data from this dashboard:
- Filter by basin segment and reservoir to isolate performance for a single watershed or storage facility.
- Compare basin inflow volume against total reservoir storage volume to judge whether reserves are building or depleting.
- Use this unaccounted-for water loss monitoring dashboard to track monthly loss trends and flag months that break from seasonal norms.
- Reference this reservoir evaporation loss tracking tool alongside quarterly storage volume to separate evaporation-driven loss from distribution loss.
- Segment outflow by demand type to see which customer class is consuming the largest share of released water.
- Review infrastructure and maintenance cost allocation to understand where capital is being spent relative to risk.
- Apply the drought stage filter to see how storage and release patterns shift as conditions worsen.
- Check irrigation distribution efficiency by region to identify service areas lagging the network average.
Benefits of a Irrigation and Water Distribution Reservoir Storage & Basin Inflow Dashboard
The following are the benefits of using this dashboard:
- Consolidates reservoir storage, basin inflow, and irrigation release data into one dashboard, removing manual reconciliation.
- Supports faster response to drought stages by surfacing storage reliability trends as they develop.
- This reservoir evaporation loss tracking tool separates evaporation-driven loss from distribution loss for more accurate loss accounting.
- Enables an irrigation distribution efficiency by region analysis so utilities know exactly where to prioritize upgrades.
- Improves budget planning by tying infrastructure and maintenance cost allocation to storage and reliability outcomes.
- Gives demand planning teams a shared, filterable view across basin segment, reservoir, and customer type.
- Reduces time spent building manual hydrology and outflow reports for board or regulator reviews.
KPIs to Track in an Irrigation and Water Distribution Reservoir Storage & Basin Inflow Dashboard
The following key KPIs can be tracked by using this dashboard:
- Total Reservoir Storage Volume (acre-feet): the volume of water currently held across reservoirs, showing how much supply is available against demand.
- Basin Inflow Volume (m3/s): the rate at which water enters the basin from upstream sources, signaling whether storage is being replenished or drawn down.
- Water Released for Irrigation (MGD): the volume of water released specifically to meet irrigation demand across the service area.
- Unaccounted-for Water Loss (acre-feet/month): water lost to leakage, theft, or metering error rather than authorized use.
- Storage Reliability Ratio (%): This storage reliability ratio monitoring water utility teams track shows how consistently reservoirs meet expected demand without a shortfall.
- Irrigation Distribution Efficiency (%): the share of released water that reaches its intended destination, feeding the irrigation distribution efficiency by region analysis, used to prioritize upgrades.
Frequently Asked Questions
1. What data does the Irrigation and Water Distribution Reservoir Storage & Basin Inflow Dashboard track?
It tracks reservoir storage volume, basin inflow, irrigation release, unaccounted-for water loss, evaporation, and outflow by demand type. Filters for basin segment, drought stage, and reservoir let teams narrow the view to a specific watershed or facility.
2. Can I use this basin inflow volume tracking dashboard for multiple reservoirs?
Yes, the reservoir filter lets you switch between individual reservoirs or view the full basin network. This makes the basin inflow volume tracking dashboard useful for both single-facility monitoring and portfolio-level comparisons across a utility's storage assets.
3. How does this storage reliability ratio monitoring water utility dashboard help during drought?
The drought stage filter lets teams see how storage reliability and release patterns shift as conditions worsen. This storage reliability ratio monitoring water utility teams depend on helps prioritize which basins need conservation measures first.