
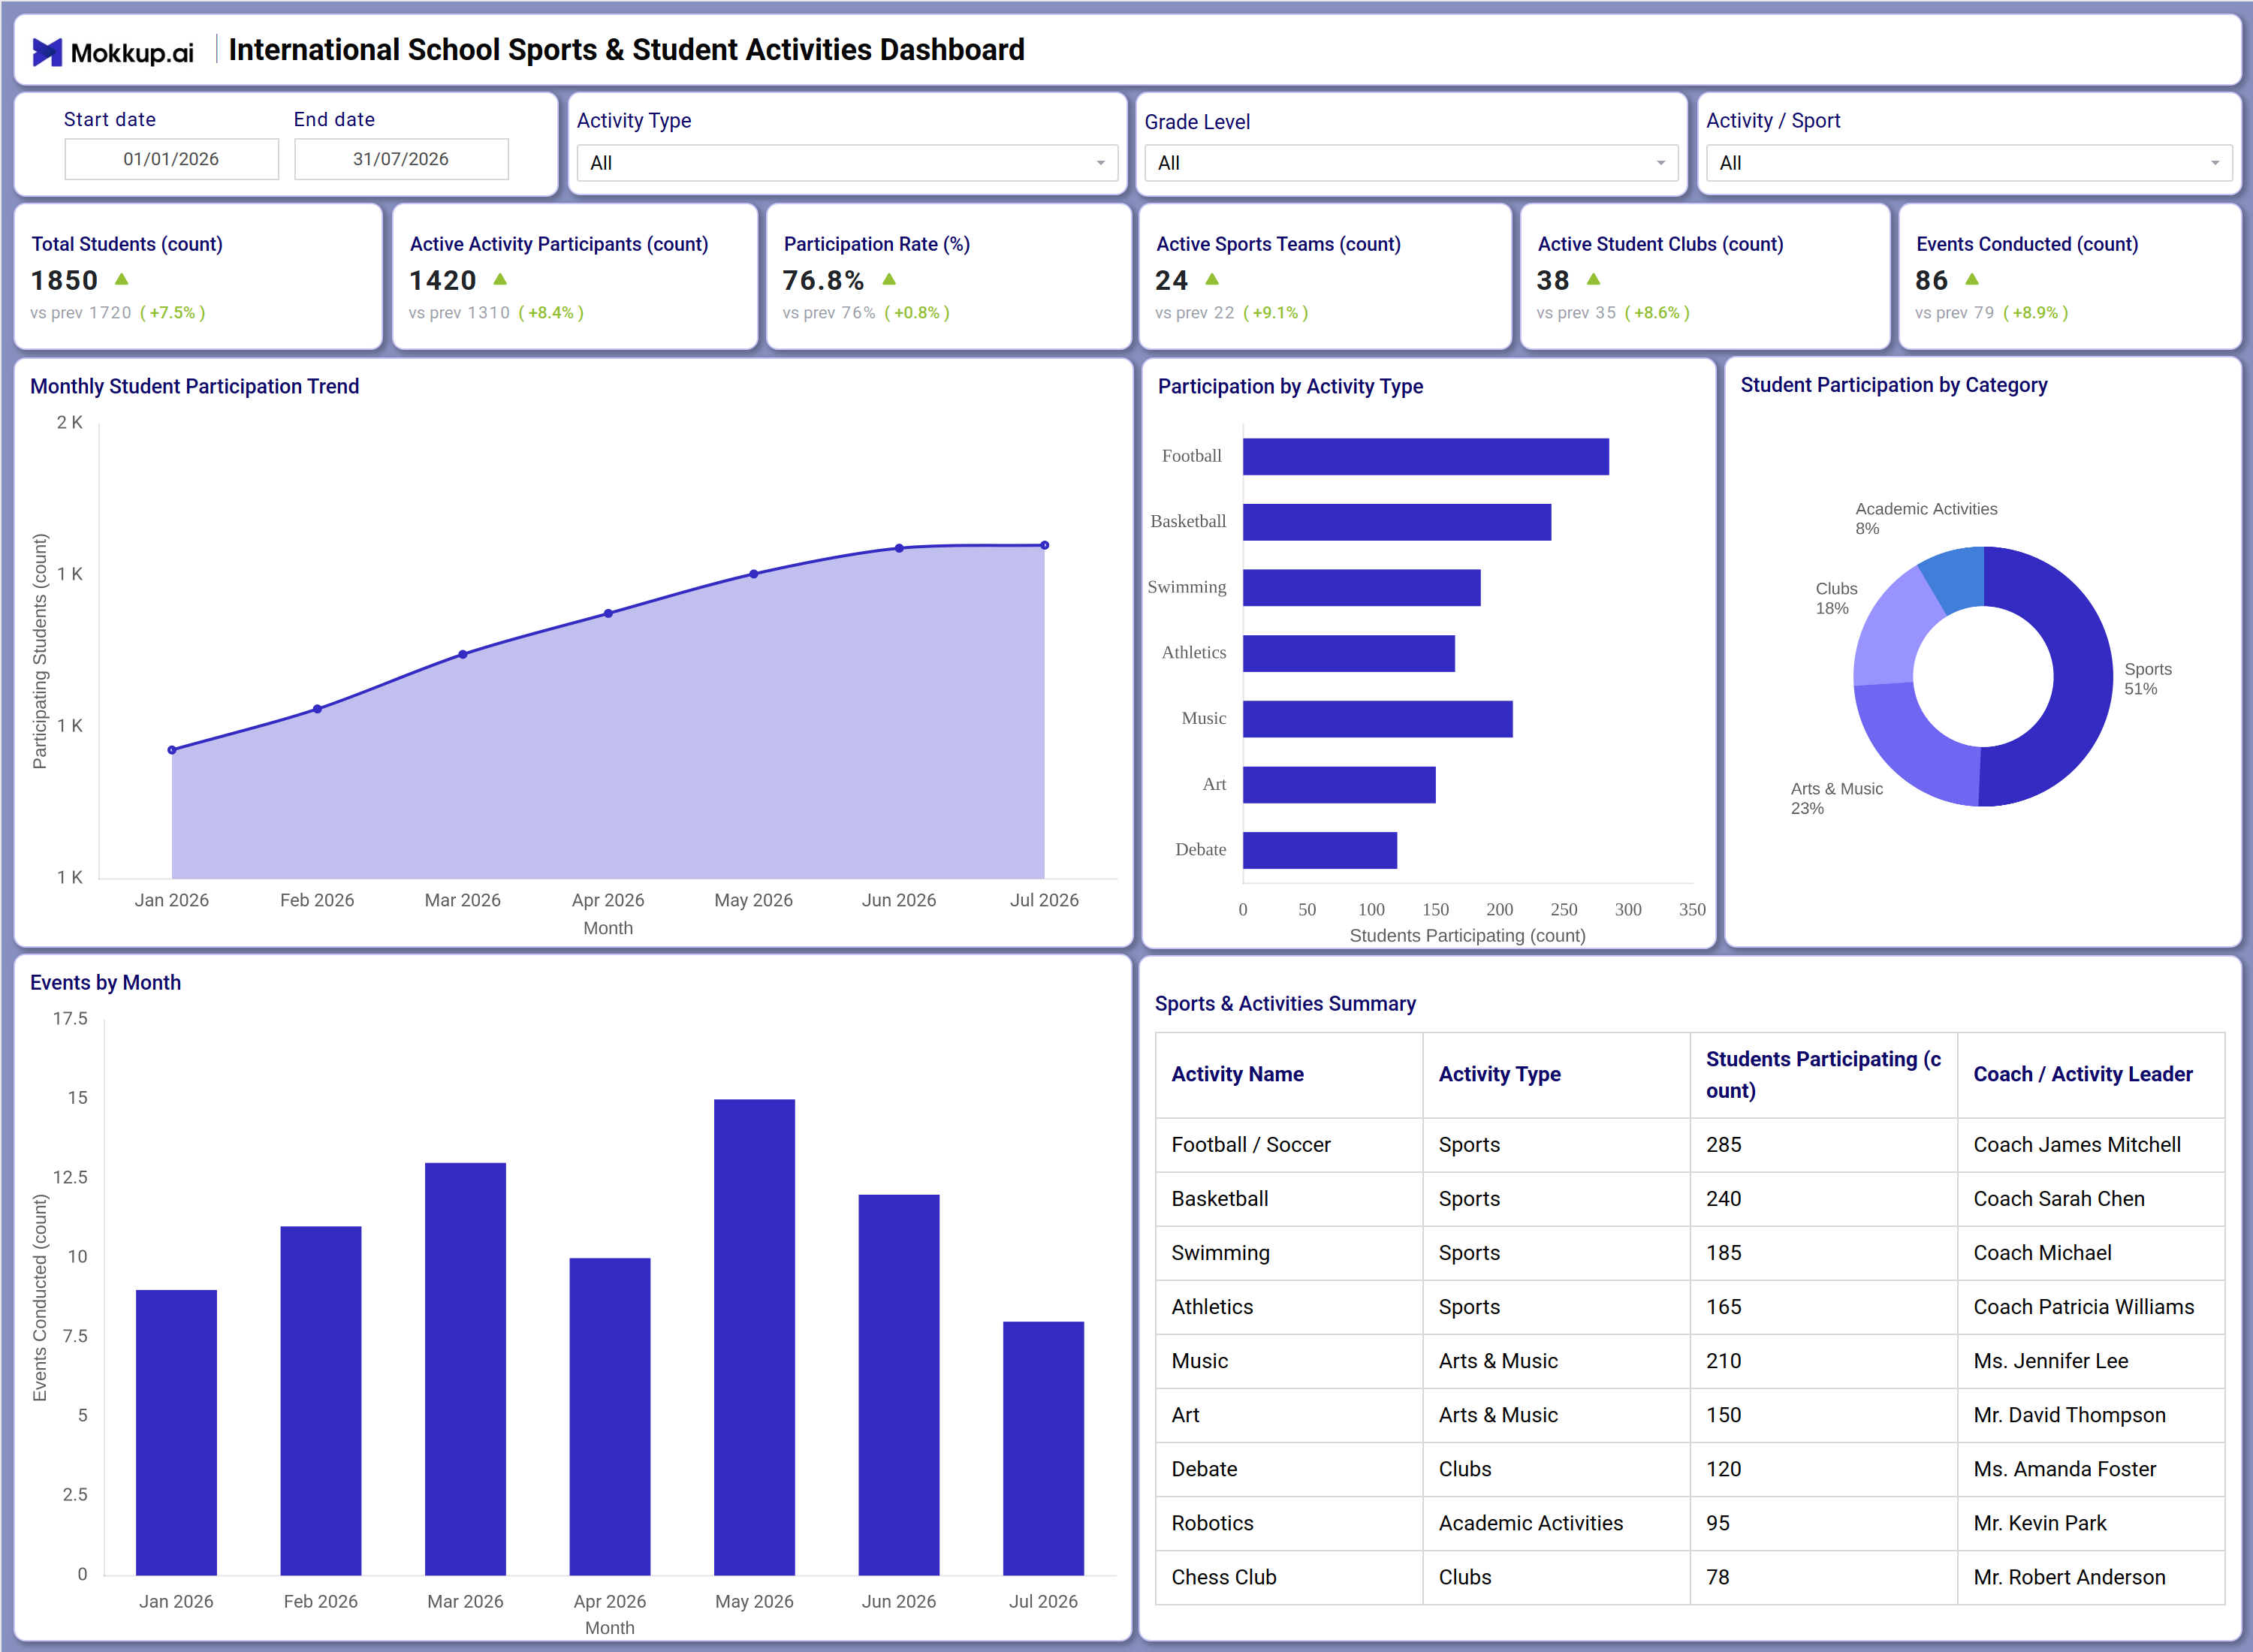
What is an International School Sports & Student Activities Dashboard?
The International School Sports & Student Activities Dashboard is a single-screen reporting template that gives school administrators, physical education coordinators, and student activity leads a consolidated view of extracurricular participation across sports, clubs, arts, and academic activities. Built as an international school sports activities dashboard, it tracks student enrollment, sports team counts, and club memberships alongside the events conducted each term. Administrators rely on a student participation rate tracking dashboard view like this one to compare current-term engagement against prior periods and catch declines before they affect enrollment. With filters for Activity Type, Grade Level, and Activity/Sport, this events conducted tracking dashboard template lets leadership review participation trends by grade and category without exporting data into spreadsheets.
How to Create an International School Sports & Student Activities Dashboard
You don’t need to build your report from scratch; just start with a ready-to-use dashboard template from Mokkup. Add in your data and export it however you like. Here’s how to do it:
1. Create or Log in to Your Mokkup Account
Start by signing up on Mokkup.ai using your email. If you already have an account, just log in, and you'll be good to go.
2. Choose and Customize Your Dashboard Template
Find the International School Sports & Student Activities Dashboard template in the Templates section. Use the drag-and-drop editor to adjust KPIs, edit filters, or add elements based on your data.
3. Export to Your BI Tool
Once your dashboard wireframe is ready, use the BI Tool Export feature to send it directly to Power BI or Tableau for further analysis and enhancements. You can also download the dashboard as a PDF, PNG, or JPEG, embed it on a platform, or invite your team to collaborate.
Note: This is a Pro template. You'll need a Pro subscription on Mokkup to use and customize this dashboard wireframe. Upgrade anytime to unlock full access.
International School Sports & Student Activities Dashboard Example
A typical activities coordinator opens this dashboard at the start of a new term to understand which sports, clubs, and academic programs are gaining or losing student interest. Instead of collecting enrollment sheets from individual coaches and club leaders, the coordinator filters by Grade Level and Activity Type to see how participation is trending across the school before deciding where to invest coaching time or add new sections. On this single screen, leadership can compare how sports, arts, music, and clubs each contribute to overall student involvement, and identify which grade levels are underrepresented in extracurricular life.
Teams can track whether the pace of events held each month is keeping up with demand, and planners can use this active sports teams tracking tool to decide which teams need additional coaching staff or facility time. When a specific activity such as football or swimming shows unusually high or low sign-ups, staff can drill into that category using the Activity/Sport filter to confirm whether the shift is seasonal or a longer-term trend.The overall outcome is that the school replaces scattered coach and club leader updates with one shared reference point for extracurricular planning, helping administrators allocate budget, staffing, and facility time to the activities where student demand is strongest.
How to Analyze Data in an International School Sports & Student Activities Dashboard
Here is how you can analyze data from this dashboard:
- Use the Activity Type filter to isolate participation trends for sports, arts, music, or academic activities.
- Use the Grade Level filter to compare extracurricular engagement across grade bands.
- Filter by Activity/Sport to review enrollment and coaching details for a single team or club.
- Monitor the Monthly Student Participation Trend to spot momentum shifts before a term ends.
- Review the Participation by Activity Type bar chart to identify which activities draw the highest enrollment.
- Compare segments in the Student Participation by Category donut to assess the balance between sports, arts, clubs, and academics.
- Track the Events by Month chart to confirm event cadence keeps pace with participation growth.
- Use the Sports & Activities Summary table to check coach assignments and participation counts by activity.
Benefits of an International School Sports & Student Activities Dashboard
The following are the benefits of using this dashboard:
- Consolidates student enrollment, sports, club, and event data into one international school sports activities dashboard view.
- Replaces manual coach and club leader reporting with a single, structured template for extracurricular engagement.
- Supports participation by activity type analysis so coordinators can compare sports, arts, music, and clubs side by side.
- Gives administrators a student club membership tracking dashboard view to guide budget and staffing decisions for clubs.
- Highlights month-over-month growth in students, participants, and events so gaps can be addressed early.
- Helps activity leads prioritize coaching and facility resources based on demonstrated student demand.
- Provides one shared reference point for principals, coordinators, and activity leads planning the term calendar.
KPIs to Track in an International School Sports & Student Activities Dashboard
The following key KPIs can be tracked by using this dashboard:
- Total Students (count): Tracks total school enrollment, the base figure against which activity participation is measured.
- Active Activity Participants (count): Measures how many students are currently engaged in at least one sport, club, or activity.
- Participation Rate (%): Powers this student participation rate tracking dashboard by showing what share of the student body is involved in extracurricular life.
- Active Sports Teams (count): Anchors this active sports teams tracking tool by counting how many teams are currently running across the school.
- Active Student Clubs (count): Feeds this student club membership tracking dashboard by counting how many clubs are active in a given term.
- Events Conducted (count): Drives this events conducted tracking dashboard template by totaling matches, competitions, and showcases held during the period.
Frequently Asked Questions
1. Who should use the International School Sports & Student Activities Dashboard?
School administrators, PE coordinators, and student activity leads use this dashboard to track enrollment across sports, clubs, and academic activities in one place. It suits any international school managing multiple grade levels and activity types at once.
2. Can this dashboard track club membership alongside sports participation?
Yes, it functions as a student club membership tracking dashboard alongside sports data, covering categories such as Clubs, Arts & Music, and Academic Activities. The Student Participation by Category chart shows how each category contributes to total involvement.
3. How does the Participation by Activity Type chart work?
The Participation by Activity Type bar chart ranks each sport, club, and program by enrollment, making participation by activity type analysis simple for coordinators comparing categories side by side.