What is a Hydropower Plant Executive Command Dashboard?
A Hydropower Plant Executive Command Dashboard template is a centralized performance and governance system designed for leadership teams in the electric utility industry. It provides visibility into generation output, equipment reliability, operational efficiency, safety compliance, and workforce readiness. As a hydropower plant executive command dashboard, it consolidates strategic KPIs into a single interface, helping executive teams assess plant health across regions, asset types, and operational areas.
The dashboard wireframe also functions as a utility-scale hydroelectric operational oversight and performance monitoring tool, enabling leaders to review trends in electricity generation, unit availability, operating costs, equipment risks, and sustainability performance.
How to Create a Hydropower Plant Executive Command Dashboard
You don’t need to build your report from scratch—just start with a ready-to-use Hydropower Plant Executive Command Dashboard template from Mokkup. Add in your data and export it however you like. Here’s how to do it:
1. Create or Log in to Your Mokkup Account
Start by signing up on Mokkup.ai using your email. If you already have an account, just log in, and you’ll be good to go.
2. Choose and Customize Your Dashboard Template
Find the Hydropower Plant Executive Command Dashboard template in the Templates section. Use the drag-and-drop editor to adjust KPIs, edit filters, or add elements based on your data.
3. Export to Your BI Tool
Once your dashboard wireframe is ready, use the BI Tool Export feature to send it directly to Power BI or Tableau for further analysis and enhancements. You can also download the dashboard as a PDF, PNG, or JPEG, embed it on a platform, or invite your team to collaborate.
Note: This is a Pro template. You’ll need a Pro subscription on Mokkup to use and customize this dashboard wireframe. Upgrade anytime to unlock full access.
Hydropower Plant Executive Command Dashboard Example
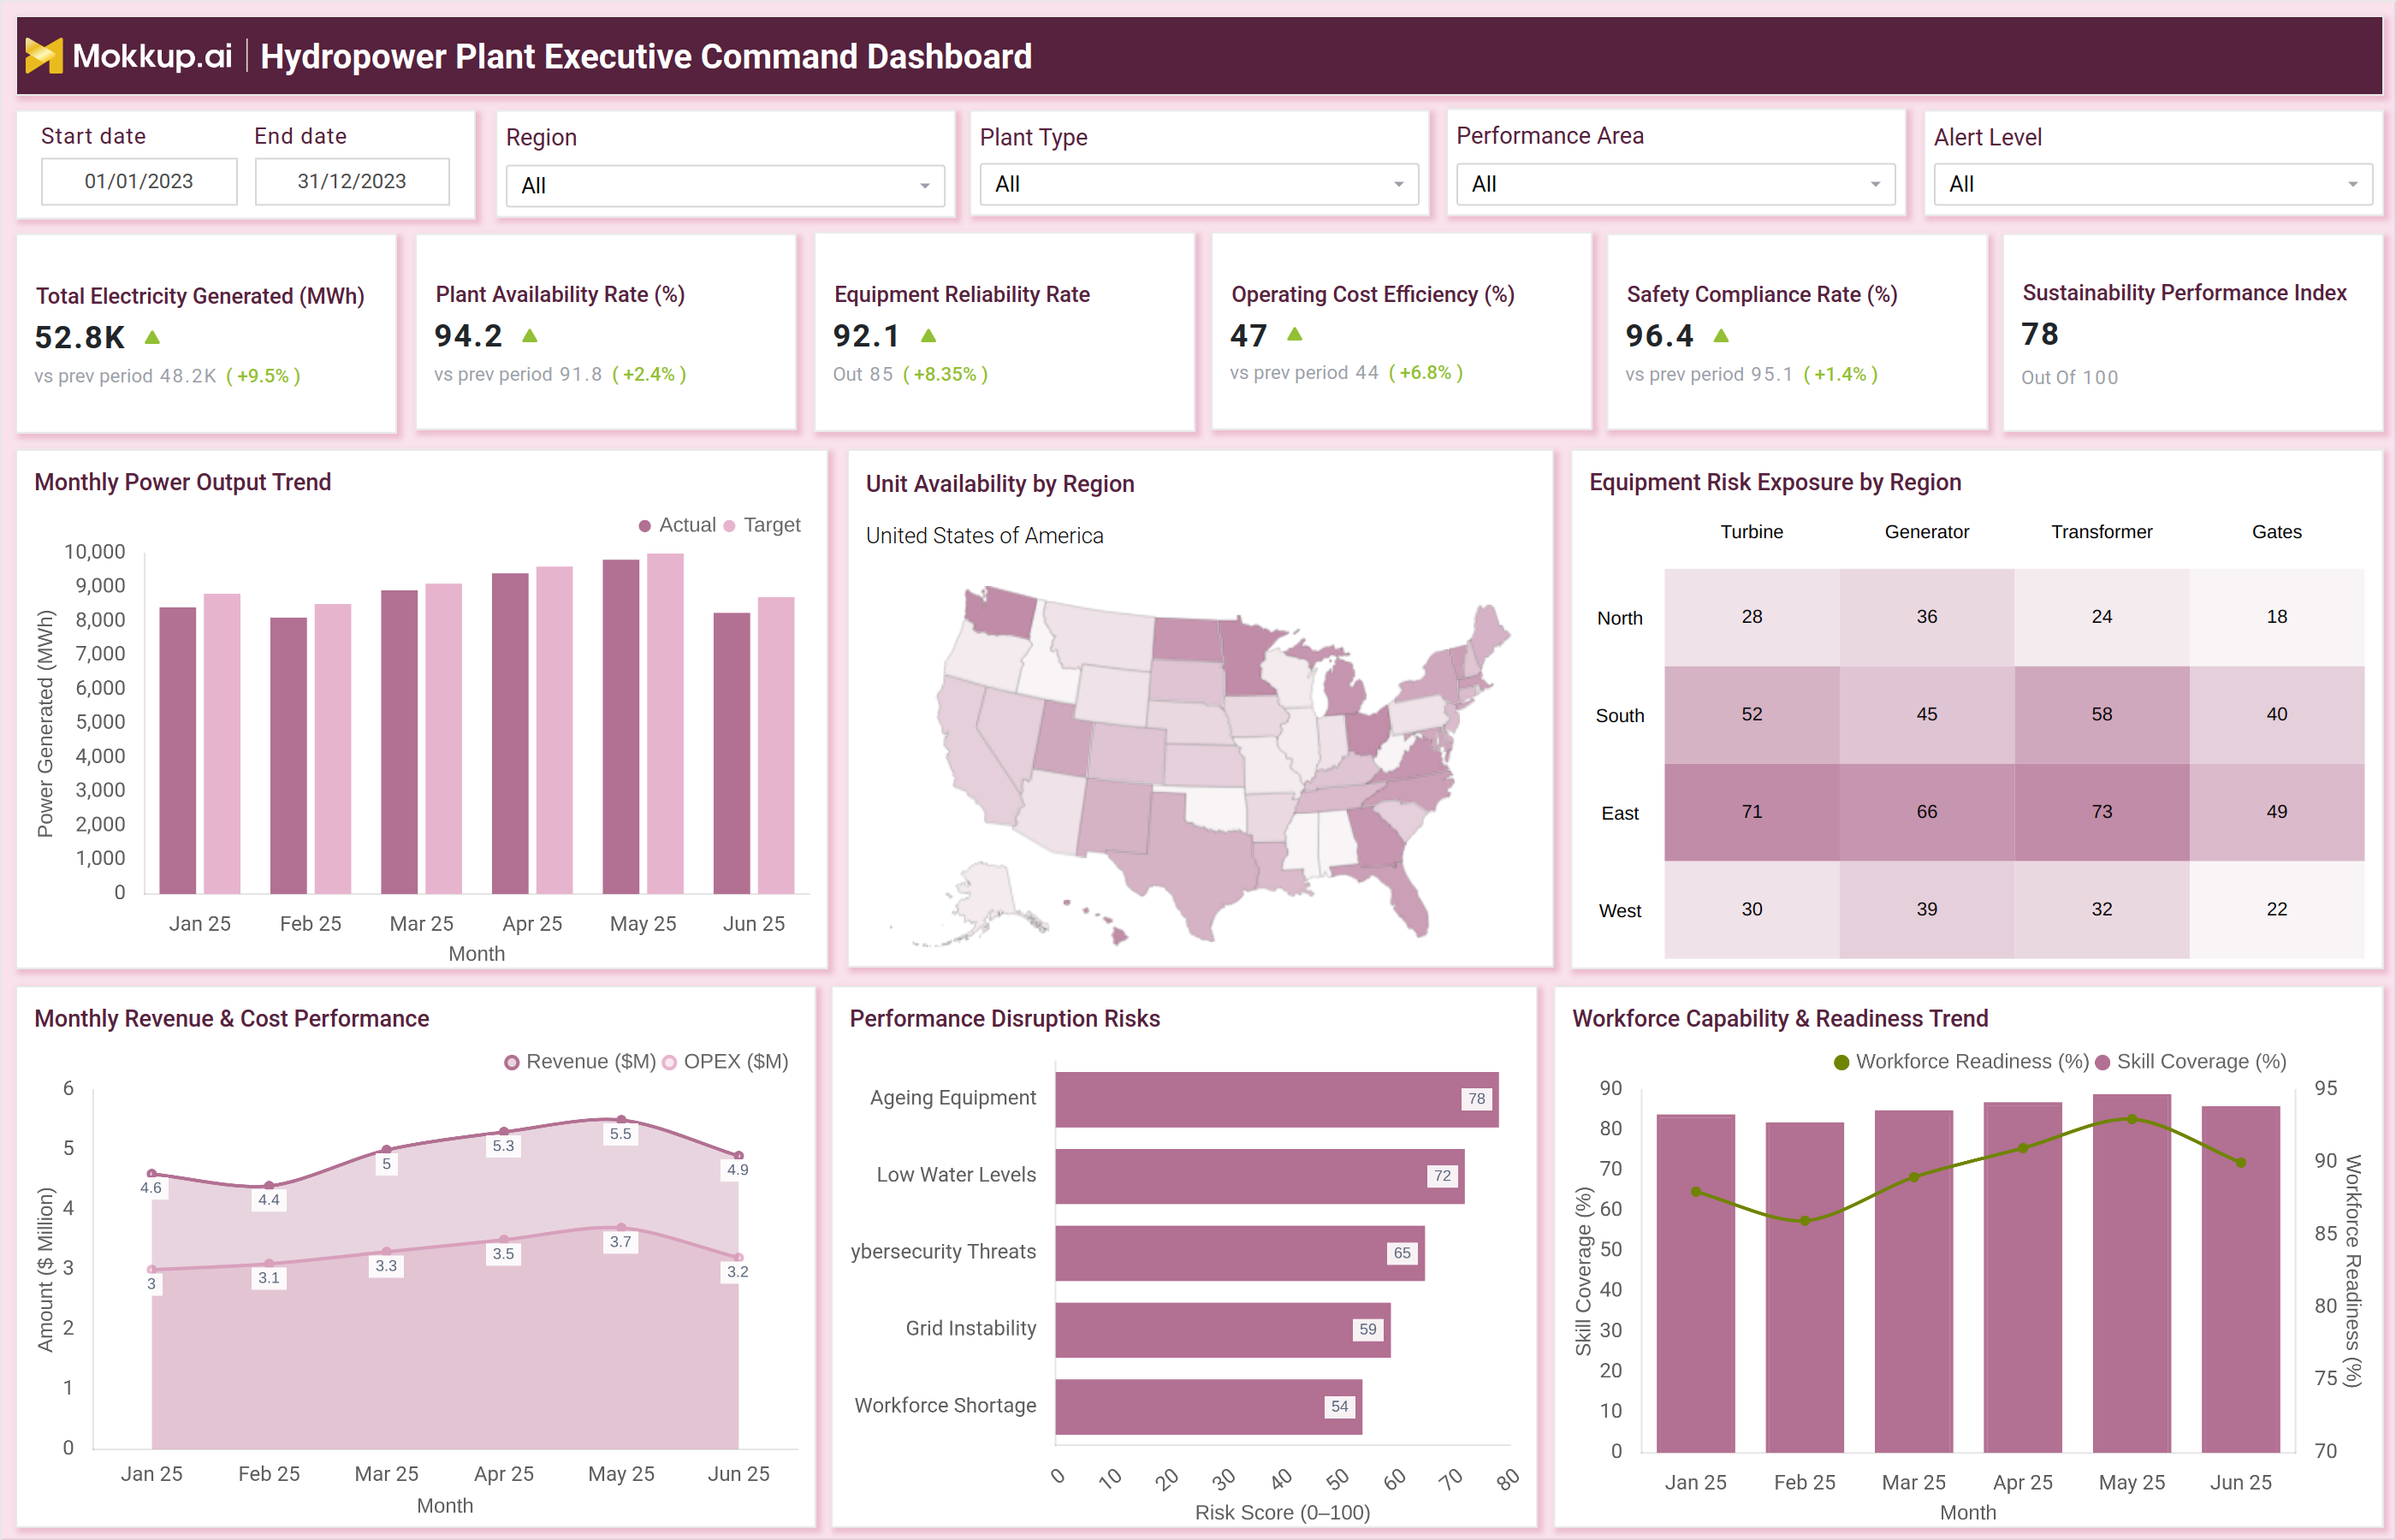
An example of the dashboard includes multiple executive-level insights shown through interactive charts, maps, and performance metrics. Key KPIs such as Total Electricity Generated, Plant Availability Rate, Equipment Reliability Rate, Operating Cost Efficiency, Safety Compliance, and Sustainability Performance Index provide a high-level snapshot of operational stability. These metrics help validate whether hydropower plants are performing in line with expected reliability and safety targets. This makes the dashboard an effective electric utility hydro plant reliability, availability, and generation performance dashboard. The Monthly Power Output Trend chart compares actual power output with target generation, helping leaders identify underperformance or seasonal variations. A Unit Availability by Region map supports geographic comparisons, showing where equipment availability is high or constrained. Equipment Risk Exposure visuals highlight turbine, generator, transformer, and gate risks across regions, enabling leaders to prioritize maintenance resources.
Monthly Revenue & Cost Performance charts display revenue trends alongside OPEX patterns, enabling executives to assess financial sustainability. Performance Disruption Risk indicators track key risk drivers, including aging equipment, low water levels, grid instability, workforce shortages, and cybersecurity threats. Together, these components form a hydropower generation operational intelligence and real-time performance analytics platform. The Workforce Capability & Readiness Trend chart highlights skill coverage and workforce readiness percentages, enabling utilities to evaluate their operational preparedness. With this holistic view, the dashboard serves as a command center for leadership at hydroelectric stations, providing insights into assets, risk, and operations.
How to Analyze Data in a Hydropower Plant Executive Command Dashboard
Here is how you can analyze data from this dashboard:
- Electricity Generation Trends: Evaluate monthly generation patterns by comparing actual output versus targets.
- Plant Availability Rate: Monitor operational uptime to identify periods of reduced availability.
- Equipment Reliability Metrics: Review reliability rates to detect potential failures and schedule preventive maintenance.
- Operating Cost Efficiency: Assess how effectively operational costs are being optimized.
- Safety Compliance Rate: Track adherence to hydropower industry safety norms and protocols.
- Sustainability Performance Index: Measure environmental performance across plants.
- Unit Availability by Region: Identify geographical strengths or areas with constrained availability.
- Equipment Risk Exposure: Analyze heatmaps to pinpoint high-risk equipment categories across regions.
- Revenue vs. OPEX Trends: Compare revenue and operational expenditure to evaluate financial health.
- Disruption Risk Indicators: Track early warning signs related to water levels, ageing assets, or grid instability.
- Workforce Readiness and Skill Coverage: Review workforce capability and preparedness for ongoing operations.
Benefits of Hydropower Plant Executive Command Dashboard
The following are the benefits of using this dashboard:
- Centralized Executive Insights: Consolidates key operational, safety, financial, and workforce metrics.
- Strategic Decision Support: Enables data-driven and real-time executive decision-making.
- Improved Operational Governance: Enhances oversight across multiple hydropower sites.
- Early Risk Identification: Highlights equipment and regional risks using visual analytics.
- Compliance and Sustainability Tracking: Monitors safety, environmental, and regulatory metrics to ensure adherence to standards.
- Optimized Workforce Planning: Supports resource allocation through readiness and skill assessments, ensuring optimal workforce utilization.
- Financial Performance Visibility: Helps leadership track monthly OPEX and revenue trends.
- Strengthened Asset Intelligence: Supports long-term planning for high-value hydropower assets.
- Cross-Site Benchmarking: Facilitates performance comparison across plants and regions.
- Structured Risk Monitoring: Provides clear indicators of disruption for timely action.
KPIs to Track in a Hydropower Plant Executive Command Dashboard
The following key KPIs can be tracked by using this dashboard:
- Total Electricity Generated (MWh): Measures total generation output.
- Plant Availability Rate (%): Indicates operational uptime across units.
- Equipment Reliability Rate (%): Measures the consistency of performance of critical equipment.
- Operating Cost Efficiency (%): Tracks cost optimization for hydropower operations.
- Safety Compliance Rate (%): Shows safety alignment across teams and assets.
- Sustainability Performance Index: Measures environmental performance.
- Unit Availability by Region: Evaluates operational readiness by location.
- Equipment Risk Exposure: Highlights asset risk categories across regions.
- Revenue ($M) vs. OPEX ($M): Tracks financial performance month-on-month.
- Disruption Risk Indicators: Provides early warnings for operational challenges.
- Workforce Skill Coverage (%): Measures workforce capability strength.
- Workforce Readiness (%): Indicates the preparedness of the workforce for operational tasks.
Frequently Asked Questions
Q1. Who uses this dashboard?
Utility executives, plant directors, asset managers, financial controllers, environmental teams, and operational leadership teams.
Q2. Why is an executive command dashboard important for hydropower plants?
It centralizes operational, financial, and risk data, helping leadership make faster, more informed decisions.
Q3. Does the dashboard support multi-plant performance comparison?
Yes. It allows benchmarking across regions, plant types, and asset groups.