
What is a Hydrogen Blend Revenue & Cost Impact Dashboard
A hydrogen blend revenue & cost impact dashboard is an analytics tool designed for natural gas utilities to track financial performance related to hydrogen gas operations. It consolidates data on hydrogen procurement costs, blending margins, tariff revenue, carbon credit earnings, and regulatory compliance into a single interface. By integrating historical data, the dashboard enables utilities to assess profitability, identify cost-saving opportunities, and align blending strategies with decarbonization goals. It also helps in forecasting revenue trends, comparing performance across blending facilities, and evaluating the financial impact of different hydrogen sources (green, blue, or gray).
How to Create a Hydrogen Blend Revenue & Cost Impact Dashboard
You don't need to build your report from scratch, just start with a ready-to-use dashboard template from Mokkup. Add in your data and export it however you like. Here's how to do it:
1. Create or Log in to Your Mokkup Account
Start by signing up on Mokkup.ai using your email. If you already have an account, just log in, and you'll be good to go.
2. Choose and Customize Your Dashboard Template
Find the Hydrogen Blend Revenue & Cost Impact Dashboard template in the Templates section. Use the drag-and-drop editor to adjust KPIs, edit filters, or add elements based on your data.
3. Export to Your BI Tool
Once your dashboard wireframe is ready, use the BI Tool Export feature to send it directly to Power BI or Tableau for further analysis and enhancements. You can also download the dashboard as a PDF, PNG, or JPEG, embed it on a platform, or invite your team to collaborate.
Note: This is a Pro template. You'll need a Pro subscription on Mokkup to use and customize this dashboard wireframe. Upgrade anytime to unlock full access.
Hydrogen Blend Revenue & Cost Impact Dashboard Example
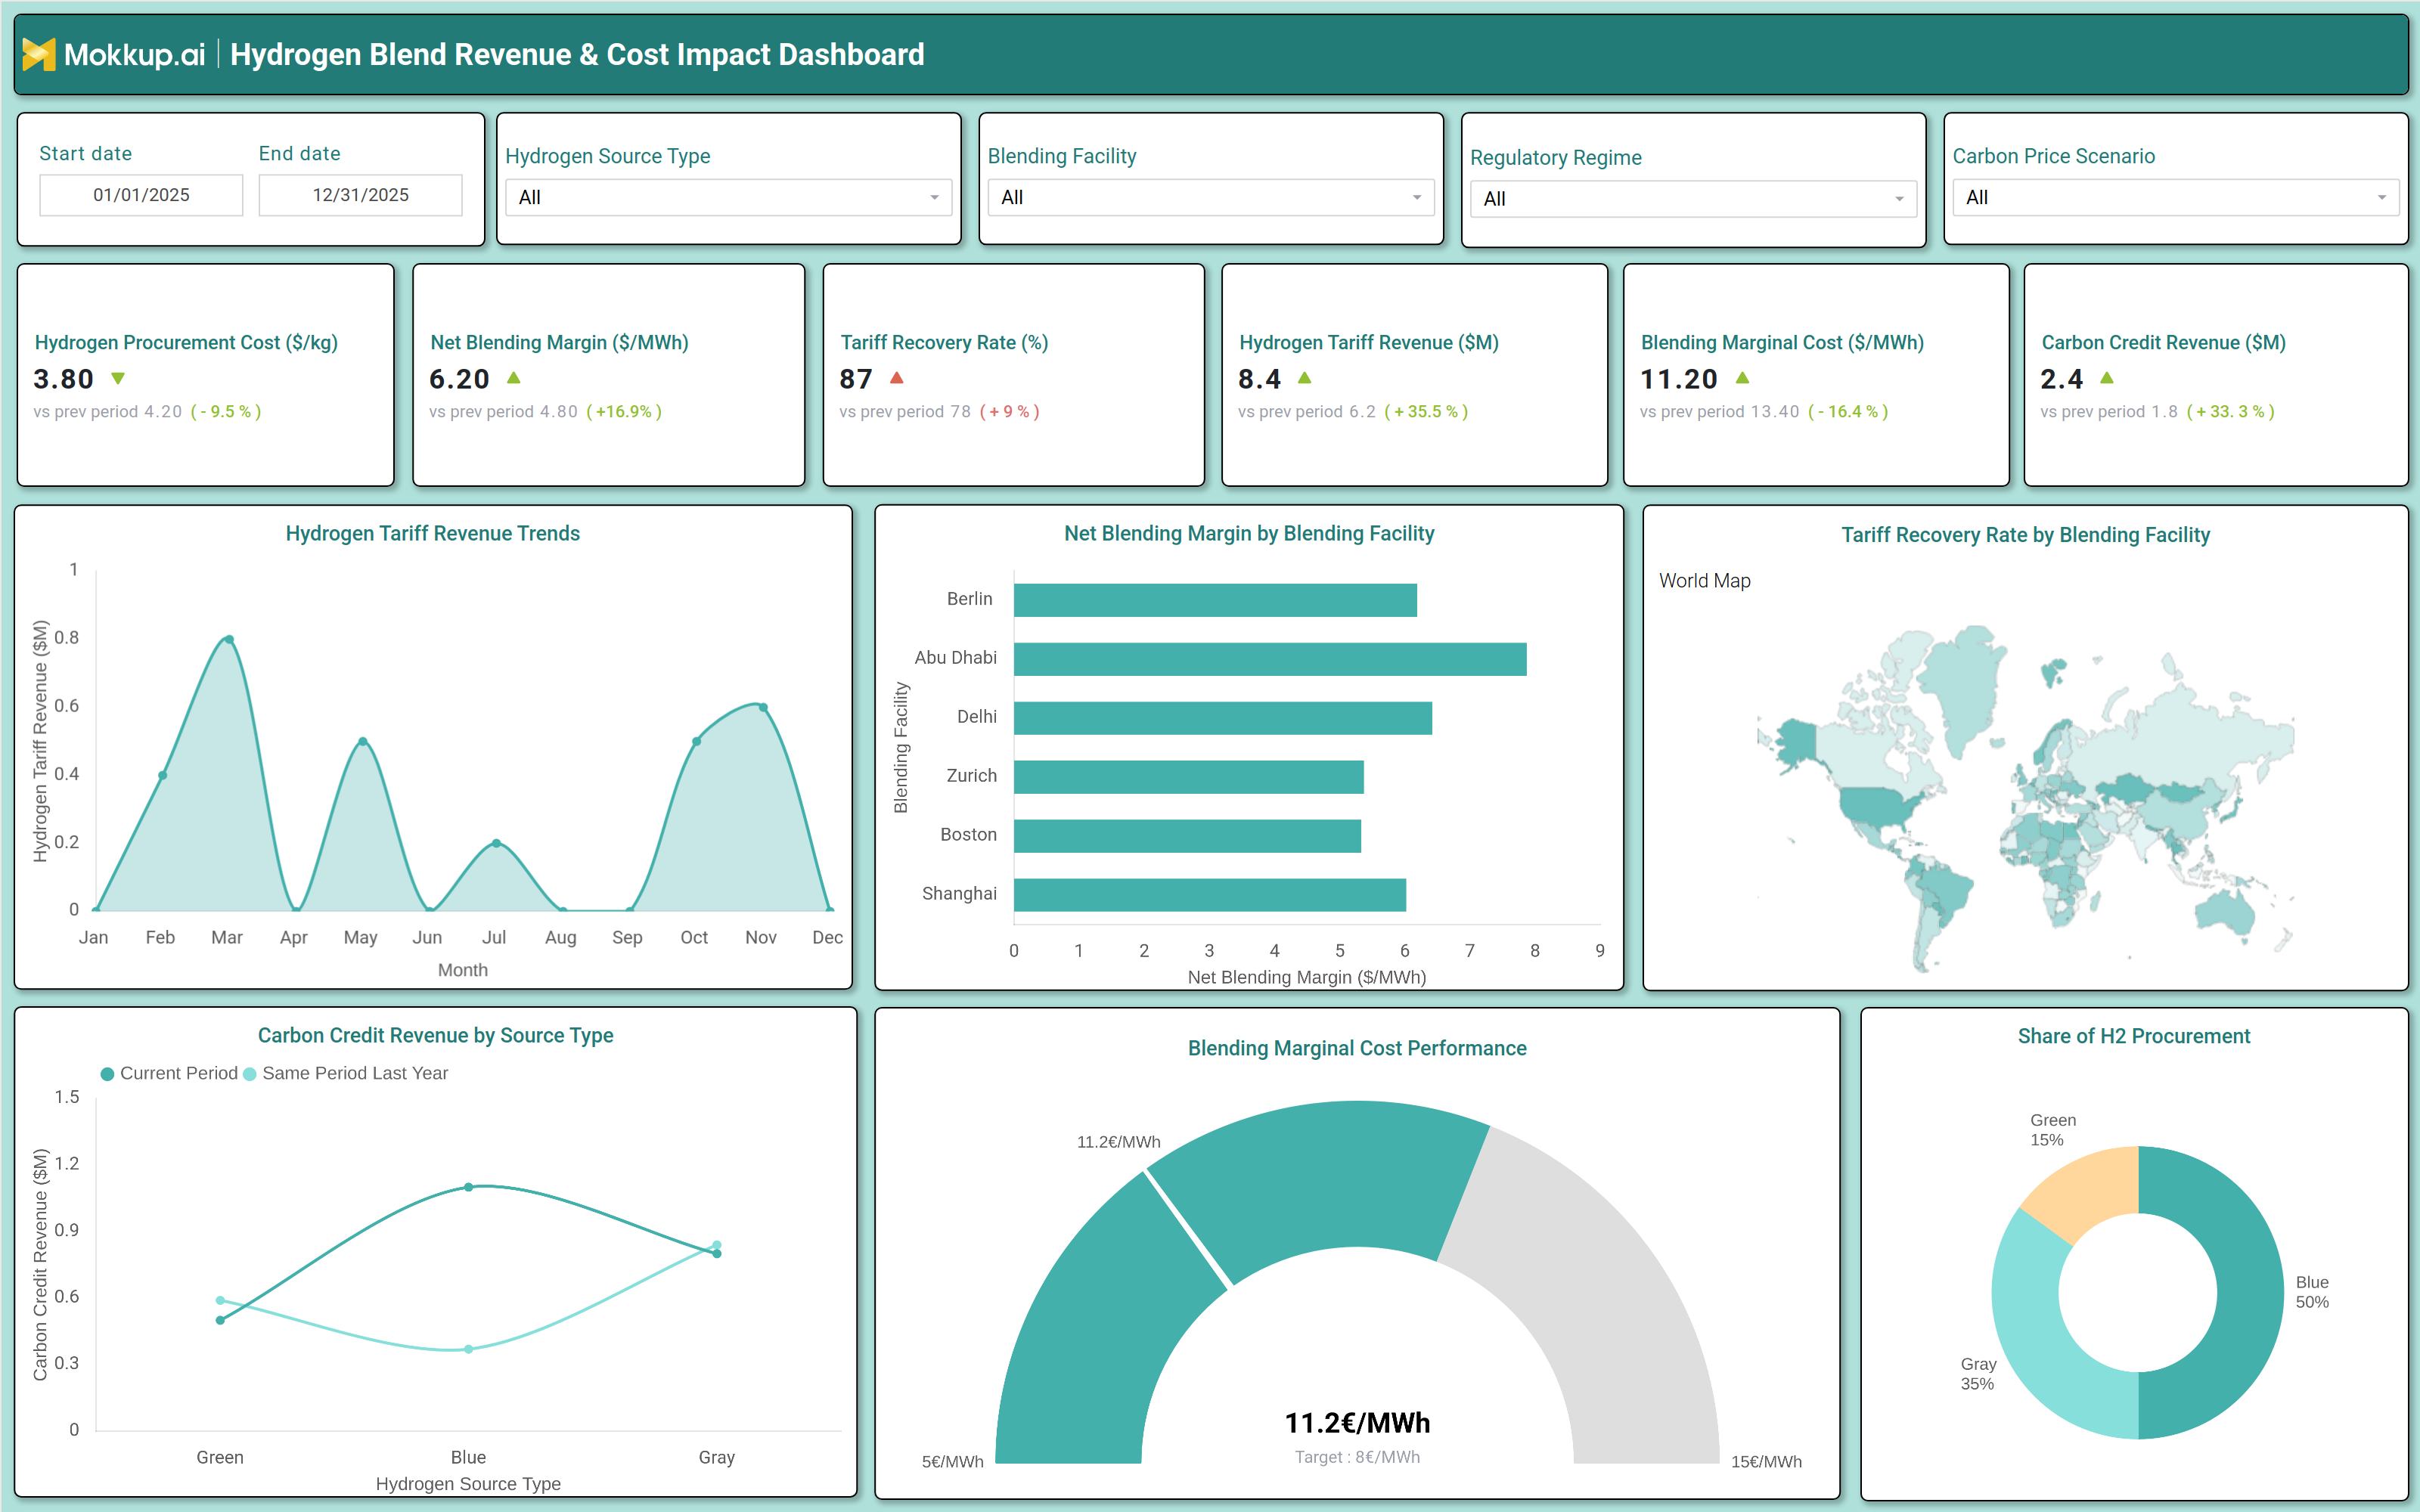
A typical hydrogen gas financial performance dashboard includes interactive filters for date range, hydrogen source type, blending facility, regulatory regime, and carbon price scenarios. Key performance tiles display hydrogen procurement cost per kg, net blending margin per MWh, tariff recovery rate, hydrogen tariff revenue, blending marginal cost, and carbon credit revenue. Trend charts show monthly hydrogen tariff revenue fluctuations, while bar graphs compare net blending margins across different blending facilities. A world map visualizes tariff recovery rates by region, and a pie chart breaks down hydrogen procurement by source type (green, blue, gray). A gauge chart tracks blending marginal cost performance against target benchmarks. Together, these components provide a comprehensive view of financial health, cost efficiency, and revenue potential for hydrogen gas operations.
How to Analyze Data in a Hydrogen Blend Revenue & Cost Impact Dashboard
Here is how you can analyze data from this carbon credit revenue dashboard for gas utilities:
- Evaluate hydrogen procurement costs to identify cost-saving opportunities in sourcing green, blue, or gray hydrogen.
- Monitor net blending margins to assess profitability across different blending facilities and time periods.
- Track tariff recovery rates to ensure revenue alignment with regulatory and operational costs.
- Compare hydrogen tariff revenue trends against previous periods to detect growth or decline patterns.
- Analyze blending marginal costs to optimize operational efficiency and reduce expenses.
- Review carbon credit revenue by hydrogen source type to maximize earnings from decarbonization incentives.
- Assess geographic performance using the world map to identify high-performing regions for tariff recovery.
- Benchmark blending cost performance against industry targets to maintain competitive pricing.
Benefits of a Hydrogen Blend Revenue & Cost Impact Dashboard
The following are the benefits of using this hydrogen tariff recovery monitoring dashboard:
- Enhances Financial Visibility: Consolidates revenue, cost, and profitability metrics into a single, unified view, enabling stakeholders to quickly assess overall financial performance and identify trends.
- Optimizes Hydrogen Procurement: Compares costs across green, blue, and gray hydrogen sources to help organizations choose the most cost-effective and sustainable procurement strategy.
- Improves Blending Profitability: Supports margin analysis and cost control measures, ensuring that hydrogen blending operations remain profitable and efficient.
- Supports Regulatory Compliance: Tracks tariff recovery and carbon credit earnings, helping businesses stay aligned with regulatory requirements while maximizing financial incentives.
- Enables Data-Driven Decision Making: Provides actionable insights for hydrogen gas investments and operational adjustments, reducing reliance on guesswork and improving strategic planning.
- Reduces Financial Risks: Identifies cost inefficiencies and revenue gaps early, allowing organizations to take corrective actions before issues escalate.
- Accelerates Decarbonization Efforts: Maximizes carbon credit revenue and improves blending efficiency, supporting sustainability goals while maintaining economic viability.
KPIs to Track in a Hydrogen Blend Revenue & Cost Impact Dashboard
The following key KPIs can be tracked by using this hydrogen blending margin tracking dashboard:
- Hydrogen Procurement Cost (€/kg): Measures the cost of acquiring hydrogen per kilogram, helping assess sourcing efficiency.
- Net Blending Margin (€/MWh): Tracks profitability per megawatt hour of blended gas, indicating financial performance.
- Tariff Recovery Rate (%): Shows the percentage of costs recovered through tariffs, ensuring revenue alignment.
- Hydrogen Tariff Revenue (€M): Tracks total revenue generated from hydrogen gas sales.
- Blending Marginal Cost (€/MWh): Measures the additional cost of blending hydrogen, helping control expenses.
- Carbon Credit Revenue (€M): Tracks earnings from carbon credits, supporting decarbonization incentives.
Frequently Asked Questions
1. What is a hydrogen blend gas financial performance dashboard?
A hydrogen blend revenue impact analysis dashboard is a financial analytics tool that tracks revenue, costs, and profitability for natural gas utilities blending hydrogen with natural gas. It helps utilities optimize blending strategies, monitor tariff recovery, and assess earnings from carbon credits.
2. Who should use a natural gas utility hydrogen cost analytics dashboard?
Utility financial analysts, operations managers, regulatory compliance teams, and executive leadership use this dashboard to track financial health, optimize blending operations, and ensure cost-effective decarbonization.
3. What data sources feed into a hydrogen blend gas revenue impact analysis dashboard?
Data sources include hydrogen procurement systems, blending facility logs, tariff revenue records, carbon credit registries, and regulatory compliance reports.