
What is a Hydroelectric Power Plant SCADA Health Dashboard?
A Hydroelectric Power Plant SCADA Health Dashboard is a centralized monitoring tool designed for plant managers, maintenance supervisors, and reliability engineers. It provides a comprehensive overview of the health and performance of the Supervisory Control and Data Acquisition (SCADA) system, which is the nerve center of the plant's operations. This dashboard offers visibility into system availability, device status, network performance, and alarm trends. By tracking these critical system metrics, the dashboard helps ensure operational reliability, guide maintenance schedules, and prevent unexpected downtime, making it an essential tool for plant efficiency and safety.
How to Create a Hydroelectric Power Plant SCADA Health Dashboard
You don't need to build your report from scratch—just start with a ready-to-use Hydroelectric Power Plant SCADA Health Dashboard template from Mokkup. Add in your data and export it however you like. Here’s how to do it:
1. Create or Log in to Your Mokkup Account
Start by signing up on Mokkup.ai using your email. If you already have an account, just log in, and you’ll be good to go.
2. Choose and Customize Your Dashboard Template
Find the Hydroelectric Power Plant SCADA Health Dashboard template in the Templates section. Use the drag-and-drop editor to adjust KPIs, edit filters, or add elements based on your data.
3. Export to Your BI Tool
Once your dashboard wireframe is ready, use the BI Tool Export feature to send it directly to Power BI or Tableau for further analysis and enhancements. You can also download the dashboard as a PDF, PNG, or JPEG, embed it on a platform, or invite your team to collaborate.
Note: This is a Pro template. You’ll need a Pro subscription on Mokkup to use and customize this dashboard wireframe. Upgrade anytime to unlock full access.
Hydroelectric Power Plant SCADA Health Dashboard Example
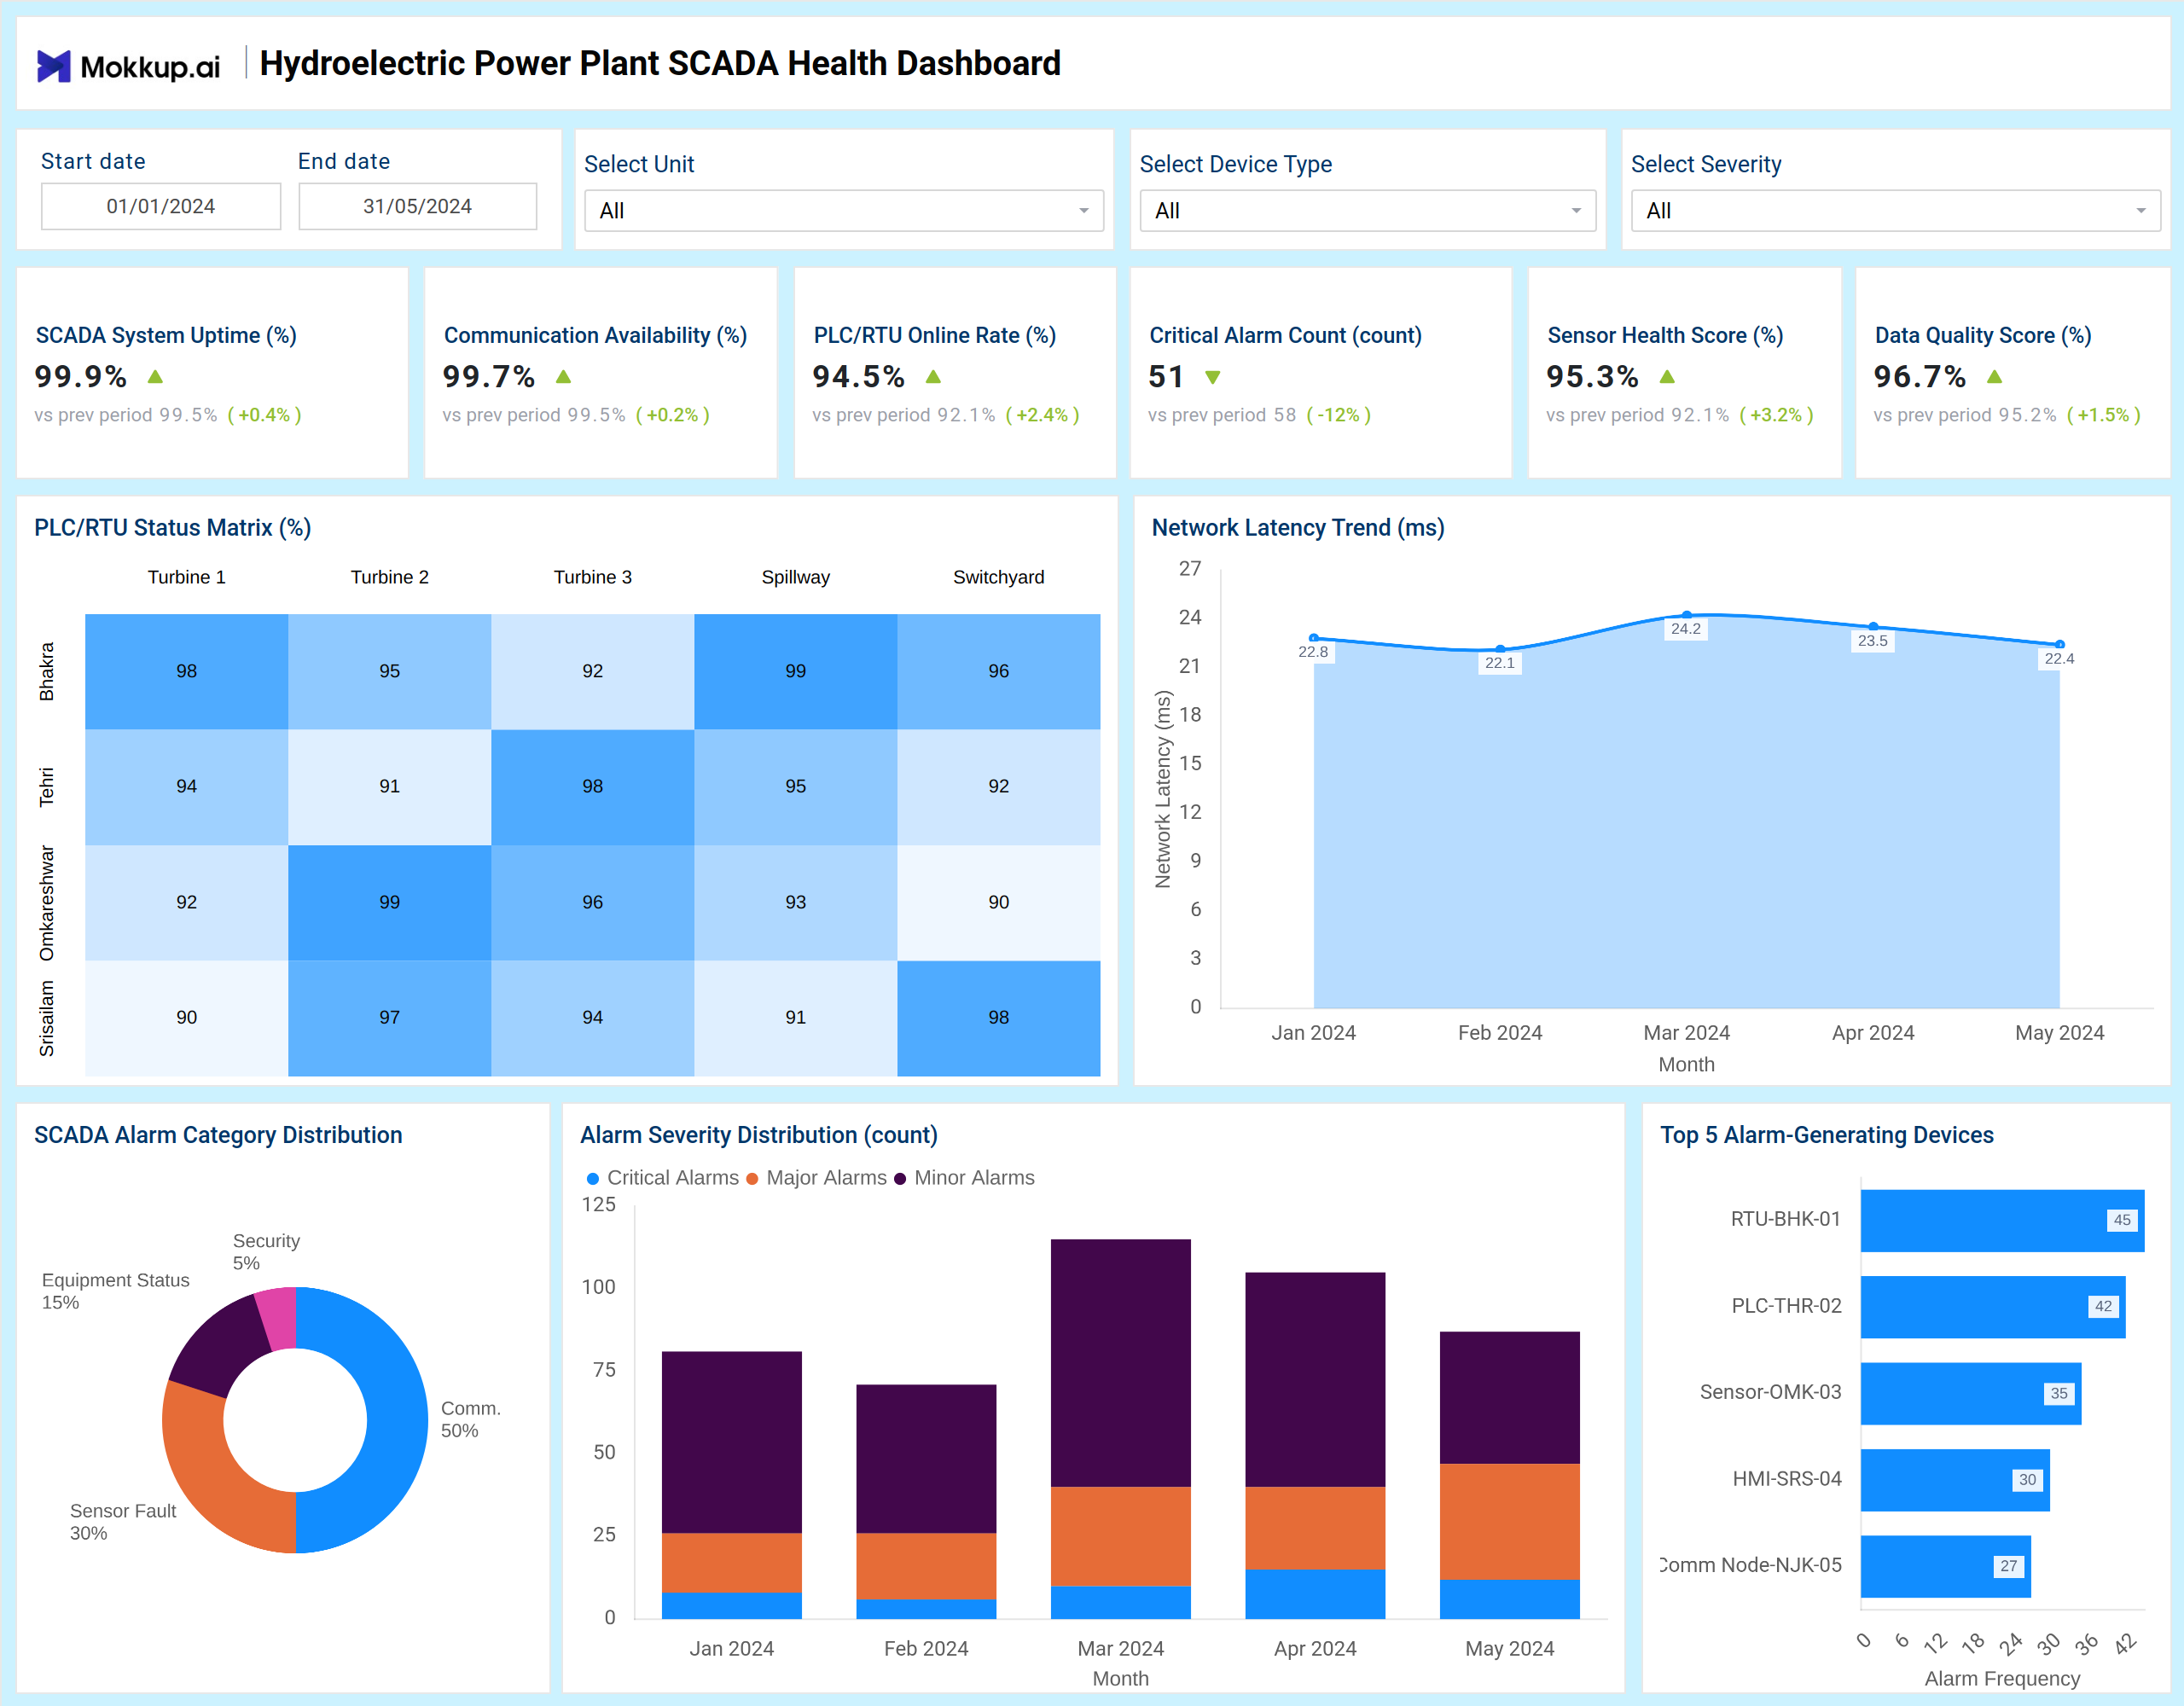
You can create a Hydroelectric Power Plant SCADA Health Dashboard with a mix of KPI tiles and visualizations. At the top, KPI cards track key metrics, including SCADA System Uptime, Communication Availability, and Critical Alarm Count. Below that, a status matrix displays the online rates for critical devices, such as turbines and the spillway. Charts display the Network Latency Trend over time and the distribution of alarms by category and severity. A list of the top alarm-generating devices helps prioritize troubleshooting. Together, this dashboard serves as a tool for tracking SCADA health metrics in power generation, providing engineers with a clear picture of system integrity.
How to Analyze Data in Hydroelectric Power Plant SCADA Health Dashboards
Here’s how plant teams can make the most of the data available on the Hydroelectric SCADA health dashboard:
- Monitor System Reliability: Track SCADA System Uptime and Communication Availability to ensure the control system is consistently operational.
- Assess Device Health: Use the PLC/RTU Online Rate and Status Matrix to identify underperforming devices across turbines, spillways, and the switchyard.
- Analyze Network Performance: Review the Network Latency Trend to spot deteriorations or spikes that could impact data transmission and control.
- Prioritize Alarm Response: Study the Alarm Category and Severity Distributions, along with the Top Alarm-Generating Devices list, to focus engineering efforts on the most critical issues.
- Evaluate Data Integrity: Check the Sensor Health Score and Data Quality Score to ensure the information driving decisions is accurate and reliable.
Benefits of Hydroelectric Power Plant SCADA Health Dashboards
The following are benefits of using hydroelectric power plant SCADA workflow and performance dashboard:
- Improved System Reliability: Tracks uptime and availability to minimize the risk of uncontrolled downtime.
- Proactive Maintenance: Identifies device and network issues early, allowing for intervention before they cause failures.
- Informed Troubleshooting: Provides clear insights into alarm patterns and problematic devices, speeding up resolution times.
- Enhanced Operational Safety: Monitoring critical alarms and device status helps maintain safe operating conditions.
- Performance Benchmarking: Allows comparison of current system health against previous periods to measure improvement.
- Focused Resource Allocation: Helps direct technical resources to the areas of the system that need them most.
Together, these elements provide plant leadership with operational and technical visibility, making it easier to align maintenance with performance goals. That’s why many plant managers consider it the best SCADA health dashboard for hydroelectric plants, ensuring system reliability.
KPIs to Track in Hydroelectric Power Plant SCADA Health Dashboards
- SCADA System Uptime (%): The percentage of time the core SCADA system is operational and available for monitoring and control.
- Communication Availability (%): The reliability of the communication networks connecting the SCADA servers to field devices.
- PLC/RTU Online Rate (%): The proportion of Programmable Logic Controllers (PLCs) and Remote Terminal Units (RTUs) that are successfully communicating with the SCADA system.
- Critical Alarm Count: The number of high-priority alarms indicating conditions that require immediate attention to avoid equipment damage or safety hazards.
- Sensor Health Score (%): A measure of the operational status and data reliability of sensors throughout the plant.
- Data Quality Score (%): An assessment of the accuracy, completeness, and consistency of the data being collected by the SCADA system.
- Network Latency (ms): The time delay in data transmission across the plant's control network.
Frequently Asked Questions
1. Who should use a Hydroelectric Power Plant SCADA Health Dashboard?
Plant managers, control system engineers, maintenance supervisors, and reliability teams are responsible for ensuring the continuous and safe operation of the power plant.
2. Can this dashboard help reduce unplanned downtime?
Yes. By providing early warnings on device failures, communication issues, and rising alarm counts, it enables proactive maintenance that prevents many causes of unplanned outages.
3. How does it support maintenance planning?
It identifies devices with poor health scores or frequent alarms, allowing teams to schedule inspections and repairs before a catastrophic failure occurs.
4. Is this helpful dashboard for performance reporting?
Yes, because a hydroelectric power plant's SCADA workflow and performance dashboard support operational reviews, compliance audits, and management reporting by documenting system health and trends.