
What is a Hydroelectric Power Plant R&D Monitoring Dashboard?
A Hydroelectric Power Plant R&D Monitoring Dashboard is a visual management tool designed to track and evaluate research and development activities across hydroelectric facilities. It consolidates key data on R&D investment, project progress, innovation outcomes, technical testing results, and resource allocation into a single, easy-to-understand platform. By combining hydroelectric R&D project tracking, innovation performance monitoring, and technical testing insights, the dashboard enables R&D managers, engineers, and leadership to measure ROI on innovation, identify bottlenecks, prioritize high-impact projects, and accelerate the deployment of efficiency and reliability improvements in hydroelectric operations.
How to Create a Hydroelectric Power Plant R&D Monitoring Dashboard
You don’t need to build your report from scratch—just start with a ready-to-use Hydroelectric power plant R&D monitoring dashboard template from Mokkup. Add in your data and export it however you like. Here’s how to do it:
1. Create or Log in to Your Mokkup Account
Start by signing up on Mokkup.ai using your email. If you already have an account, just log in, and you’ll be good to go.
2. Choose and Customize Your Dashboard Template
Find the Hydroelectric power plant R&D monitoring dashboard template in the Templates section. Use the drag-and-drop editor to adjust KPIs, edit filters, or add elements based on your data.
3. Export to Your BI Tool
Once your dashboard wireframe is ready, use the BI Tool Export feature to send it directly to Power BI or Tableau for further analysis and enhancements. You can also download the dashboard as a PDF, PNG, or JPEG, embed it on a platform, or invite your team to collaborate.
Note: This is a Pro template. You’ll need a Pro subscription on Mokkup to use and customize this dashboard wireframe. Upgrade anytime to unlock full access.
Hydroelectric Power Plant R&D Monitoring Dashboard Example
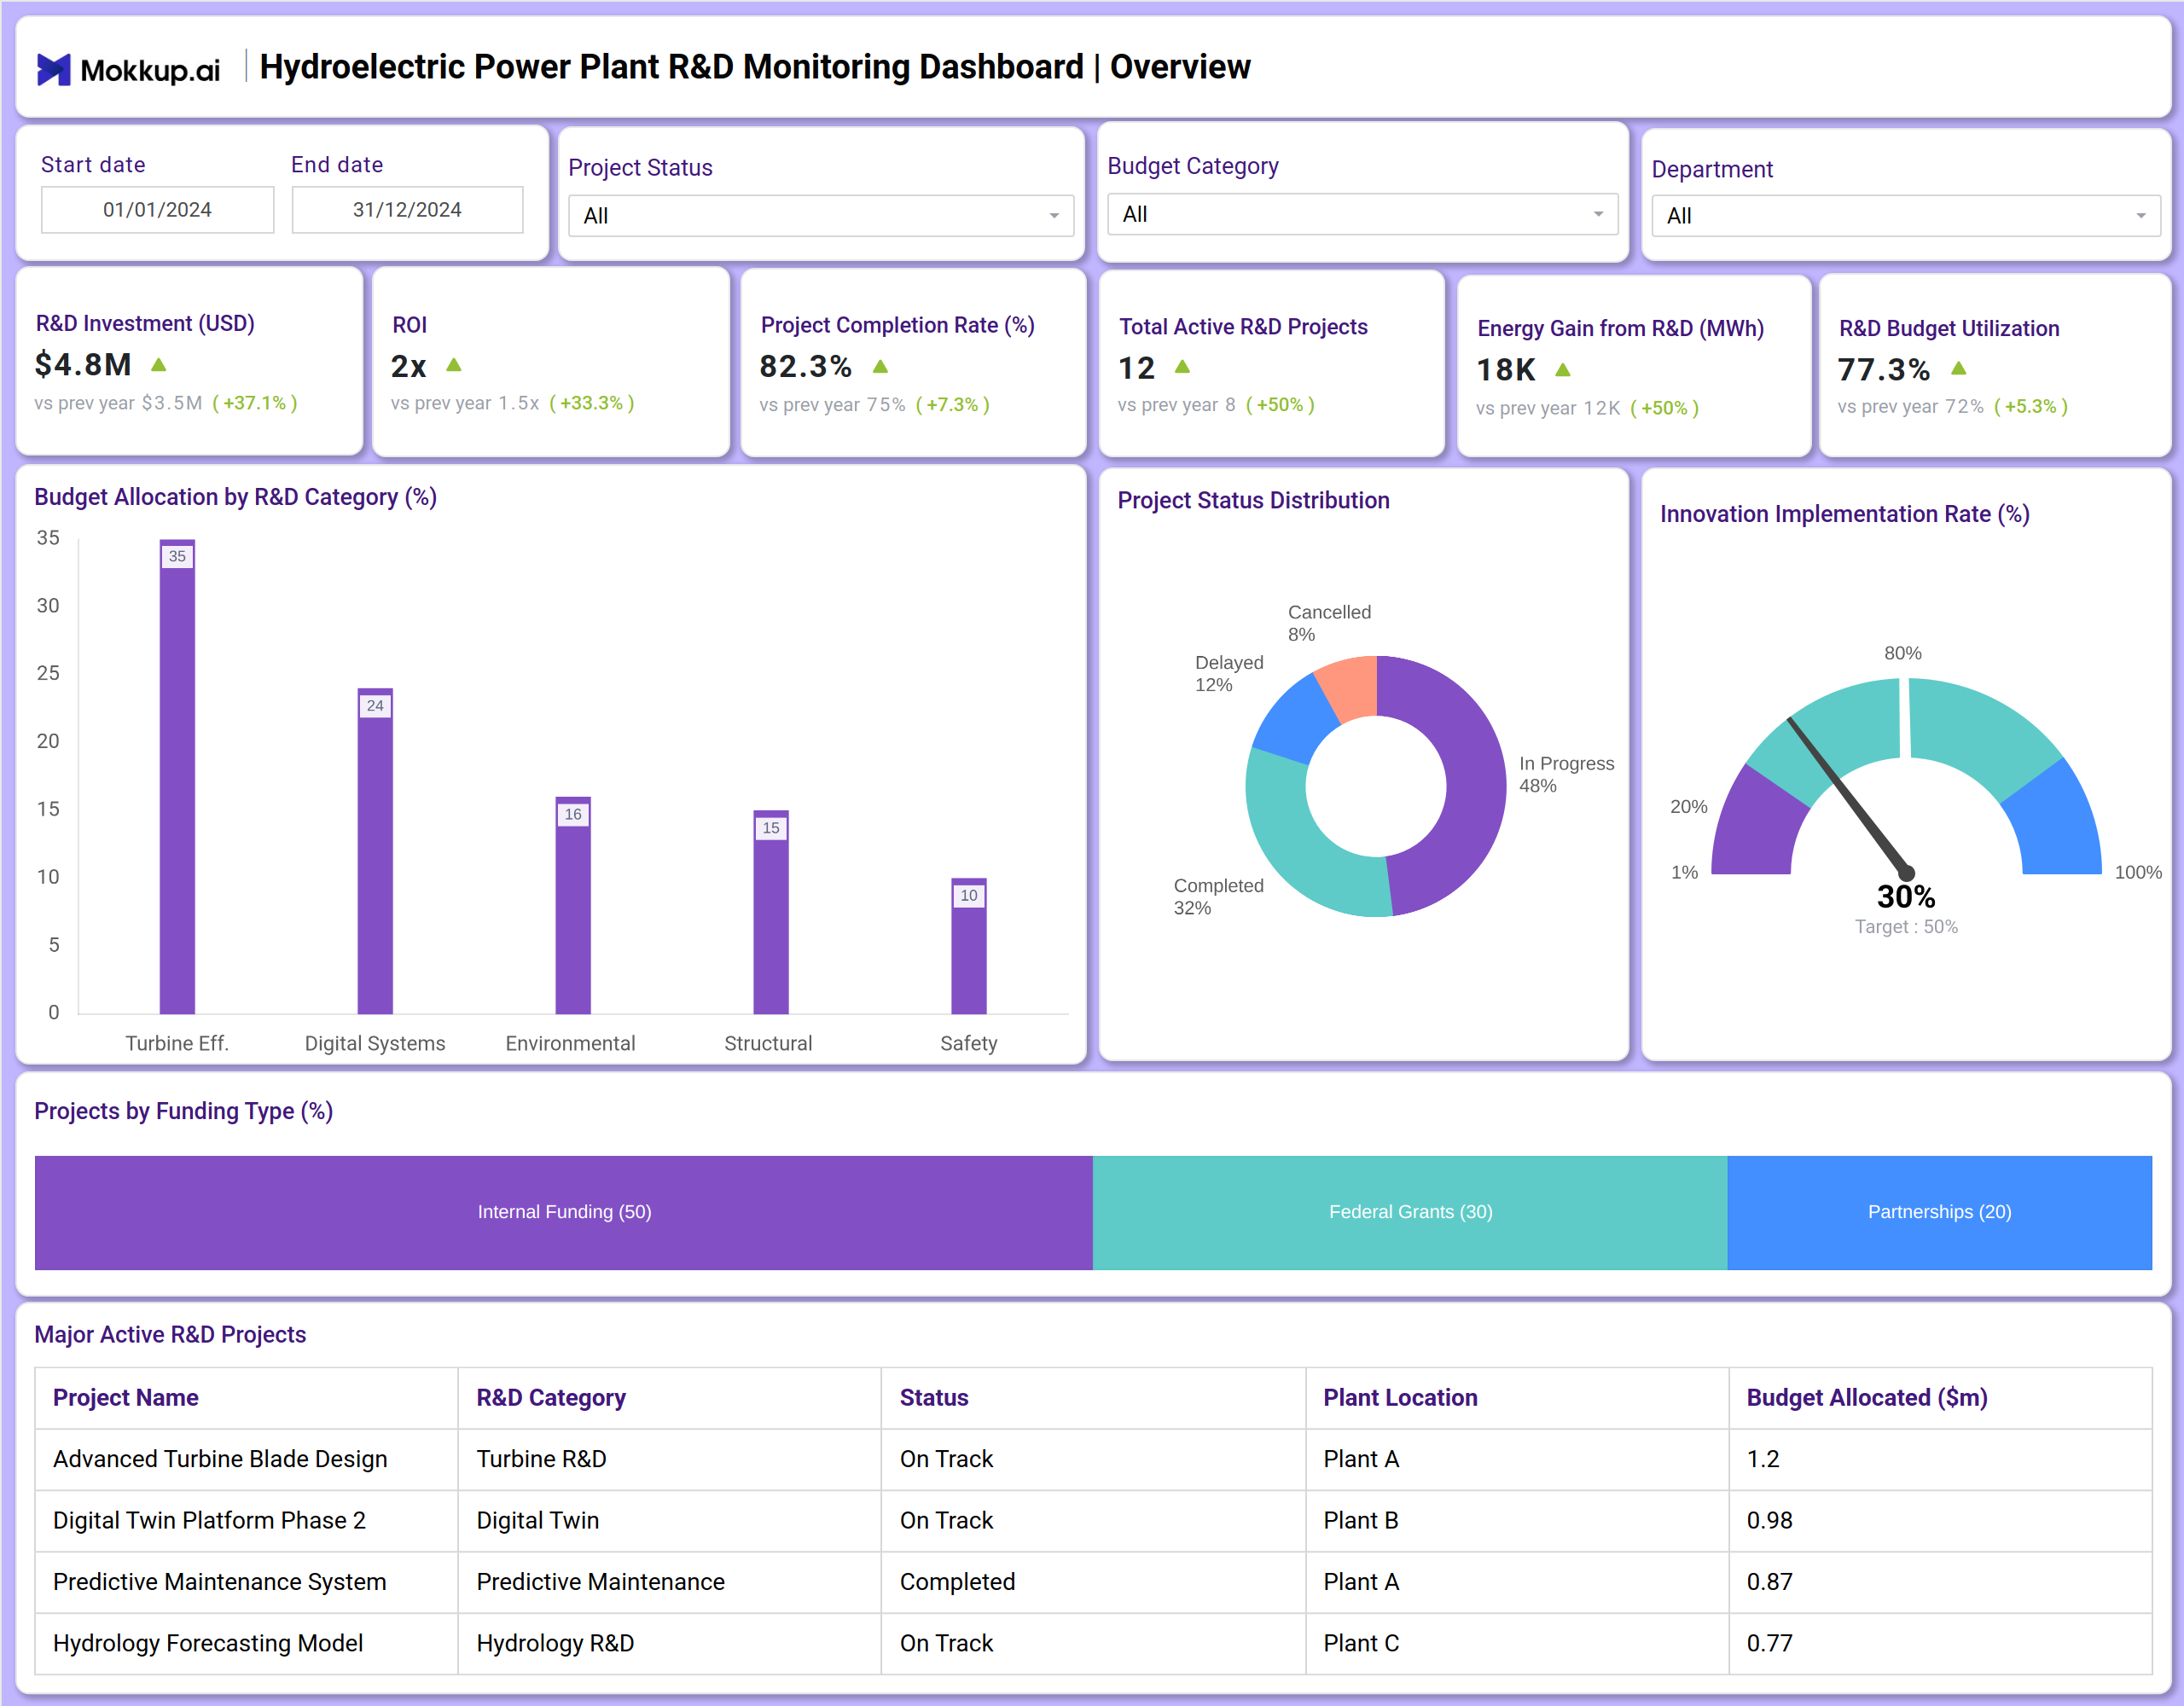
You can create a Hydroelectric Power Plant R&D Monitoring Dashboard that provides a comprehensive view of R&D performance through two dedicated screens. The Overview screen displays overall R&D investment, ROI, project completion rates, active projects, energy gains from innovations, and budget utilization. It includes budget allocation by R&D category (e.g., Turbine Efficiency, Digital Systems), some project management KPIs, and a list of major active projects with allocated budgets. The Technical Insights screen dives deeper into engineering outcomes, showing turbine efficiency improvements, prototype success rates, sensor accuracy, cycle times, failure mode distribution, and detailed turbine prototype test results, helping teams focus on cavitation reduction, vibration control, and predictive maintenance advancements.
How to Analyze Data in Hydroelectric Power Plant R&D Monitoring Dashboard
Here is how you can analyze data from this Hydroelectric power plant dashboard template
- Study Funding Impact: Review R&D Investment and ROI trends to understand how effectively research spending is converting into measurable returns.
- Spot Project Delays Early: Track the Project Completion Rate and Project Status Distribution to identify bottlenecks and decide where resources need to shift.
- Measure Operational Gains: Look at Energy Gain from R&D and Turbine Efficiency Improvement to see how research outcomes are contributing to real-world performance.
- Strengthen Designs: Analyze the Prototype Success Rate and Failure Mode Distribution to learn what’s working, what’s failing, and where design improvements are needed.
- Check Innovation Momentum: Assess the Innovation Implementation Rate against targets to understand how quickly R&D outputs are being adopted in the plant.
- Optimize Budget Use: Examine R&D Budget Utilization and category-wise allocation to ensure funds are flowing into the most critical focus areas like turbine efficiency or predictive maintenance.
Benefits of Hydroelectric Power Plant R&D Monitoring Dashboard
The following are the benefits of using this dashboard:
- Provides centralized visibility into all hydroelectric R&D activities and outcomes.
- Accelerates decision-making with clear insights into project health, technical performance, and financial returns.
- Improves resource allocation by highlighting underperforming or high-impact R&D categories.
- Enhances innovation performance monitoring through measurable KPIs on efficiency gains and prototype success.
- Supports strategic planning by linking R&D efforts directly to energy output and cost savings.
- Strengthens reporting to executives and funding bodies with evidence-based R&D ROI monitoring.
- Reduces project delays through early identification of bottlenecks and risk areas.
- Drives continuous improvement in turbine reliability, cavitation reduction, and predictive maintenance capabilities.
KPIs to Track in Hydroelectric Power Plant R&D Monitoring Dashboard
The following key KPIs can be tracked by using this dashboard:
- R&D Investment (USD): Total budget allocated to research and development activities for the period.
- ROI: Return on Investment calculated from energy gains, maintenance savings, and efficiency improvements delivered by completed R&D projects.
- Project Completion Rate (%): Percentage of R&D projects completed on schedule versus total projects planned.
- Total Active R&D Projects: Current number of ongoing research and development initiatives.
- R&D Budget Utilization (%): Percentage of allocated R&D budget actually spent within the reporting period.
- Turbine Efficiency Improvement (%): Average increase in turbine efficiency achieved through R&D projects.
- Prototype Success Rate (%): Percentage of prototypes that meet or exceed performance targets during testing.
- R&D Cycle Completion Time (days): Average time taken from project initiation to completion or implementation.
- Innovation Implementation Rate (%): Percentage of successfully completed R&D outcomes that have been deployed in operating plants.
Frequently Asked Questions
1. What is the main purpose of a Hydroelectric R&D dashboard?
It tracks the performance, progress, and impact of all research and development activities to maximize innovation value in hydroelectric power generation.
2. How does it help improve turbine performance?
By monitoring turbine efficiency gains, prototype test results, cavitation reduction progress, and vibration reduction outcomes in one place.
3. Can it show which R&D areas deliver the highest ROI?
Yes, through ROI tracking, energy gain metrics, and budget allocation breakdowns by category.
4. Does it support predictive maintenance research?
Absolutely—it tracks predictive maintenance projects, sensor accuracy, and energy loss reduction results.
5. Who typically uses this dashboard?
R&D managers, hydroelectric engineers, plant directors, innovation officers, and executive leadership responsible for technology strategy.